Calculate your SIP ReturnsExplore

The Nifty 50 index on the NSE surged to a record high of 22,630.85 on Monday, showing a 0.47% increase. Most sectors were in the green, with Nifty Realty leading the pack with a more than 2% jump, reaching a fresh all-time high of 960.40. This sector has been one of the top performers in FY24.
Taking a closer look at the technical analysis of Nifty Realty: The index has experienced a notable 67% increase from its lows in October 2023. After this surge, it faced a brief setback, dipping about 14% below its all-time high before bouncing back to set a new high. This price action has formed what technical analysts call an inverted head and shoulder pattern on the daily chart, indicating a potential bullish trend. In terms of retracement, the index only retraced about 24% of its previous sharp up-move during a recent 18.6% rally, suggesting a strong price structure.
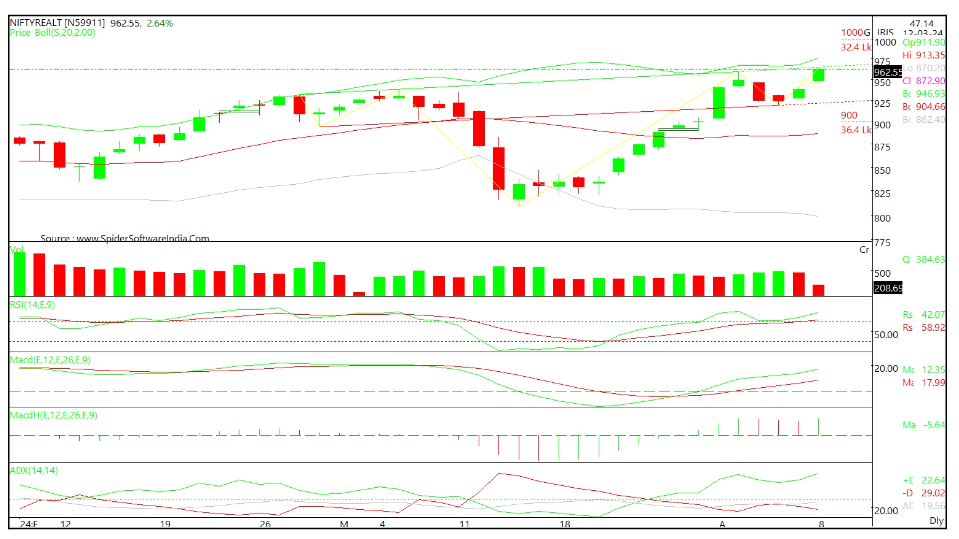
The daily Moving Average Convergence Divergence (MACD) indicator is showing upward momentum and remains above its nine-period average, supporting a positive outlook. Additionally, the daily 14-period Relative Strength Index (RSI) has rebounded from its nine-period average, further reinforcing the positive sentiment.
The Average Directional Index (ADX), a trend strength indicator, stands at 23, indicating a strengthening trend, with the ADX in an upward trajectory. The positive directional indicator (+DI) is notably higher than the negative directional indicator (-DI), indicating bullish strength in the index.
Looking ahead, based on technical analysis, the immediate target for Nifty Realty is estimated to be about 4% higher from its breakout level, while a longer-term target could be around 13.65% above the breakout level, considering the depth of the head in the inverted head and shoulder pattern. Therefore, investors may watch for a breakout above the key level of 966-967 for potential further upside movement in the index.
Disclaimer: This blog has been written exclusively for educational purposes. The securities mentioned are only examples and not recommendations. It is based on several secondary sources on the internet and is subject to changes. Please consult an expert before making related decisions.
Enjoy Zero Brokerage on Equity Delivery
Join our 2 Cr+ happy customers

Get the link to download the App

Enjoy Zero Brokerage on
Equity Delivery