Calculate your SIP ReturnsExplore

The Nifty Mid-cap index experienced a remarkable rally from its March 2023 lows of 29,200 to a high of 49,780.65 in February 2024, marking a surge of almost 70%. Despite a minor correction of nearly 10% between September and October 2023, the index recently garnered attention for one of its sharpest weekly falls since December 2022.
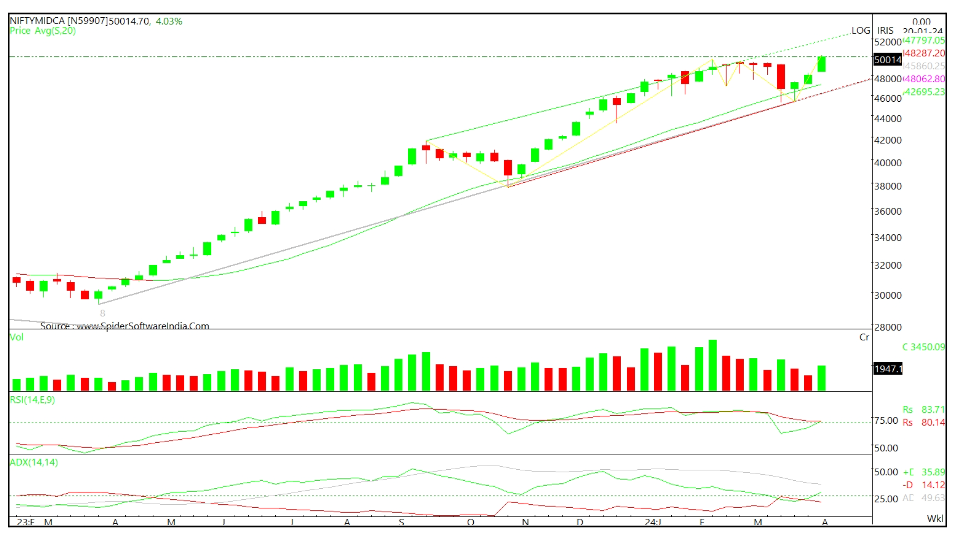
Despite the sharp correction, the index maintained its weekly important support level defined by the rising 20-week moving average (20-WMA). Although it briefly dipped below this support level intraweek, it did not close below the 20-WMA. Furthermore, the Nifty Mid-Cap index swiftly executed a V-shaped recovery, retracing its decline from February highs to March lows in a short timeframe, indicating a robust price structure.
The recent correction in the Nifty mid-cap index remained contained at 8.81% from its peak, historically aligning with bull market corrections averaging around 11%, suggesting no imminent signs of reversal. In terms of seasonality, from 2020 to 2023, April has consistently delivered positive returns for the Nifty Mid-cap index. Since 2012, there have been only two instances of negative returns in April, highlighting its bullish trend during this month.
During the recent correction, the index formed a hammer-like pattern on the weekly chart around the rising trendline connecting significant swing lows from March 31, 2023. Moreover, the Relative Strength Index (RSI) on the weekly timeframe witnessed a super bullish range shift, remaining above the 60 level throughout.
The index remains clearly in an uptrend with extremely high trend strength. The Average Directional Index (ADX), indicating trend strength, stands at 35.6 on the weekly chart, well above the threshold of 25 considered indicative of a strong trend. Additionally, the positive directional indicator (+DI) is above 28 and trending higher.
Considering the aforementioned factors, there are no apparent signs of reversal in the Mid-cap index, reinforcing its bullish outlook.
Disclaimer: This blog has been written exclusively for educational purposes. The securities mentioned are only examples and not recommendations. It is based on several secondary sources on the internet and is subject to changes. Please consult an expert before making related decisions.
Enjoy Zero Brokerage on Equity Delivery
Join our 2 Cr+ happy customers

Get the link to download the App

Enjoy Zero Brokerage on
Equity Delivery