Calculate your SIP ReturnsExplore

Open Interest (OI) is the number of futures or options (F&O) contracts that are outstanding i.e. not closed yet, on a particular asset. Traders and analysts use the OI data alongside price data to identify the major trends in market sentiment and thereby predict price movements.
To help you incorporate OI into your trading strategy, we have brought to you OI indicators on charts on Angel One. Let us go over these features in detail in the following sections.
With the latest upgrades on Angel One, you will be able to plot open interest directly on the F&O charts.
The process of showing OI on charts is simple:
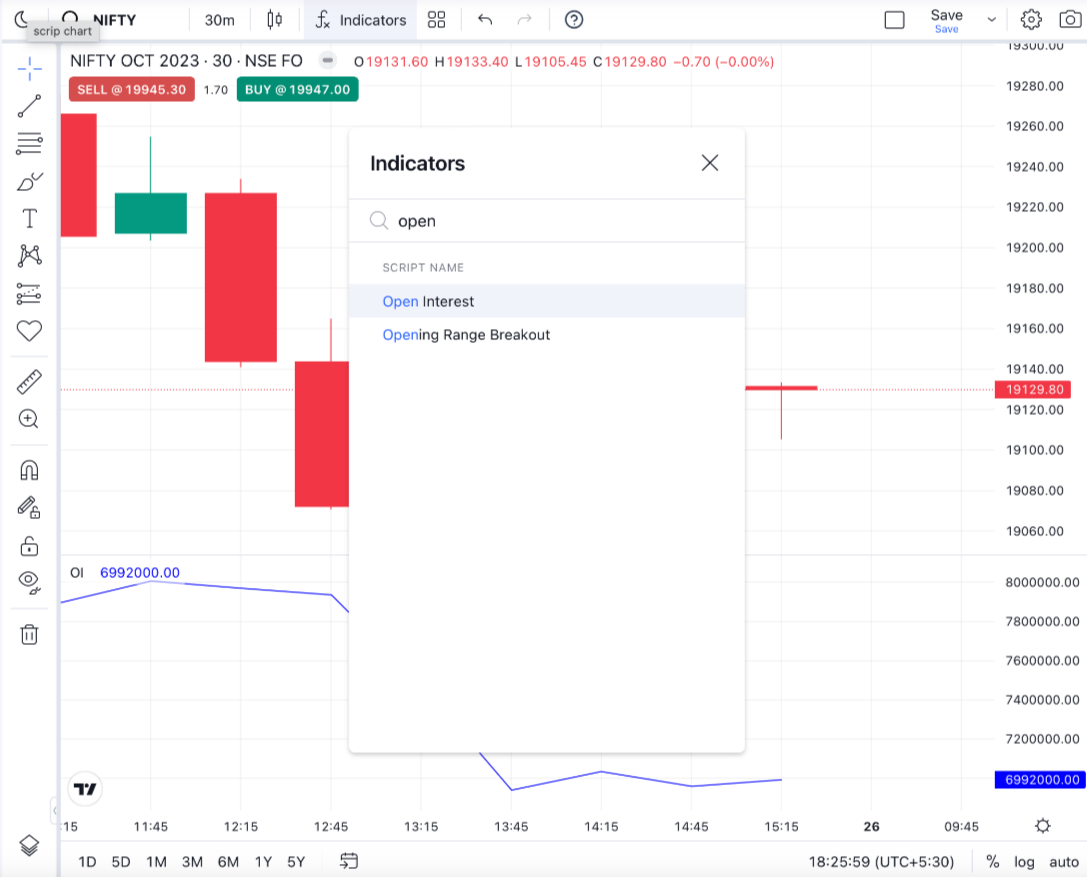
4. The OI line chart will become visible below the price chart.
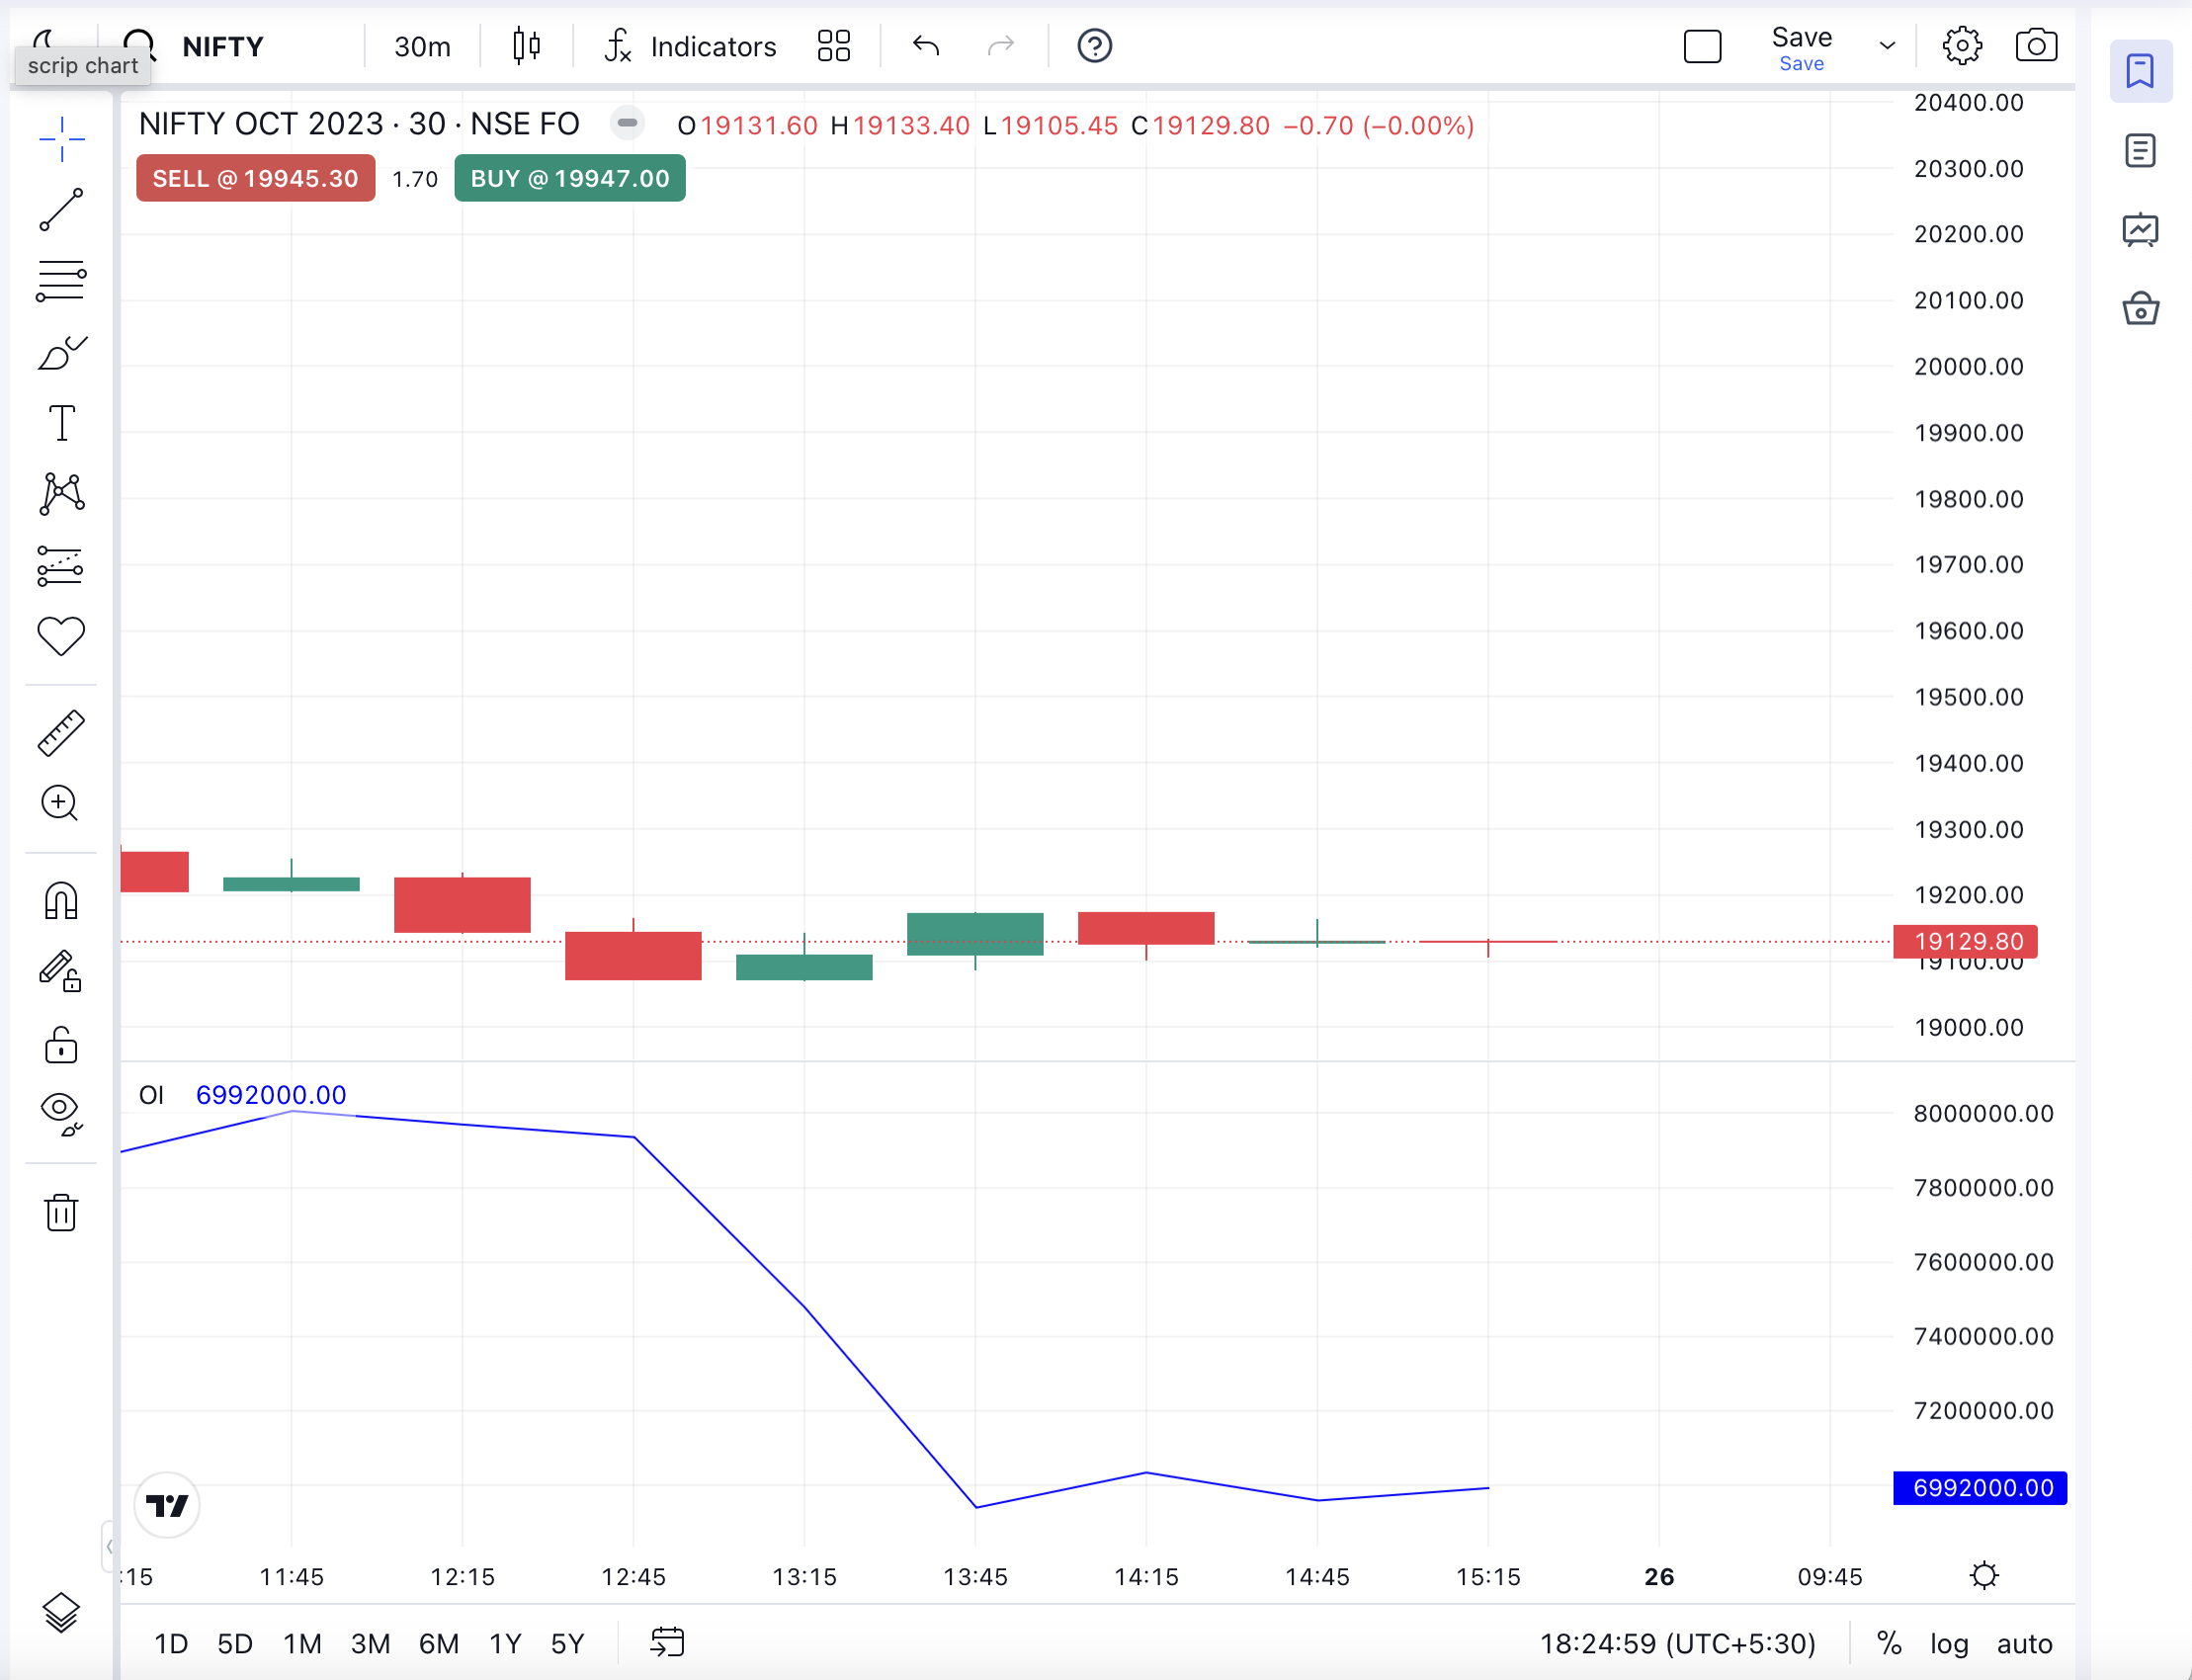
Fig.: The blue line shows the change in OI over time.
Note: The OI values, plotted in the form of a line, refer to the OI of the contract at the end of a period. For example, if you are viewing the option’s chart on the basis of 5 minutes per candle for the time range of the 1 day, then the OI at the end of each 5-minute period will be used to produce the OI line chart.
Also, remember that OI values will show only if the chart is for futures or options. Otherwise, you will not find any OI values even if you click on the OI indicator on the indicator dropdown menu.
The OI of an option or future contract shows the level of confidence that the market forces, especially the major players, have in the price movement. For example, if the OI for Nifty 50 put option at 19,500 is really high, say over 3 lakhs, that means a large number of option sellers believe that the Nifty 50 is likely to move or stay above the 19,500 level on the expiry day.
OI can also be interpreted in the context of price. Check out the following table to understand how OI and price interact with each other:
| OI | Price | Name of the Phenomenon | Interpretation |
| Rising | Rising | Long buildup | The market is strongly bullish. |
| Rising | Falling | Short buildup | The market is strongly bearish. |
| Falling | Rising | Short covering | The traders are likely to be buying back the securities that they had sold earlier. |
| Falling | Falling | Long Unwinding | Sellers are less confident of the price falling further. |
With the upcoming features, you will be able to check changes in OI over time at a much more granular level, that too right on the chart. It will help you identify price trends more easily by checking price and OI trends together, both for daily, weekly and monthly timelines, just like any other indicator.
Open interest is a highly important value that is used by traders using various trading strategies. Follow the Angel One blog and the Angel One Community Page to catch up on our latest product updates as well as market trends.
Enjoy Zero Brokerage on Equity Delivery
Join our 2 Cr+ happy customers

Get the link to download the App

Enjoy Zero Brokerage on
Equity Delivery