Calculate your SIP ReturnsExplore

The index of industrial production (IIP) for the month of April 2017 came in lower at 3.1% compared to 3.8% in the previous month. However, the big takeaway is that the IIP has finally moved into a new post-demonetization trajectory. The demonetization exercise that began in November 2016 had a lagged impact on the IIP in the months of December, January and February during which period the actual IIP stayed around the 2% mark. However, with remonetization gathering momentum, the IIP number in the last 2 months has shown a distinct shift above the 3% mark. The chart below captures this trend…
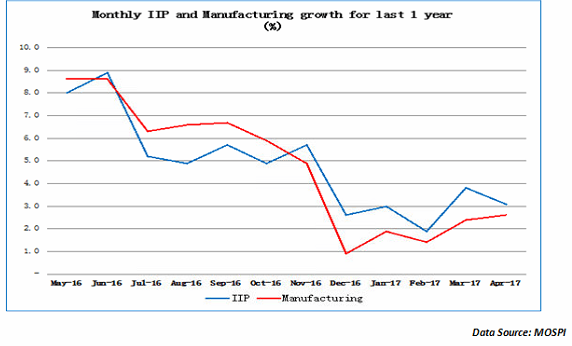
The chart above clearly indicates 2 things. Firstly, the real pressure on the IIP came in the aftermath of demonetization which was around the time the manufacturing growth started falling below the overall IIP growth. Remember, manufacturing accounts for nearly 3/4th of the IIP index and therefore has an oversized impact on the overall IIP. Secondly, there appears to be a case for the IIP getting out of the post demonetization trap with the IIP figuring above the 3% mark for 2 months in succession.
How the key components of IIP fared?
The good news is that the 3 key components of IIP viz. mining, manufacturing and electricity showed a positive growth. While mining grew at 4.2% and manufacturing at 2.6%, it was electricity that actually flattered the street with a 5.6% growth. This may have to do with the new IIP constitution which also includes the contribution of renewable sources of energy. Of course, both electricity and mining continues to be largely government driven and hence the positive growth is not too surprising as the government has been trying its best to boost both these sectors. It is manufacturing where private sector has a major contribution to make. That is what is still putting pressure. The only good news on the manufacturing front is that after bottoming out at 1% in December 2016, the monthly manufacturing IIP has been on a constant uptrend.
How specific industry groups fared in the IIP…
A total of 14 out of the 23 industrial classifications under the manufacturing space showed positive growth for the month of April 2017. Surprisingly, pharmaceutical and botanical products showed the highest growth of 29.1% on a YOY basis. This could be partly attributed to the base effect. Interestingly, the manufacture of machinery and equipment showed a positive growth of 9.5% for the month of April and that is a good sign as it indicates that the production is beginning to pick up in the capital goods sector in anticipation of a pick-up in demand. This could be seen as a lead indicator to a likely pick up in the capital goods cycle.
On the negative side, the manufacture of beverages showed a negative growth of 19% while motor vehicles showed a fall of 15%. This could be more to due to the shift from BS-III environmental norms to BS-IV environmental norms. The sudden shift and the Supreme Court order preventing the sale of BS-III vehicles after April 01st had forced most vehicle companies to focus on disposing off their closing stock in April. If you look at the IIP in user-based terms, de-growth in the capital goods is just about -1%. This is far better than the negative growth we have seen in previous months. When this is combined with the pick-up in production of machinery and equipment it gives us the first signals of a turnaround in the capital goods cycle.
IIP trend in terms of specific products…
In terms of specific products, Digestive enzymes were the top gainer but that should be seen in the light of its small base and the fact that it was just included in the new calculations of IIP. Hot rolled coils (HR coils) a key steel product in construction has also seen a sharp spurt in production. In fact, this year India is likely to move from being a net importer of steel to a net exporter of steel. That has been largely driven by a favourable government policy in terms of restrictions on dumping of steel by China, Russia and South Korea. Among the negative contributors, commercial vehicles continue to see pressure due to the lag effects of demonetization as well as the sharp fall in rural incomes. That number will be keenly watched as a lead indicator of rural and semi-urban purchasing power. Alcoholic drinks also saw a sharp fall and this could be broadly attributed to the imposition of prohibition in some states as well as the ban on sale of liquor near the highways.
Does the IIP justify a rate hike by the RBI?
In the first meeting of the Monetary Policy Committee (MPC) in October 2016, the members had mentioned weak IIP as a key justification for a 25 basis points interest rate cut. Currently, we have 3 factors favouring a rate cut by the RBI. Firstly, there is the inflation rate which has come to a five year low. Secondly, there is the GDP number for the fourth quarter which is almost 100 bps below the original estimates. Now, we have the IIP number which is showing signs of pick-up post demonetization. However, what is required at this point of time is a boost from the RBI in the form or a rate cut. Whether a rate cut will immediately result in a rise in credit off-take or not is hard to predict. But at this juncture, it is a risk worth taking!
Enjoy Zero Brokerage on Equity Delivery
Join our 2 Cr+ happy customers

Get the link to download the App

Enjoy Zero Brokerage on
Equity Delivery