Calculate your SIP ReturnsExplore

You can now find the following indicators on Angel One and add them to your charts:
Let us read, in further detail, what each of these indicators represents.
Central Pivot Range or CPR gives values that help you understand the patterns in the asset’s price and thus choose the right prices to enter or exit trades.
The exact values of CPR are based on the Open, High, Low, and Close prices of the asset for every time period.
Once you choose to view the CPR from the indicators menu, you can see three separate lines representing:
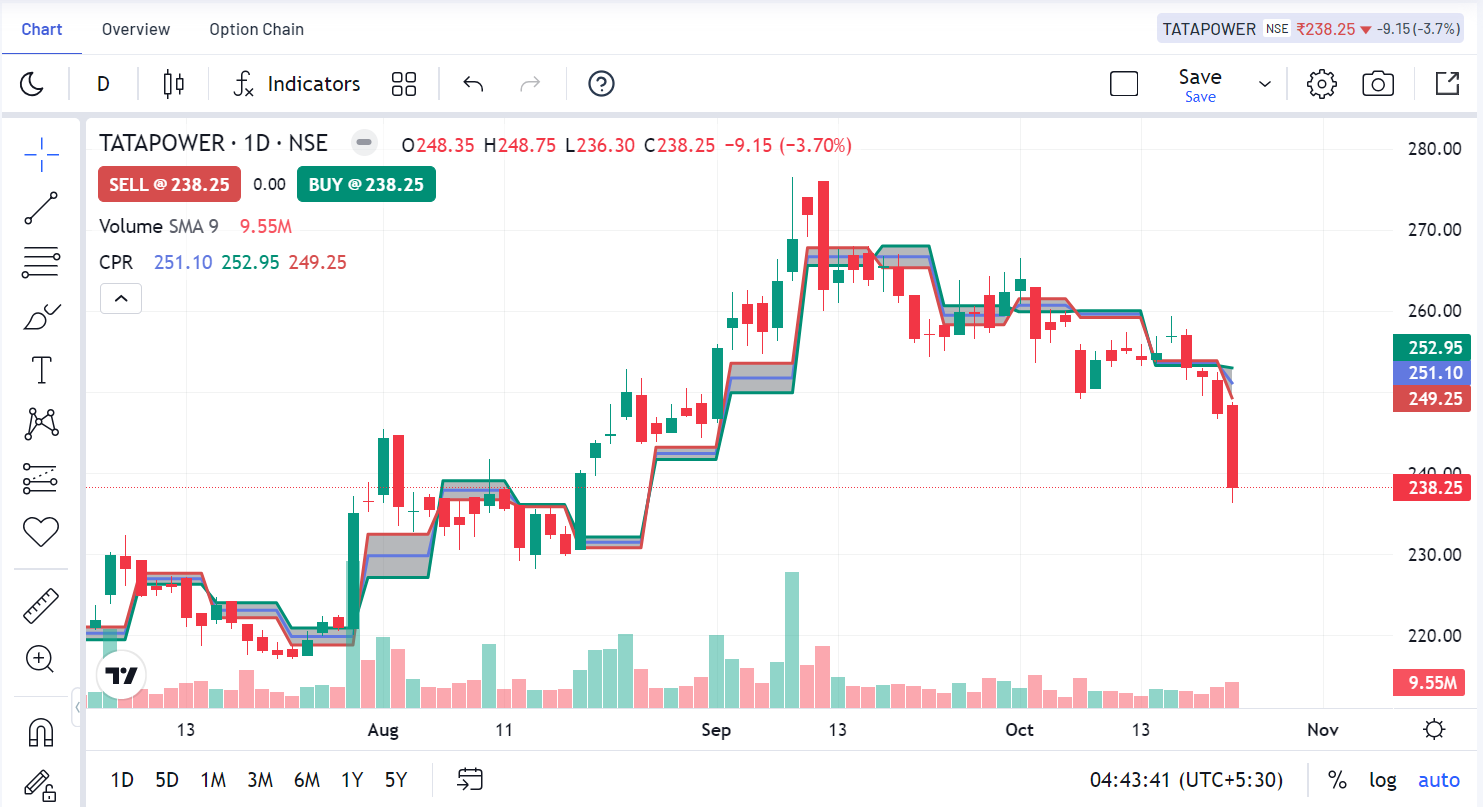
The above figure shows you the three lines that appear when you activate CPR on the chart. As you can notice, the blue line in the middle is CPR, the red line is top CPR and the green line is bottom CPR.
Here, if you are viewing a candlestick chart, then a daily candlestick would produce a weekly CPR, a weekly candle would show monthly CPR and so on.
Note: In the figure, the CPR in the first 10 days of August is clearly much wider than the CPR in the next 10 days. This is because the days preceding August saw much higher volatility than the first few days in August. In other words, if today the market sees volatility, tomorrow’s CPR will be wide and vice versa.
When the price is above the top CPR, that is usually a bullish sign. This is because it shows that traders still want to buy the stock even when the average price is high. You can wait till the price drops down near the top CPR level and then execute the buy order.
Similarly, when the price is below the bottom CPR, it is usually a bearish sign. This is because traders are willing to sell the stock even when the average price is already low. Like before, wait till the price actually slightly rises back to near the bottom CPR and then start selling.
That being said, you can also use CPR as a range-trading tool, i.e. trade when the price is within the bottom and top CPRs. For example, you can buy at bottom CPR and choose target price of top CPR.
As you may have already realised, the concept of CPR is closely related to the concept of support and resistance, which you can revise in this blog.
PVI or Positive Volume Index and NVI or Negative Volume Index are technical indicators that can help signal price changes based on selective volume analysis.
The formula of PVI is the following:
PVI = PPVI + [(TCP-YCP)*PPVI/YCP]
where:
PVI = Positive Volume Index
PPVI = Previous Positive Volume Index
TCP = Today’s Closing Price
YCP = Yesterday’s Closing Price
PVI is calculated only when today’s volume is greater than the volume of the previous trading day. If today’s volume is less than yesterday’s volume, then PVI stays the same as the previous PVI.
The formula for NVI is the following:
NVI = PNVI + [(TCP-YCP)*PNVI/YCP]
where:
NVI = Negative Volume Index
PNVI = Previous Negative Volume Index
TCP = Today’s Closing Price
YCP = Yesterday’s Closing Price
NVI is calculated only when today’s volume is lower than the volume of the previous trading day. If today’s volume is greater than yesterday’s volume, then NVI stays the same as previous NVI.
If the PVI is below its past performance, say 1-year average, then the chances of a bear market is high. On the other hand, if the PVI is above its past average, then the chances of a bear market are low. Crossovers of PVI and NVI from their moving averages may signal reversals in market trends.
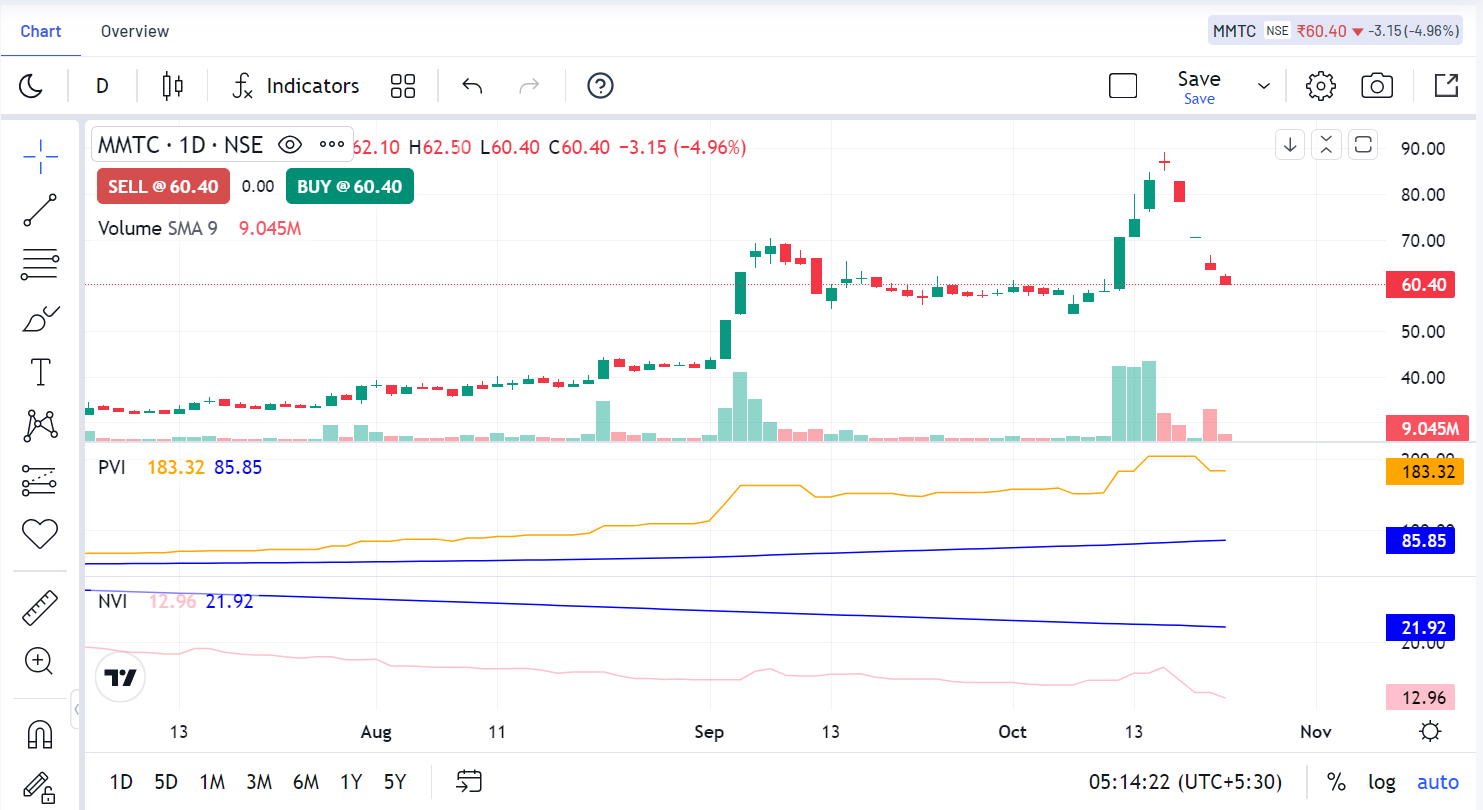
In the figure above, you can see both PVI (the yellow line above) and NVI (the yellow line below) while the blue line is the exponential moving average.
Traders can use both PVI and NVI together to get a sense of market movements. PVI is generally more volatile when the volumes are getting higher. In contrast, NVI is more useful when the volumes are low and trading is largely driven by institutional investors.
CPR, PVI and NVI are highly useful tools that can take your trading game to the next level. Try using them in your Angel One Web app. Leave us your thoughts on the latest features with your iOS and Google Play store reviews.
Enjoy Zero Brokerage on Equity Delivery
Join our 2 Cr+ happy customers

Get the link to download the App

Enjoy Zero Brokerage on
Equity Delivery