Calculate your SIP ReturnsExplore

Last week in the US, the consumer price index (CPI) came in hotter than expected in March, and as a result, the rising inflation number threw cold water on hopes of a slashing of interest rates from the US Federal Reserve in the month of June. Let’s now deep dive into the crux of this blog. Are you familiar with the Big Mac Index? Don’t worry if you haven’t heard about the Big Mac Index; we will explain it briefly. The Big Mac index was formed by The Economist Magazine as an informal way of measuring the purchasing power parity, also known as PPP. According to Investopedia, “PPP is a popular macroeconomic analysis metric used to compare economic productivity and the standard of living between countries.”
The Big Mac is chosen because, in every country, the Big Mac sold at McDonald’s is the same. The price of the Big Mac should reflect the local price of ingredients, wages, and other expenses like advertising. Hence, while the Big Mac sandwich remains uniform across all countries, its price varies. Now let us understand, does this price index also reflect a country’s inflationary pressures? A study by B. Ravikumar and Amy Smaldone compared the US data from the Big Mac Index to the US consumer price index (CPI) for all items, which is the headline price index number that gets reported.
In the graph below, as per the study done by both, they plotted biannually the price of the Big Mac and the CPI, which are normalized to 1000 in January 2012.
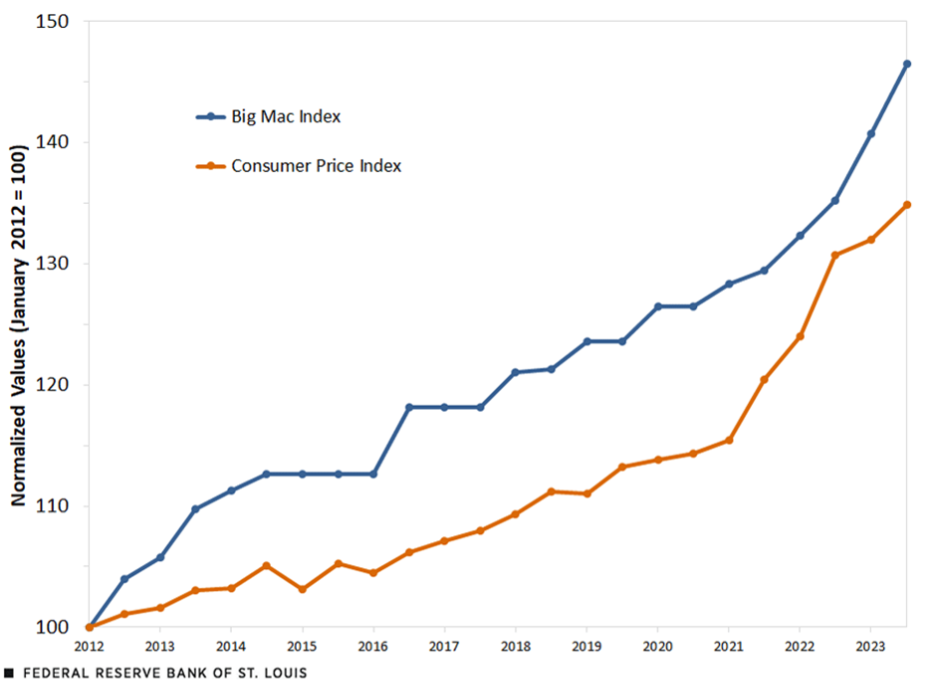
Sources: The Economist, U.S. Bureau of Labor Statistics (via Haver Analytics), and authors’ calculations.
Note: The data pertains to January and July of each year.
Upon examining the graph above, it becomes apparent that since 2012, the indexed price of the Big Mac has consistently exceeded the CPI. However, the two indicators move in sync with each other. However, in 2021, when inflation started to take off, the price of the Big Mac did not increase in tandem or as fast as the CPI.
Interestingly, B. Ravikumar and Amy Smaldone, to understand how the change in the price of the Big Mac and the change in the CPI are related, calculated recent annual inflation rates, which they termed as Big Mac Inflation and CPI Inflation, respectively. In this, the plotting of inflation rates was done biannually since 2018.
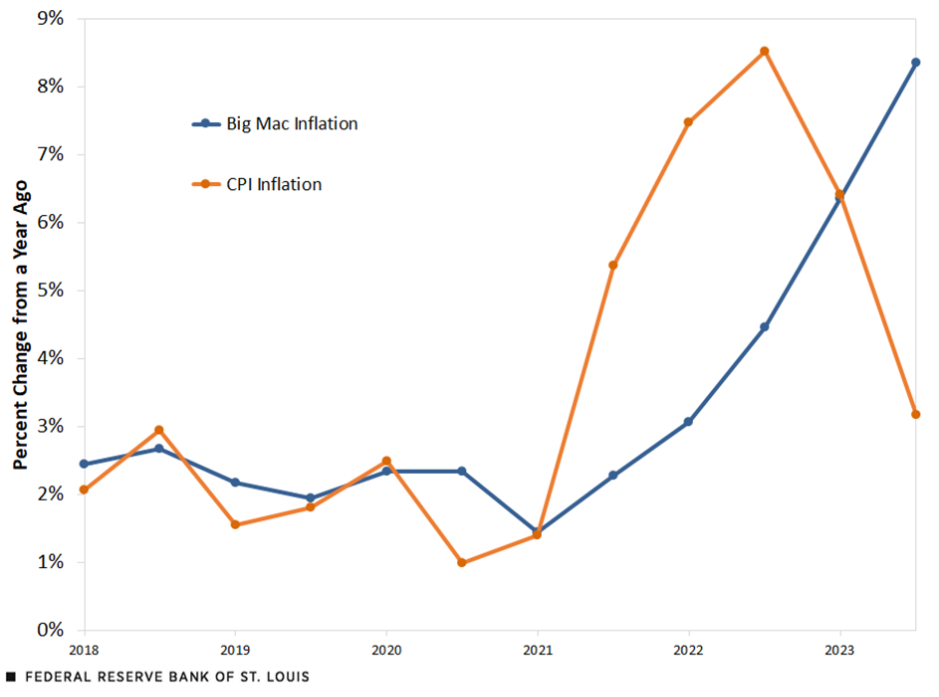
Sources: The Economist, U.S. Bureau of Labor Statistics (via Haver Analytics), and authors’ calculations.
Note: Data are for January and July of each year.
During the period from January 2018 to January 2021, the two inflation rates moved hand in hand, with both being around 2%. However, after January 2021, CPI inflation and Big Mac inflation began to diverge, with CPI inflation surpassing Big Mac inflation until January 2023.
In July 2022, CPI Inflation reached a peak of 8.5%, whereas Big Mac inflation increased at a snail’s pace and had reached only 4.5% when the CPI inflation plateaued. However, post that, Big Mac Inflation is still increasing, while CPI inflation has started to cool off. The main motive of this study is to understand why the Big Mac index is not mirroring the overall changes in CPI?
In their research, the duo found out that in CPI, there are many different components ranging from energy to shelter to clothing. But in the Big Mac, the changes in the price closely follow the changes in prices associated with food away from home. Both the food away from home price index and the Big Mac index had a larger increase than the CPI for all items after July 2022. In CPI, the two most volatile variables are food and energy, and the subcomponent food away from home represents only 5.4% of the overall CPI using 2022 weights. While Big Mac prices generally follow changes in the CPI (Consumer Price Index), sometimes they can go up or down differently compared to other stuff people buy, affecting overall inflation in the US.
Disclaimer: This blog has been written exclusively for educational purposes. The securities mentioned are only examples and not recommendations. It is based on several secondary sources on the internet and is subject to changes. Please consult an expert before making related decisions.
Enjoy Zero Brokerage on Equity Delivery
Join our 2 Cr+ happy customers

Get the link to download the App

Enjoy Zero Brokerage on
Equity Delivery