Calculate your SIP ReturnsExplore

The Purchasing Manager’s Index (PMI) is released for the previous month by IHS Markit on the 01st of next month. On November 01st, the IHS Markit released the PMI numbers for major world economies. So, what is the PMI all about? PMI is basically a barometer of the health of the manufacturing sector. The PMI is based on 5 key indicators as under:
The key, when it comes to PMI, is the magic cut-off number of 50. A PMI of above 50 indicates that the manufacturing sector in the economy is expanding. On the other hand, a PMI of below 50 indicates that the manufacturing sector in the economy is contracting. While temporary blips are perfectly understandable, if the PMI stays below 50 for a sustained number of months, it is a clear sign that the economy is contracting. Here we look at the recently announced PMI of India, China and the US for the month of October 2016.
What the PMI India number reveals…
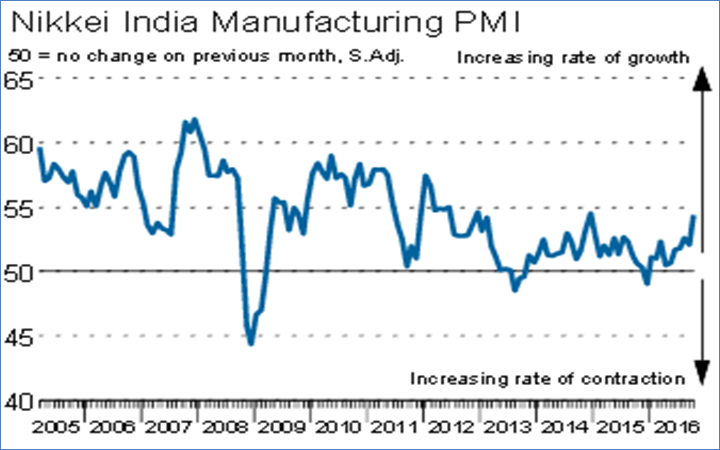
Chart Source: IHS Markit
A cursory look at the above chart reveals that the PMI for India has been consistently above 50 for the last 12 years except for a brief period at the peak of the Lehman crisis. In fact, since 2015, India’s PMI has shown a consistent uptrend.
For the month of October 2016, India’s PMI came in at 54.4, which is the highest level in the last 22 months. It also sharp represents a sharp rise from 52.1 in the month of September. Out of the 5 factors mentioned above, the October PMI was largely driven by New Orders, Production and Inventories. It was the consumer goods segment that actually saw smart growth in terms of production and new orders compared to intermediate and investment goods, pointing to the rise of the consumption story in India. There are two worries in the
India PMI numbers. Firstly, the cost of inputs has been going up sharply, as is evident from the rising WPI inflation in the last 8 months. Secondly, the employment environment has not really improved despite the growth in production and new orders.
What the PMI China number reveals…
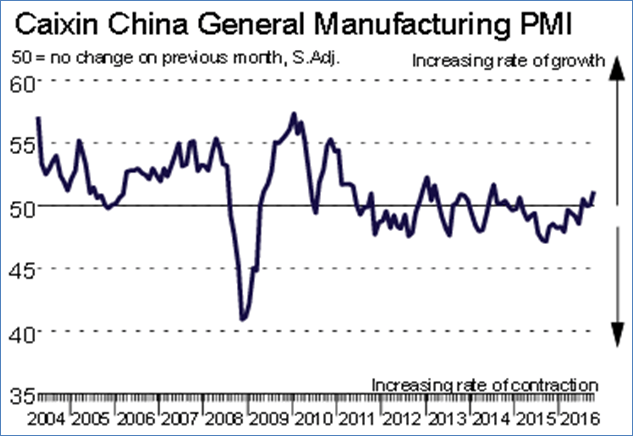
Chart Source: IHS Markit
A quick look at the China PMI chart reveals that Chinese manufacturing has been clearly struggling for the last 5 years as the PMI has struggled around the 50-mark. For the month of October, the PMI was at 51.2, marginally up from 50.1 in the month of September. The difference between the PMI charts of India and China is that while Lehman was a major dampener for both the economies, China has failed to sustain its manufacturing momentum after 2011.
For the month of October, it was New Orders and Production that actually drove the PMI for China slightly higher. It would be early to call a turnaround as China has also been facing a major export contraction. The growth in new orders and production has been driven more by domestic demand rather than by exports, which been the story of China over the last 30 years. Like India, China is also facing higher input costs. China’s employment scenario looks slightly better but that is more because China’s rate of labour reduction went down in the month of October.
What the PMI US number reveals…
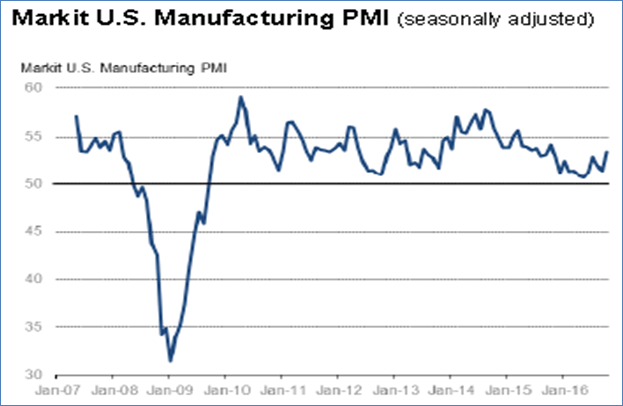
Chart Source: IHS Markit
A quick look at the above chart reveals that despite the shock of 2008, the US PMI has been consistently above the 50-mark since 2010. For the month of October, PMI at 53.4 was sharply up from 51.5 in the month of September.
Interestingly, the US economy saw an improvement in all the 5 parameters. Both Production and New orders were supported by a pick-up in economic activity. On the inventory front, the inventory of raw materials and finished goods picked up sharply in the month of October. Input purchasing activity has been at the fastest clip in the last 16 months. But above all, employment data has shown an improvement for the fortieth month in a row. With order backlogs increasing, one can look forward to further increase in employment in the US.
To encapsulate, all the 3 economies; India, China and the US have shown a marked improvement in manufacturing PMI in the month of October compared to September. The big takeaway for the US is that it has shown growth on all the five factors determining the PMI. As for India, it is consumer demand that has driven this improvement in the Manufacturing PMI. The only concern for the 3 economies is that input costs are rising much faster ever since commodity prices bottomed out in early February this year. That could be the one big challenge in the midst of all this euphoria!
Enjoy Zero Brokerage on Equity Delivery
Join our 2 Cr+ happy customers

Get the link to download the App

Enjoy Zero Brokerage on
Equity Delivery