
The struggle to understand the price trend is real, which is why chartists always search for techniques that will help them understand market moves in advance.
The quest to find technical trading methods isn’t a recent trend. For a long time, efforts were made to devise ways to help traders predict price fluctuations accurately to base their investment decisions. From candlestick charts, Bollinger Bands, and many more, continuous efforts are made to identify when market sentiment is changing. Momentum oscillators are one such set of tools that help traders understand the strength of a price trend. These help measure price change, determine the strength of the price trend, and identify the point of inflexion. Unlike moving average, which is a lag indicator, RSI is a lead indicator. This article will discuss RSI or relative Strength Index, a widely used momentum oscillator for studying buy and sell signals in the price chart.
Relative Strength Index (RSI) is a momentum indicator to measure the magnitude of price change. It is one measuring unit that helps traders understand when a stock is overbought or oversold.
RSI calculates the strength of a stock trend and predicts reversals.
What is momentum oscillator?
RSI is a momentum oscillator indicator. But what is it? Like RSI, the concept of momentum oscillator was first introduced by J. Welles Wilder in his celebrated book, New Concepts in Trading Systems. To understand RSI, one must also understand what and how momentum oscillator works since the two indexes are used together to predict when market sentiment is shifting.
Momentum helps to determine at what speed or frequency (or velocity) price changes in a market. In his book, John J. Murphy explained it as below and also had given its formula.
“Market momentum is measured by continually taking price differences for a fixed time interval. To construct a 10-day momentum line, simply subtract the closing price 10 days ago from the last closing price. This positive or negative value is then plotted around a zero line.” The formula for momentum is:
M=V−Vx
where: V=The latest price
Vx=The closing price x number of days ago
It is a simple formula to understand the strength and weakness of a stock. It is more useful when a market is rising since bullish spells last longer than bearish.

Background of RSI
In the same book, J. Welles Wilder also introduced RSI or relative price index, an indicator on a range of 0 to 100, which indicates if a stock is overvalued. Usually, if a stock price moves above 70 percent RSI, it is considered overbought. Likewise, if a stock price falls below 30 percent, it is deemed to be oversold.
Apart from indicating when a market is bullish or bearish, RSI is also used to gather ideas about general trends.
The formula for calculating RSI
RSI is calculated using the following formula:
RSI = 100 – ( 100 / 1 + RS )
RS = Average gain/Average loss
How to calculate average gain or loss
If we consider this RSI formula is calculated on a period of 14 days, as suggested in Weddle’s book then,
First Average gain = ∑of gains over 14 days’ period/ 14
First average loss = ∑of loss over 14 days’ period/ 14
2nd average, and subsequent average, is calculated as,
- Average Gain = [(previous Average Gain) x 13 + current Gain] / 14
- Average Loss = [(previous Average Loss) x 13 + current Loss] / 14
The practice of taking prior values and current value together is called a smoothening technique which helps RSI become more accurate in technical analysis.
Wilder’s formula was as an improvement on calculating RS, which turned it into an oscillator that swings between ‘0’ and ‘100’ to indicate when the market is more volatile or less. RSI shows zero value when the Average Gain value equals zero. For example, on 14 days period, RSI zero is an indication that price movement has been lower for the period, and there is no gain to measure.
Conversely, RSI is 100 when price movement happened in the higher spectrum for 14 days’ period, and there is no loss.
The default lookback period for RSI is 14. However, traders adjust the value to determine increased or decreased sensitivity.
Remember, a smoothening effect will cause the RSI value to differ slightly. RSI calculated on a period of 250 will have more smoothening effect than RSI calculated on 30 periods.
Let’s discuss RSI with an example,
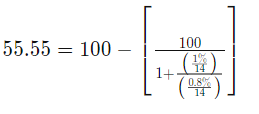
Let’s say there was a gain of 1 percent for seven days on 14 days’ period. And, an average loss of -0.8% for the remaining seven days. RSI is calculated as,
The General Rule Of Thumb To Study RSI Indicator
RSI indicates an overbought condition in the market and helps to cover profit. It also identifies oversold stocks for a potential reversal. RSI divides price charts into several regions between zero and hundred, and traders study the price line between the two extremes. The area between thirty and seventy is the most studied region, indicating oversold and overbought situations, respectively.
It also helps in studying general uptrend and downtrend, respectively above 50 and below 50 lines.
While studying RSI, divergence is what you should be looking for. RSI divergence indicates the point of inflexion, where the price line may change direction.
Wilder categorised divergence as positive and negative divergence. He opined that directional movement doesn’t confirm a price, and so you need to identify deviation for a potential change in trend. Divergence is a condition where the price line and RSI move in the opposite direction.

Positive divergence is a situation where RSI makes higher high and higher lows, but price line registers a lower high and lower low.
Conversely, when RSI registers lower high and lower low against higher high and higher lows of the price line, a negative divergence happens. Chartists look for the point of divergence in a price chart to plan entry and exist in the market.
How to interpret an RSI indicator
– During a bullish market, a stock value may reach the overbought limit of 70 repeatedly for a period. If it happens then, RSI value can be adjusted to 80, showing strong trends.
– RSI is more elaborate than a price line chart. It gives details such as, double tops or double bottoms which a line chart can’t explain. Further, it also throws lights on the support or resistance level of stock.
– In a bullish market where RSI remains between 40 and 90, the zone between 40-50 acts as support. Similarly, in a bear market between 10 and 60 range, the region between 50 and 60 acts as resistance.
– Divergence occurs when a price line shows a new high or low that isn’t confirmed by RSI indicator. It is a critical indicator which shows a price reversal trend.
– Top Swing and bottom swing failures are also part of divergence. When RSI marks a lower high which is then followed by a downside move below a previous low, a Top Swing Failure is said to have taken place. Similarly, when RSI makes a higher low, which is then followed by an upward move above a previous high, a Bottom Swing Failure occurs.

Limitation of RSI
Like for any other indicators, results of RSI indicator is most reliable when it conforms to long term trends. Actual reversal signs are rare and need to be filtered from false signals. An RSI value can show false positive when a stock price shows an overbought signal followed by a sharp decline. Similarly, a false negative is triggered when a bearish crossover is followed by sudden acceleration in stock price.
Secondly, RSI indicator can stay in overbought or oversold range for a long time while the stock in question shows the opposite movement. So, it is more useful in a scenario where price keeps alternating between bullish and bearish ranges.
Conclusion
RSI is a potential oscillator indicator that gives traders visual representation when the price trend is shifting. If we remain aware of its limitations, it is a powerful price action tool to understand trend reversal in advance.


