1
For Private Circulation Only
Technical and Derivatives Review
| October 31, 2020
Volatility rises ahead of the global event, still key levels defended
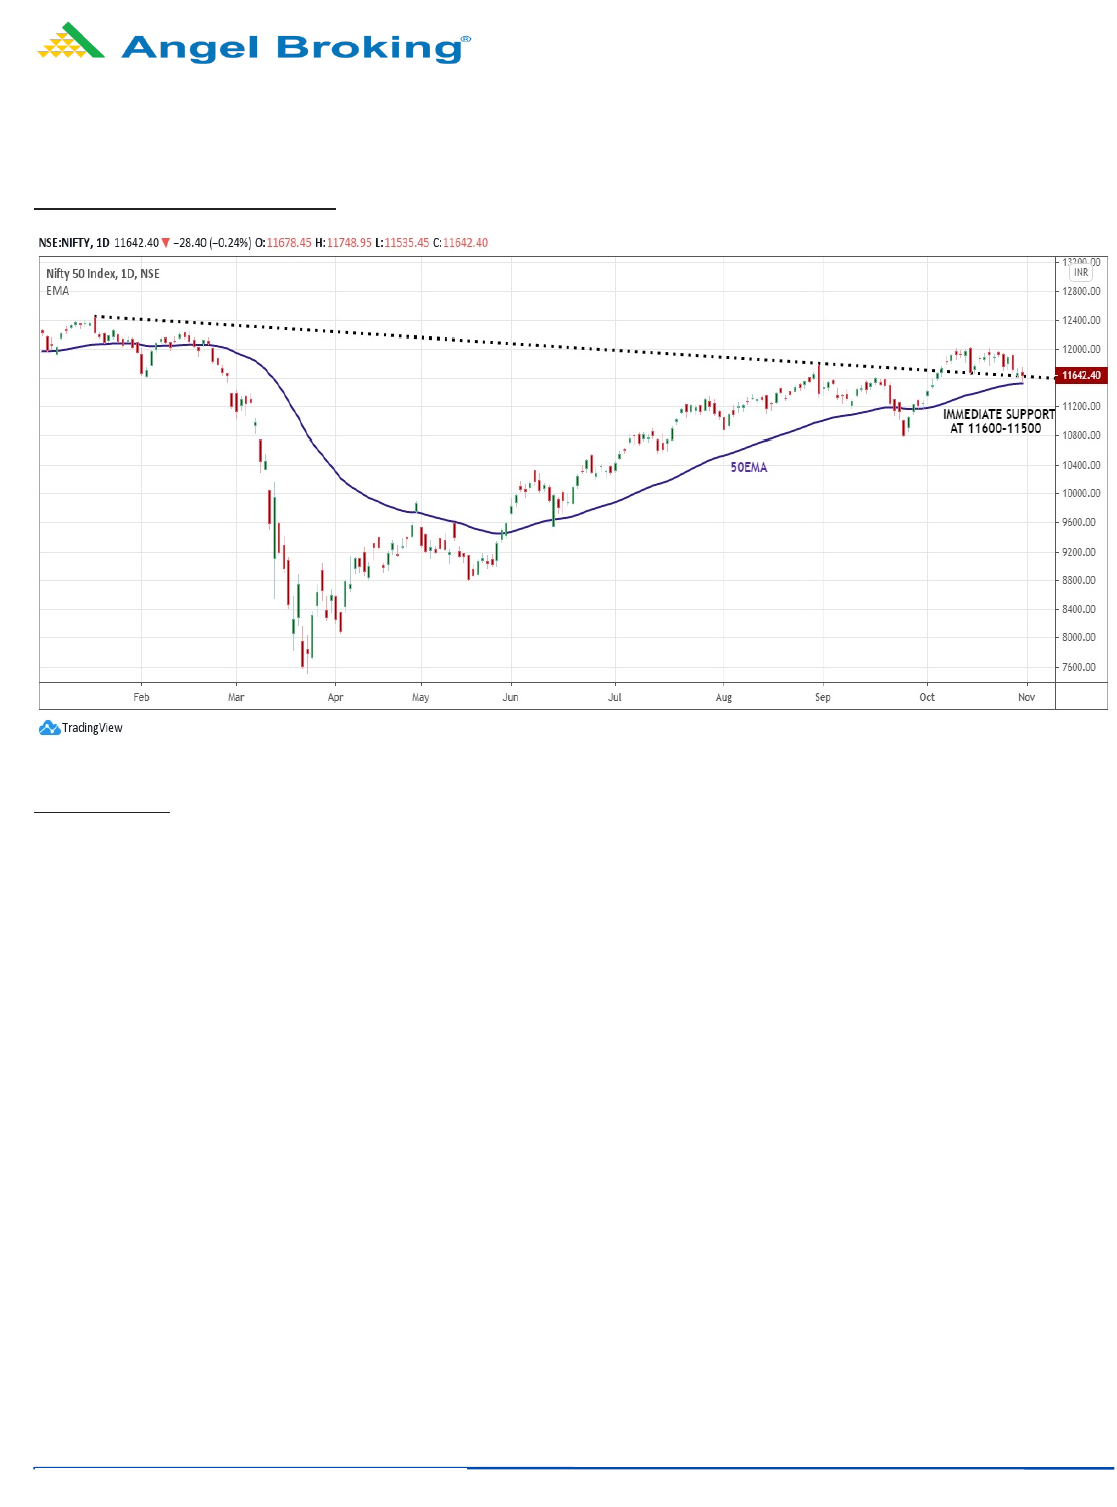
Sensex (39614) / Nifty (11642)
Source: Trading View
Future outlook
This week, the global markets went through a severe pain as participants started to sense Donald Trump’s defeat in the upcoming
US Presidential election. To rub salt on the wound, major European countries imposed lockdown due to the rising coronavirus cases.
This resulted into a massive sell off in developed markets, which had a rub off effect on our market as well. Right from the word go,
we looked nervous; but fortunately the reaction was not as brutal as it is in the global peers. In fact, a reasonable recovery in the
second half on Friday lifted markets higher in the safer territory above the 11600 mark.
As we all know, the volatility increases ahead of any major event and due to any uncertainty and since, rising volatility mostly makes
the market a bit nervous, we tend to see some correction. Fortunately, in our market the damage was no way closer to the major
global markets. In the midst of all volatile and uncertain behavior, we managed to defend key levels on a closing basis. We have
been consistently mentioning the key support zone around 11660 – 11600 and on Friday, the same got breached due to volatility on
an intraday basis. But as a technician, we give more weightage to a closing point; we can get a bit relaxed as the support remains
very much intact. In the forthcoming week, 11600 – 11500 has now become an important support zone; whereas on the higher side,
if we have to regain any strength, the Nifty has to reclaim 11760 – 11800 levels convincingly. Above this, we may again see the
market resuming its northward trajectory. But as we are stepping into an eventful week, all eyes would be on all these
developments, which may probably dictate the near term direction. As of now, since important levels are still intact, we still remain
hopeful.
There were few individual pockets witnessed decent profit taking but among all, banking still shows some strength and held onto its
key levels. So, any recovery from here on in benchmark, the financial space plays a vital role in it. Apart from this, the midcap index
continues to show some resilience and we witnessed some interesting moves towards the end when key indices were feeling a heat.
With continuation to the previous week’s view, another couple of percent move in the Midcap index would lead to a strong
breakout in this universe. Let see how things pan out in the forthcoming week and hence, traders should stay light and keep a close
tab on these developments.
2
For Private Circulation Only
Technical and Derivatives Review
| October 31, 2020
Volatility likely to remain high in coming week
Nifty spot closed at 11642.40 this week, against a close of 11930.35 last week. The Put-Call Ratio has decreased from 1.47 to 1.46.
The annualized Cost of Carry is negative at 0.46%. The Open Interest of Nifty Futures has decreased by 12.66%.
Derivatives View
Nifty current month future closed with a discount of 4.00 points against a premium of 28.30 points to its spot. Next month future is
trading at a premium of 12.65 points.
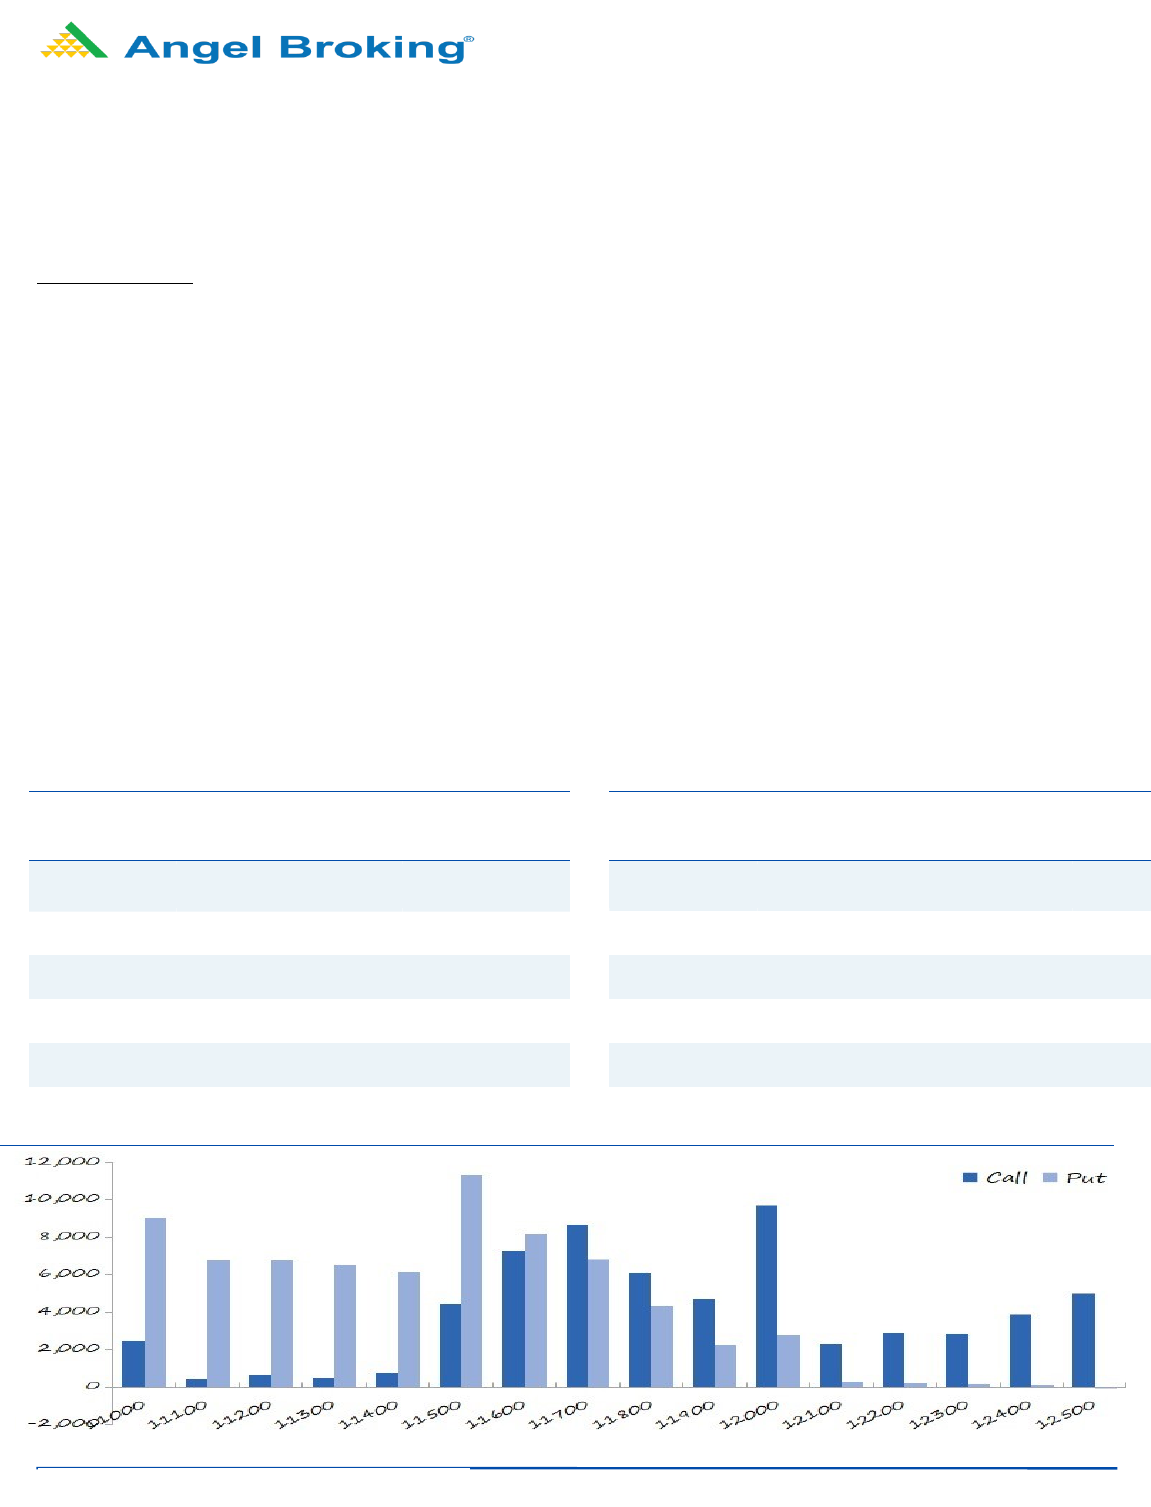
As far as Nifty options activities are concerned, 11700-12000 call options added fresh positions; and open interest addition was also
seen in 11500 put option. Maximum open interest for the weekly series is placed at 12000 call and 11600 put options.
Nifty started the week above the 11900 mark; but the volatility in global markets increased due to rising Covid19 cases in Europe
and uncertainty over U.S. elections outcome. This led to some profit booking in our markets too. Nifty managed to defend the 11500
support on the concluding day and ended above 11600 with a cut of about two and a half percent over previous week’s close. The
rollover figures indicate long positions rolled to November series; but the ‘Long Short Ratio’ of FII’s is at 40 percent which is not an
encouraging sign. Also, the India VIX has started to rise ahead of the U.S. elections indicating that volatility would remain high in the
near term. The options data hint at trading range of 11500-12000 for the coming week. A breach beyond the above mentioned
range could then lead to a directional move. Considering higher volatility, traders are advised to avoid aggressive positions and trade
with a stock specific approach.
Weekly change in OI
Short Formation
Scrip
OI
Futures
OI
Chg (%)
Price
Price
Chg(%)
HEROMOTOCO 3075300 15.18 2809.00 (9.73)
TORNTPHARM
1095500
13.70
2566.50
(6.26)
ICICIBANK
120451375
6.45
393.85
(5.52)
SUNPHARMA
43775200
5.53
466.45
(3.91)
FEDERALBNK
87558500
4.71
50.70
(9.55)
Long Formation
Scrip
OI
Futures
OI
Chg (%)
Price
Price
Chg(%)
KOTAKBANK 14178400 20.23 1541.45 11.11
ASIANPAINT
3048900
11.82
2212.40
4.62
-
-
-
-
-
-
-
-
-
-
-
-
-
-
-

3
For Private Circulation Only
Technical and Derivatives Review
| October 31, 2020
Research Team Tel: 022 - 39357600 (Extn – 6844) Website: www.angelbroking.com
For Technical Queries E-mail: technicalresearch-cso@angelbroking.com
For Derivative Queries E-mail: [email protected]
DISCLAIMER
Angel Broking Limited (hereinafter referred to as “Angel”) is a registered Member of National Stock Exchange of India Limited, Bombay
Stock Exchange Limited and Metropolitan Stock Exchange Limited. It is also registered as a Depository Participant with CDSL and
Portfolio Manager and Investment Adviser with SEBI. It also has registration with AMFI as a Mutual Fund Distributor. Angel Broking
Limited is a registered entity with SEBI for Research Analyst in terms of SEBI (Research Analyst) Regulations, 2014 vide registration
number INH000000164. Angel or its associates has not been debarred/ suspended by SEBI or any other regulatory authority for
accessing /dealing in securities Market. Angel or its associates/analyst has not received any compensation / managed or co-managed
public offering of securities of the company covered by Analyst during the past twelve months.
This document is solely for the personal information of the recipient, and must not be singularly used as the basis of any investment
decision. Nothing in this document should be construed as investment or financial advice. Each recipient of this document should make
such investigations as they deem necessary to arrive at an independent evaluation of an investment in the securities of the companies
referred to in this document (including the merits and risks involved), and should consult their own advisors to determine the merits
and risks of such an investment.
Reports based on technical and derivative analysis center on studying charts of a stock's price movement, outstanding positions and
trading volume, as opposed to focusing on a company's fundamentals and, as such, may not match with a report on a company's
fundamentals. Investors are advised to refer the Fundamental and Technical Research Reports available on our website to evaluate the
contrary view, if any.
The information in this document has been printed on the basis of publicly available information, internal data and other reliable
sources believed to be true, but we do not represent that it is accurate or complete and it should not be relied on as such, as this
document is for general guidance only. Angel Broking Limited or any of its affiliates/ group companies shall not be in any way
responsible for any loss or damage that may arise to any person from any inadvertent error in the information contained in this report.
Angel Broking Limited has not independently verified all the information contained within this document. Accordingly, we cannot
testify, nor make any representation or warranty, express or implied, to the accuracy, contents or data contained within this document.
While Angel Broking Limited endeavors to update on a reasonable basis the information discussed in this material, there may be
regulatory, compliance, or other reasons that prevent us from doing so.
This document is being supplied to you solely for your information, and its contents, information or data may not be reproduced,
redistributed or passed on, directly or indirectly.
Neither Angel Broking Limited, nor its directors, employees or affiliates shall be liable for any loss or damage that may arise from or in
connection with the use of this information.
Technical and Derivatives
Team:
Sameet Chavan Chief Analyst – Technical & Derivatives sameet.chavan@angelbroking.com
Ruchit Jain Senior Analyst - Technical & Derivatives ruchit.jain@angelbroking.com
Rajesh Bhosale Technical Analyst rajesh.bhosle@angelbroking.com
Sneha Seth Derivatives Analyst sneha.seth@angelbroking.com
