1
For Private Circulation Only
T
echnical and Derivatives Review
| September 25, 2020
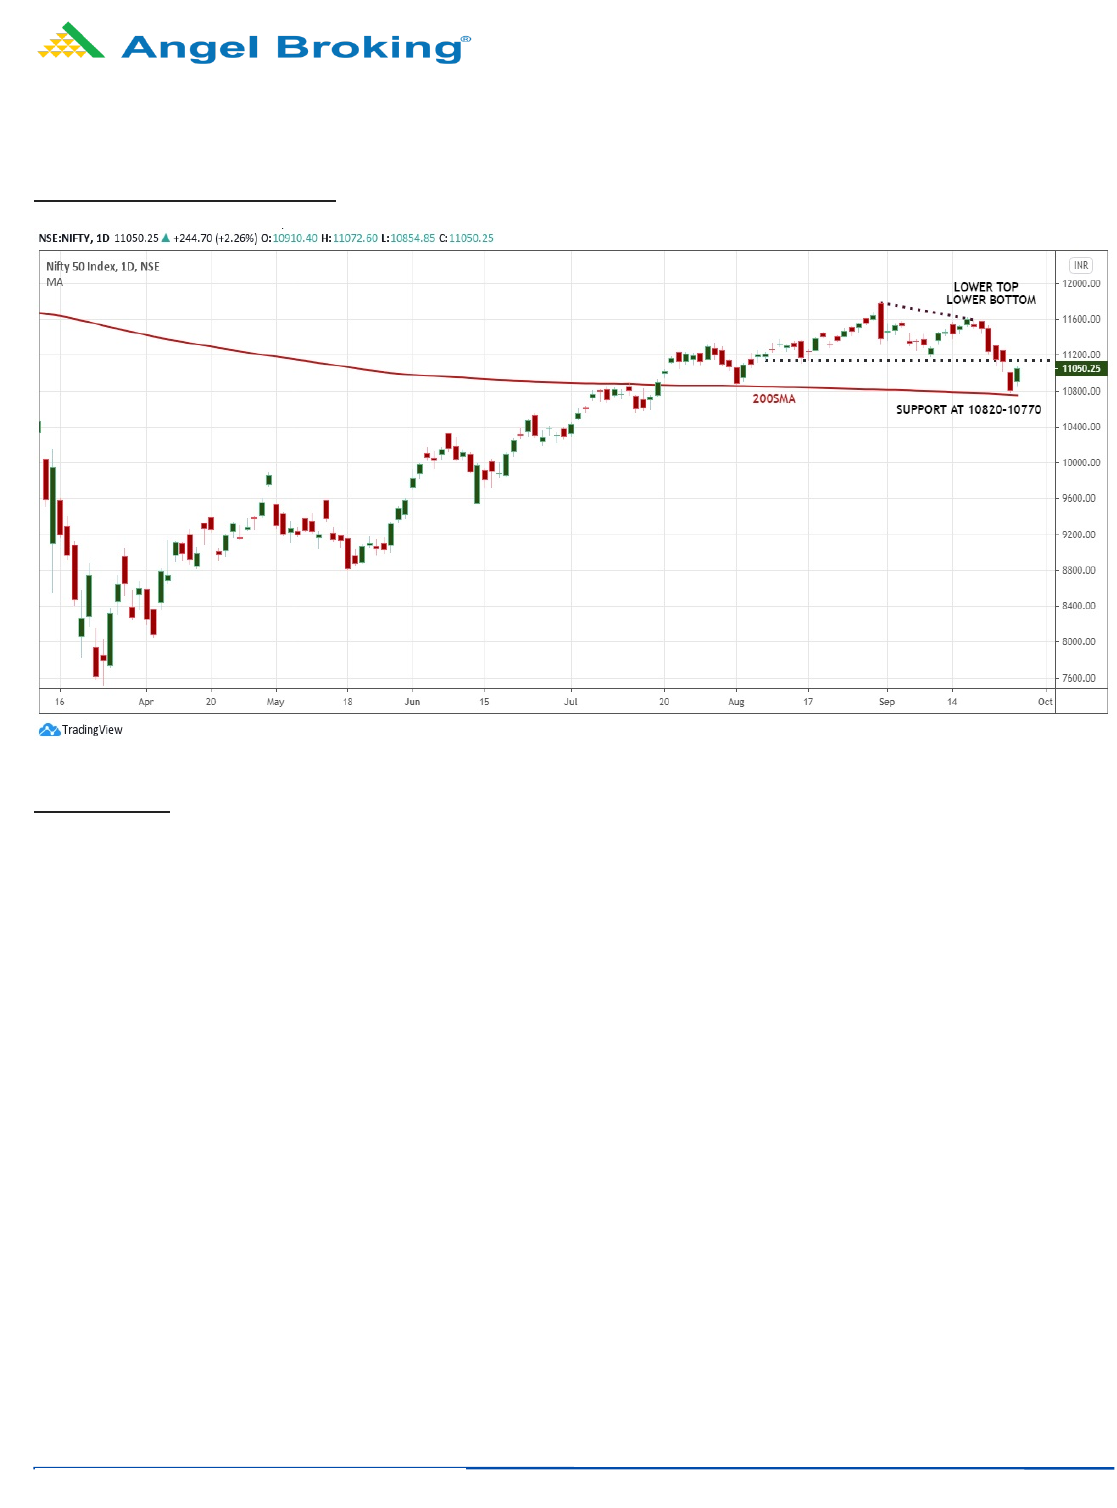
Some respite at 200-SMA, but still not out of the woods yet
Sensex (37389) / Nifty (11050)
Source: Trading View
Future outlook
We started the week on a flat note as there was no major development over the weekend on the domestic as well as global front.
But all of a sudden, the global markets started feeling the heat and had a rough afternoon on Monday. Undoubtedly, this negativity
had a rub off effect on our market and as a result, the Nifty took a nosedive in the latter half to shed more than 200 points. This
development set the tone for the remaining part of the week and market extended losses in the following sessions to conclude one
of the worst monthly expiries in the last six months. On Friday, fortunately we had a smart recovery to defend the 11000 mark on a
weekly basis.
Barring the last day of the week, our markets kept grinding lower and didn’t respect any intermediate support in the process. The
velocity at which the market came off this week, it might have caught a lot of traders on the wrong foot. But honestly speaking, we
were not surprised with it and with reference to our recent articles; we have been repeatedly advocating caution in the recent rally.
The way prices looked overstretched, reaching a cluster of multiple Fibonacci ratios/ key indicators and importantly the positioning
of US Dollar index recently, we avoided participating in the last phase of the recent euphoria. And yes, when the euphoria reaches
complacency, the market eventually tends to show its supremacy. We had a couple of hints in the previous three weeks but who
ignored it, had to pay the price. Without boasting further, the cautious stance initially and then a ‘Sell on rise’ has played out well so
far.
This is past now but the important question is what’s next and is there further room for the market to correct? In our sense, the
market is not done yet and although we have seen a smart broad based recovery on Friday, we expect the selling to re-emerge at
higher levels around 11150 - 11250. On the daily chart, we can see a confirmation of ‘Lower Top Lower Bottom’ for the first time
since May lows. Hence, the probability of Nifty sliding below 10820 – 10770 is quite high to test the next cluster of supports around
10600 – 10450. However, with a broader view, we still believe that this is just a corrective phase within the large uptrend and thus, it
is likely to provide a very good opportunity to accumulate quality propositions in a staggered manner. But for momentum traders,
it’s advisable not to get carried away by in between bounce backs as we are still not completely out of the woods.
2
For Private Circulation Only
T
echnical and Derivatives Review
| September 25, 2020
Nifty starting October series with lower base
Nifty spot closed at 11050.25 this week, against a close of 11504.95 last week. The Put-Call Ratio has decreased from 1.37 to 1.31.
The annualized Cost of Carry is negative at 0.76%. The Open Interest of Nifty Futures has decreased by 28.86%.
Derivatives View
Nifty current month future closed with a discount of 8.05 points against a premium of 10.30 points to its spot. Next month future is
trading at a premium of 12.65 points.
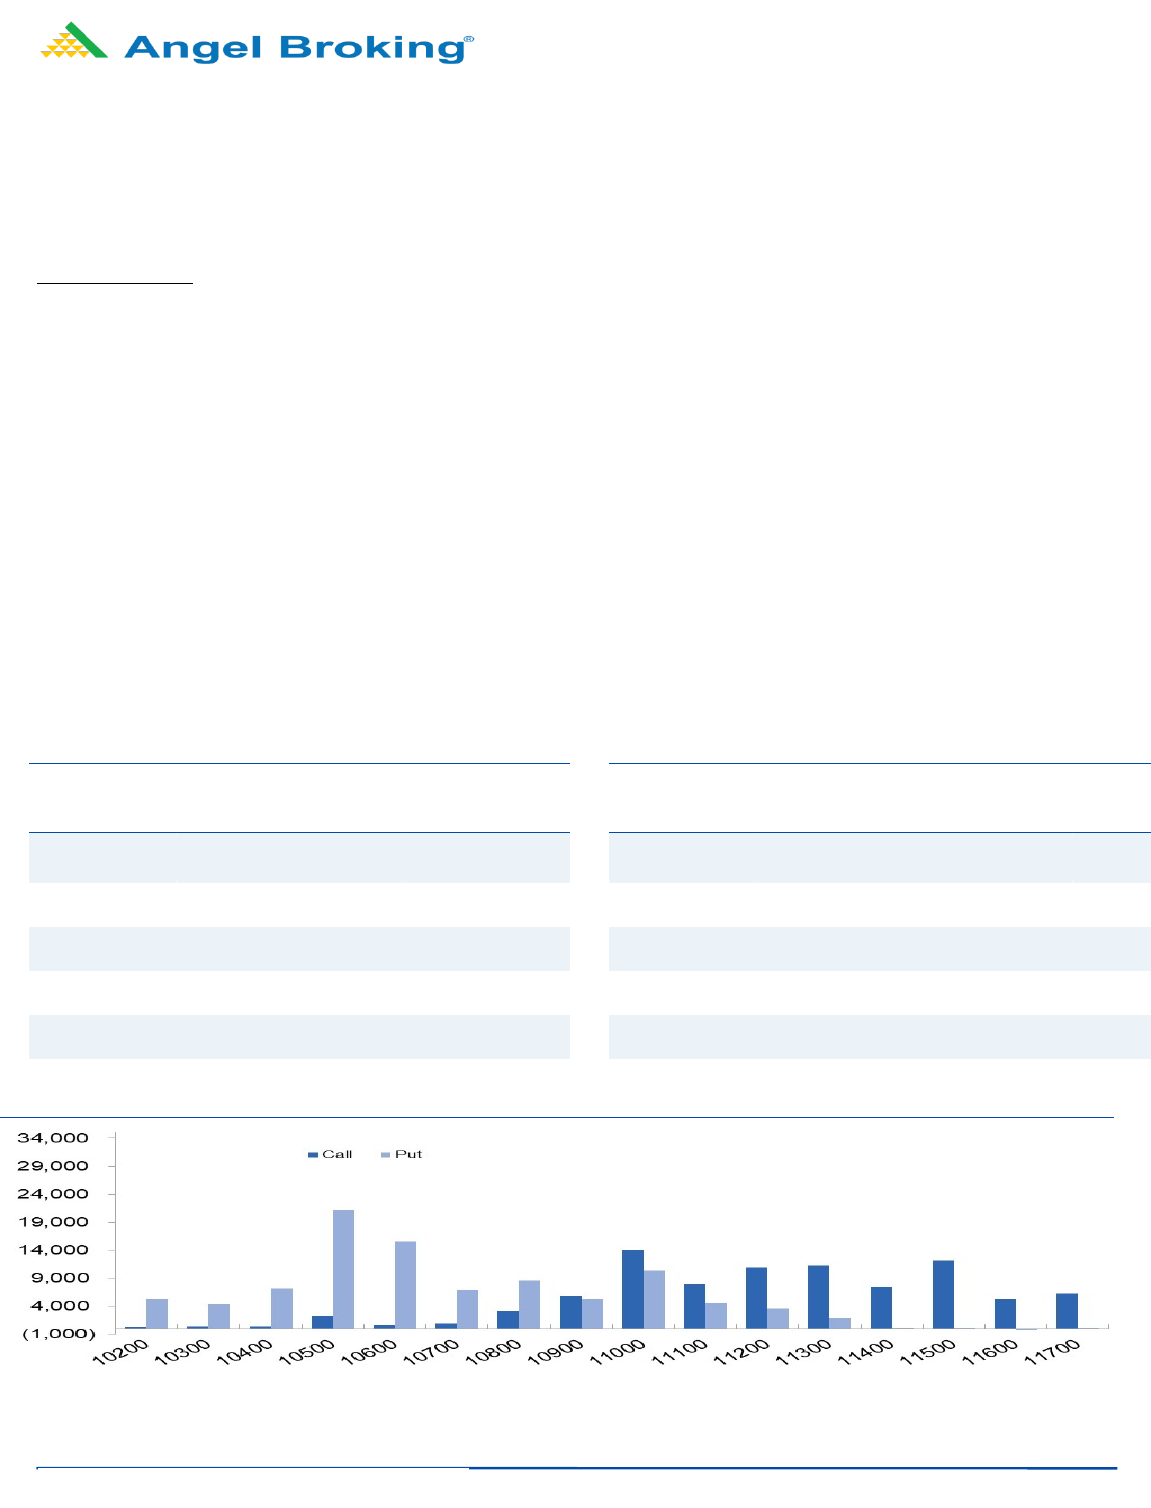
As far as Nifty options activities are concerned, the build-up was scattered between 11000-11500 call. On the flip side, fresh
positions were formed in 10000, 10500, 10600 and 11000 put options Maximum open interest is now placed at 11500 call and
10500 put option.
Last week, we saw massive sell-off to correct from 11500 to 10800. However, sharp recovery was seen on Friday’s led weekly closing
tad above 11000 mark. Now, in the recent correction we saw long unwinding in Nifty and short formation for banking index. Rollover
in Nifty was below average and now we are starting new series with lower base. However, good amount of shorts have been rolled-
over in BankNifty. Despite smart recovery on Friday, we haven’t seen any relevant long formation in Nifty. As the above data
remains unclear at present and one should wait for follow-up move with addition meaningful position before initiating any
directional trade. Going ahead, 11200-11300 may act as an immediate hurdle; whereas, around 10800 is the demand zone.
Weekly change in OI
Short Formation
Scrip
OI
Futures
OI
Chg (%)
Price
Price
Chg(%)
ZEEL 35562000 16.97 198.45 (10.47)
JINDALSTEL
24595000
10.96
176.35
(11.49)
POWERGRID
15288000
8.73
161.60
(6.35)
MARUTI
2286000
8.43
6516.35
(6.99)
ITC
131353600
8.36
171.20
(5.02)
Long Formation
Scrip
OI
Futures
OI
Chg (%)
Price
Price
Chg(%)
APOLLOHOSP 1465500 16.63 1986.00 8.49
BERGEPAINT
3489200
14.02
583.75
0.34
COFORGE
642750
9.94
2312.85
4.84
HCLTECH
14578200
1.22
830.20
1.98

3
For Private Circulation Only
T
echnical and Derivatives Review
| September 25, 2020
Research Team Tel: 022 - 39357600 (Extn – 6844) Website: www.angelbroking.com
DISCLAIMER
Angel Broking Limited (hereinafter referred to as “Angel”) is a registered Member of National Stock Exchange of India Limited, Bombay
Stock Exchange Limited and Metropolitan Stock Exchange Limited. It is also registered as a Depository Participant with CDSL and
Portfolio Manager and Investment Adviser with SEBI. It also has registration with AMFI as a Mutual Fund Distributor. Angel Broking
Limited is a registered entity with SEBI for Research Analyst in terms of SEBI (Research Analyst) Regulations, 2014 vide registration
number INH000000164. Angel or its associates has not been debarred/ suspended by SEBI or any other regulatory authority for
accessing /dealing in securities Market. Angel or its associates/analyst has not received any compensation / managed or co-managed
public offering of securities of the company covered by Analyst during the past twelve months.
This document is solely for the personal information of the recipient, and must not be singularly used as the basis of any investment
decision. Nothing in this document should be construed as investment or financial advice. Each recipient of this document should make
such investigations as they deem necessary to arrive at an independent evaluation of an investment in the securities of the companies
referred to in this document (including the merits and risks involved), and should consult their own advisors to determine the merits
and risks of such an investment.
Reports based on technical and derivative analysis center on studying charts of a stock's price movement, outstanding positions and
trading volume, as opposed to focusing on a company's fundamentals and, as such, may not match with a report on a company's
fundamentals. Investors are advised to refer the Fundamental and Technical Research Reports available on our website to evaluate the
contrary view, if any.
The information in this document has been printed on the basis of publicly available information, internal data and other reliable
sources believed to be true, but we do not represent that it is accurate or complete and it should not be relied on as such, as this
document is for general guidance only. Angel Broking Limited or any of its affiliates/ group companies shall not be in any way
responsible for any loss or damage that may arise to any person from any inadvertent error in the information contained in this report.
Angel Broking Limited has not independently verified all the information contained within this document. Accordingly, we cannot
testify, nor make any representation or warranty, express or implied, to the accuracy, contents or data contained within this document.
While Angel Broking Limited endeavors to update on a reasonable basis the information discussed in this material, there may be
regulatory, compliance, or other reasons that prevent us from doing so.
This document is being supplied to you solely for your information, and its contents, information or data may not be reproduced,
redistributed or passed on, directly or indirectly.
Neither Angel Broking Limited, nor its directors, employees or affiliates shall be liable for any loss or damage that may arise from or in
connection with the use of this information.
Technical and Derivatives Team:
Sameet Chavan Chief Analyst – Technical & Derivatives sameet.chavan@angelbroking.com
Rajesh Bhosale Technical Analyst rajesh.bhosle@angelbroking.com
Sneha Seth Derivatives Analyst sneha.seth@angelbroking.com
