
1
For Private Circulation Only
Technical and Derivatives Review
|July 18, 2020
11000 merely a formality, stay upbeat and keep booking timely profits
Sensex (37020) / Nifty (10902)
Source: Trading View
Future outlook
It was indeed an action packed week for our markets, rather, we should say for global markets. Trading started on Monday with a
decent upside gap owing to favorable global cues. However, this turned out to be a formality as index gave up a major portion of its
morning gains. This was followed by a bout of profit booking to mark one of the weakest sessions in the recent past. But the real
action started from there on. On the following day, we witnessed a massive bump up at the opening; courtesy to smart rallies in
global peers after the recent development on the vaccine. Everything looked hunky dory but post Reliance AGM; the stock took a
nosedive and so as our markets. We were back to 10600 but again the market had completely different plans as we witnessed a
smart recovery first and then a consistent rally to conclude the week at new 4-months high.
Our markets saw a roller-coaster move throughout this week; in fact during the day also swings were wild, barring Friday’s session
where we witnessed a unidirectional move (northwards). Now let’s see what charts have to say for the forthcoming sessions. We
had anticipated a possible breakout from the sturdy wall of 10850 during this week. Honestly we expected it in the initial part of the
week but we went through a correction first and hence, the conviction became stronger during the midst of the week about Nifty
surpassing hurdle soon. Finally with Friday’s late surge in banking conglomerates, Nifty has confirmed a breakout above 10850,
which resembles a ‘Bullish Flag’ pattern on daily chart. Now, the banking seems to have regained strength which we believe should
lead the move in the forthcoming week. As far as levels are concerned, the up move should ideally get extended towards the 78.6%
retracement zone at 11100 – 11200.
In the previous weekly commentary, we had mentioned these levels and anticipated a possible correction after reaching these levels
first. But since we have already seen a small decline early this week, we will have to reassess the situation whether the markets have
further steam left to go beyond it or not. So from here on, one step at a time is the strategy to follow and better to timely book
profits as well in the rally. Traders are advised to keep following stock specific moves and the base now remains at 10660 – 10560.
2
For Private Circulation Only
Technical and Derivatives Review
|July 18, 2020
Options data hints 11200 levels for coming week
Nifty spot closed at 10901.70 this week, against a close of 10768.05 last week. The Put-Call Ratio has increased from 1.47 to 1.75.
The annualized Cost of Carry is positive at 0.24%. The Open Interest of Nifty Futures has decreased by 7.07%.
Derivatives View
Nifty current month future closed with a premium of 3.35 points against a discount of 1.40 points points to its spot. Next month
future is trading at a premium of 13.50 points.
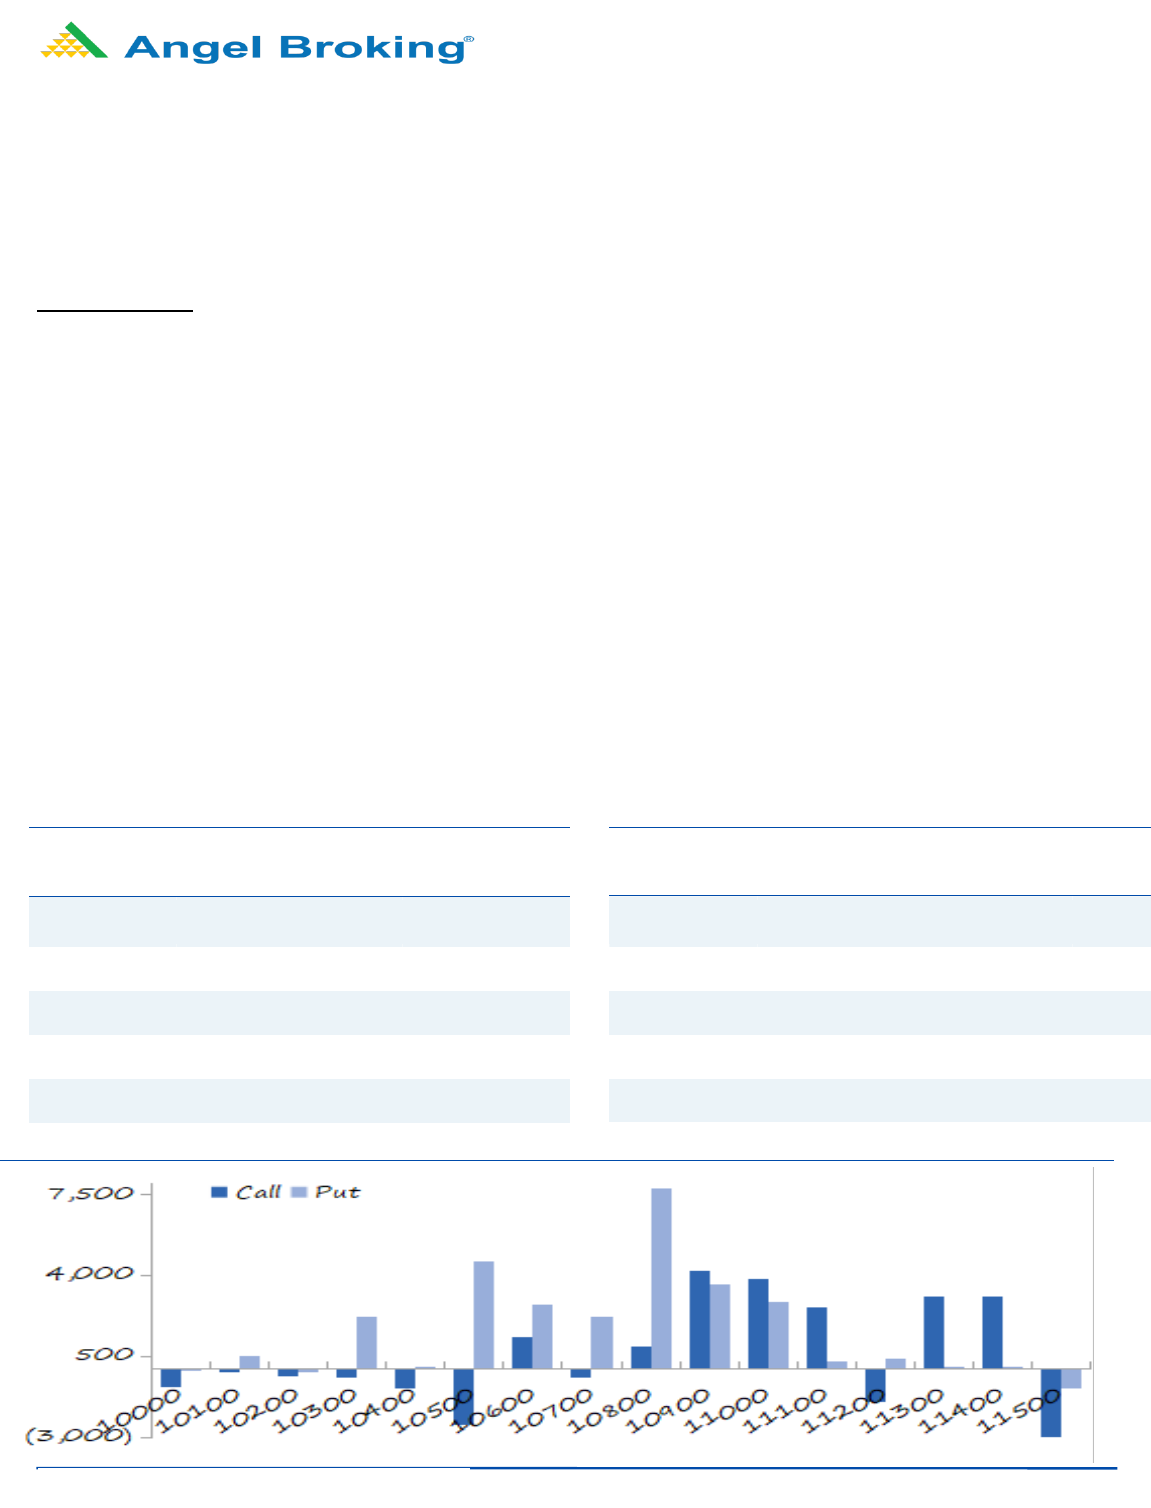
As far as Nifty options activities for the week are concerned, we witnessed some open interest addition in 10900-11100 calls and in
10800-10500 put options. Maximum open interest for the weekly series is at 11200 call option and 10700 put option.
Nifty started the week on a positive note around 10850,however, it corrected from there upto 10600-10550 in just couple of
sessions. The index then oscillated within a range during mid-week and it rallied sharply on Friday to conclude the week above
10900 mark. During this week, both Nifty as well as BankNifty witnessed unwinding of some positions as the open interest reduced
by about 7% in both the indices. FII’s formed some short positions index futures at the start of the week, but they covered their
shorts and formed some longs in last couple of sessions; their ‘Long Short Ratio’ now stands above 53 percent. In the weekly options
segment, good open interest addition was seen in 11200 call option on Friday; rise in open interest along with price upmove
indicates long formation in this strike. On the flipside, 10800 and 10700 put options witnessed fresh addition indicating put writing
as the index rallied higher. The above data indicates higher probability of further upmove towards 11200 in the coming week, while
10800-10700 would be seen as support. Hence, traders are advised to trade with a positive bias.
Weekly change in OI
Short Formation
Scrip
OI
Futures
OI
Chg (%)
Price
Price
Chg(%)
BHEL 63609000 29.89 38.50 (7.56)
ZEEL
23364000
15.82
158.00
(7.17)
IBULHSGFIN
12424800
15.11
222.30
(5.81)
INFRATEL
14210000
13.05
198.95
(5.15)
RBLBANK
23
049000
10.59
169.75
(6.24)
Long Formation
Scrip
OI
Futures
OI
Chg (%)
Price
Price
Chg(%)
CADILAHC 9741600 38.16 378.70 5.77
CONCOR
7171044
32.83
450.55
4.51
RAMCOCEM
1278400
17.78
661.65
2.73
WIPRO
30857600
12.22
261.80
17.40
VOLTAS
369800
0
10.19
578.70
2.45

3
For Private Circulation Only
Technical and Derivatives Review
|July 18, 2020
Research Team Tel: 022 - 39357600 (Extn – 6844) Website: www.angelbroking.com
DISCLAIMER
Angel Broking Limited (hereinafter referred to as “Angel”) is a registered Member of National Stock Exchange of India Limited, Bombay
Stock Exchange Limited and Metropolitan Stock Exchange Limited. It is also registered as a Depository Participant with CDSL and
Portfolio Manager and Investment Adviser with SEBI. It also has registration with AMFI as a Mutual Fund Distributor. Angel Broking
Limited is a registered entity with SEBI for Research Analyst in terms of SEBI (Research Analyst) Regulations, 2014 vide registration
number INH000000164. Angel or its associates has not been debarred/ suspended by SEBI or any other regulatory authority for
accessing /dealing in securities Market. Angel or its associates/analyst has not received any compensation / managed or co-managed
public offering of securities of the company covered by Analyst during the past twelve months.
This document is solely for the personal information of the recipient, and must not be singularly used as the basis of any investment
decision. Nothing in this document should be construed as investment or financial advice. Each recipient of this document should make
such investigations as they deem necessary to arrive at an independent evaluation of an investment in the securities of the companies
referred to in this document (including the merits and risks involved), and should consult their own advisors to determine the merits
and risks of such an investment.
Reports based on technical and derivative analysis center on studying charts of a stock's price movement, outstanding positions and
trading volume, as opposed to focusing on a company's fundamentals and, as such, may not match with a report on a company's
fundamentals. Investors are advised to refer the Fundamental and Technical Research Reports available on our website to evaluate the
contrary view, if any.
The information in this document has been printed on the basis of publicly available information, internal data and other reliable
sources believed to be true, but we do not represent that it is accurate or complete and it should not be relied on as such, as this
document is for general guidance only. Angel Broking Limited or any of its affiliates/ group companies shall not be in any way
responsible for any loss or damage that may arise to any person from any inadvertent error in the information contained in this report.
Angel Broking Limited has not independently verified all the information contained within this document. Accordingly, we cannot
testify, nor make any representation or warranty, express or implied, to the accuracy, contents or data contained within this document.
While Angel Broking Limited endeavors to update on a reasonable basis the information discussed in this material, there may be
regulatory, compliance, or other reasons that prevent us from doing so.
This document is being supplied to you solely for your information, and its contents, information or data may not be reproduced,
redistributed or passed on, directly or indirectly.
Neither Angel Broking Limited, nor its directors, employees or affiliates shall be liable for any loss or damage that may arise from or in
connection with the use of this information.
Technical and Derivatives Team:
Sameet Chavan Chief Analyst – Technical & Derivatives sameet.chavan@angelbroking.com
Ruchit Jain Senior Analyst - Technical & Derivatives ruchit.jain@angelbroking.com
Rajesh Bhosale Technical Analyst rajesh.bhosle@angelbroking.com
Sneha Seth Derivatives Analyst sneha.seth@angelbroking.com
