1
Technical and Derivatives Review | December 13, 2019
For Private Circulation Only
Smart recovery amid global cool off, all set for fresh highs
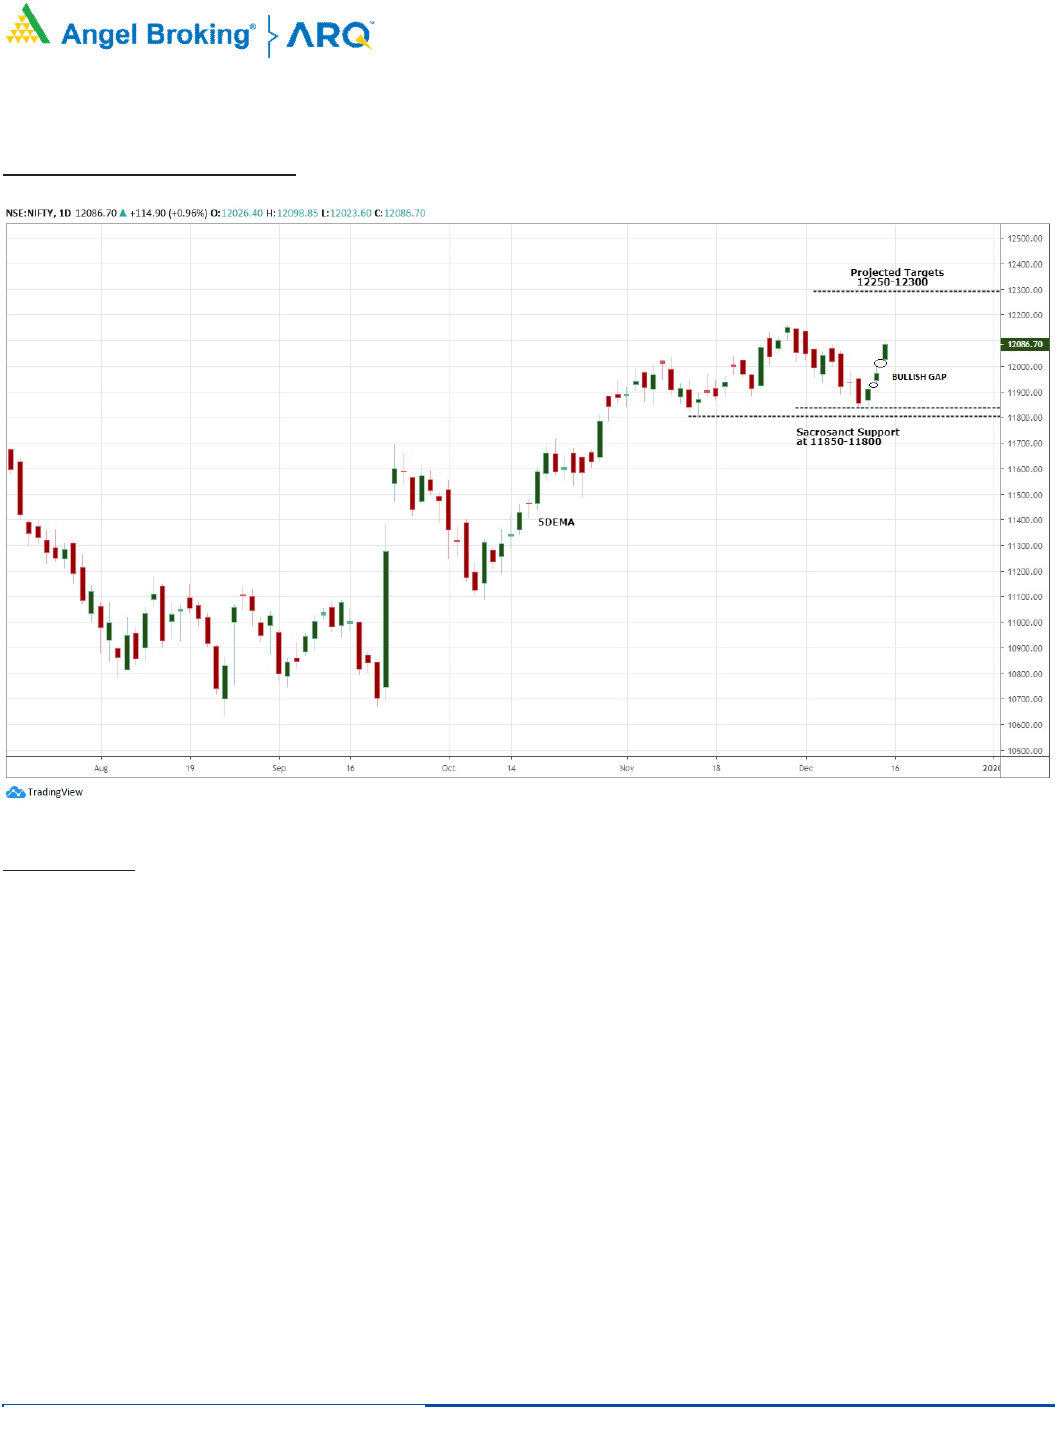
Sensex (41010) / Nifty (12087)
Source: Trading View
Future outlook
The week gone by started trading on a weaker note as the indices continued with its previous week’s corrective phase and the
broader markets too witnessed some sell-off in the initial couple of trading sessions. However, on Wednesday, the Nifty rallied
sharply in the last hour of the trade post forming a low of 11832. This reversal was then followed by consecutive gap up opening on
the last two sessions and the index rallied higher to end the week well above the 12000 mark.
Although we had seen a tepid start for the week, the Nifty again took support in the range of 11850-11800 and resumed its higher
degree uptrend. Based on the basic principle in bull market of ‘Buy on dips’, we were optimistic on the markets in the recent
corrective phase and this strategy has worked quite well since last few months. Now, if we look at the recent chart structure, Nifty
has managed to form a support base in the range of 11850-11800 twice in the recent past (i.e. in mid-November and in last week)
and hence, this range now becomes a sacrosanct for the near term trend. On the flipside, the broader markets too participated in
the rally in last couple of sessions and thus there is no second thought to the belief that the markets have resumed its uptrend.
Hence, we continue with our optimistic stance and advise traders to trade with a positive bias. As per the reciprocal retracement
theory, the probable target for Nifty in the near term is seen around 12250-12300, whereas the immediate supports are placed
around 11950 and 11850 levels.
During the week, the Metals, Auto and the Banking were the outperforming sectors which had seen up move in stocks with good
rise in volumes. These are likely to continue their momentum in the near term and hence, traders are advised to continue to ride the
trend and look for stocks within these sectors (along with selective pharma names too) from a trading perspective.
2
Technical and Derivatives Review | December 13, 2019
For Private Circulation Only
Fresh long formation hints extension of recent rally
Nifty spot closed at 11921.50 this week, against a close of 11921.50 last week. The Put-Call Ratio has increased from 1.25 to 1.63.
The annualized Cost of Carry is positive at 12.93%. The Open Interest of Nifty Futures has increased by 9.15%.
Derivatives View
Nifty current month future closed with a premium of 55.65 points against a premium of 34.20 points to its spot. Next month future
is trading with a premium of 103.80 points.
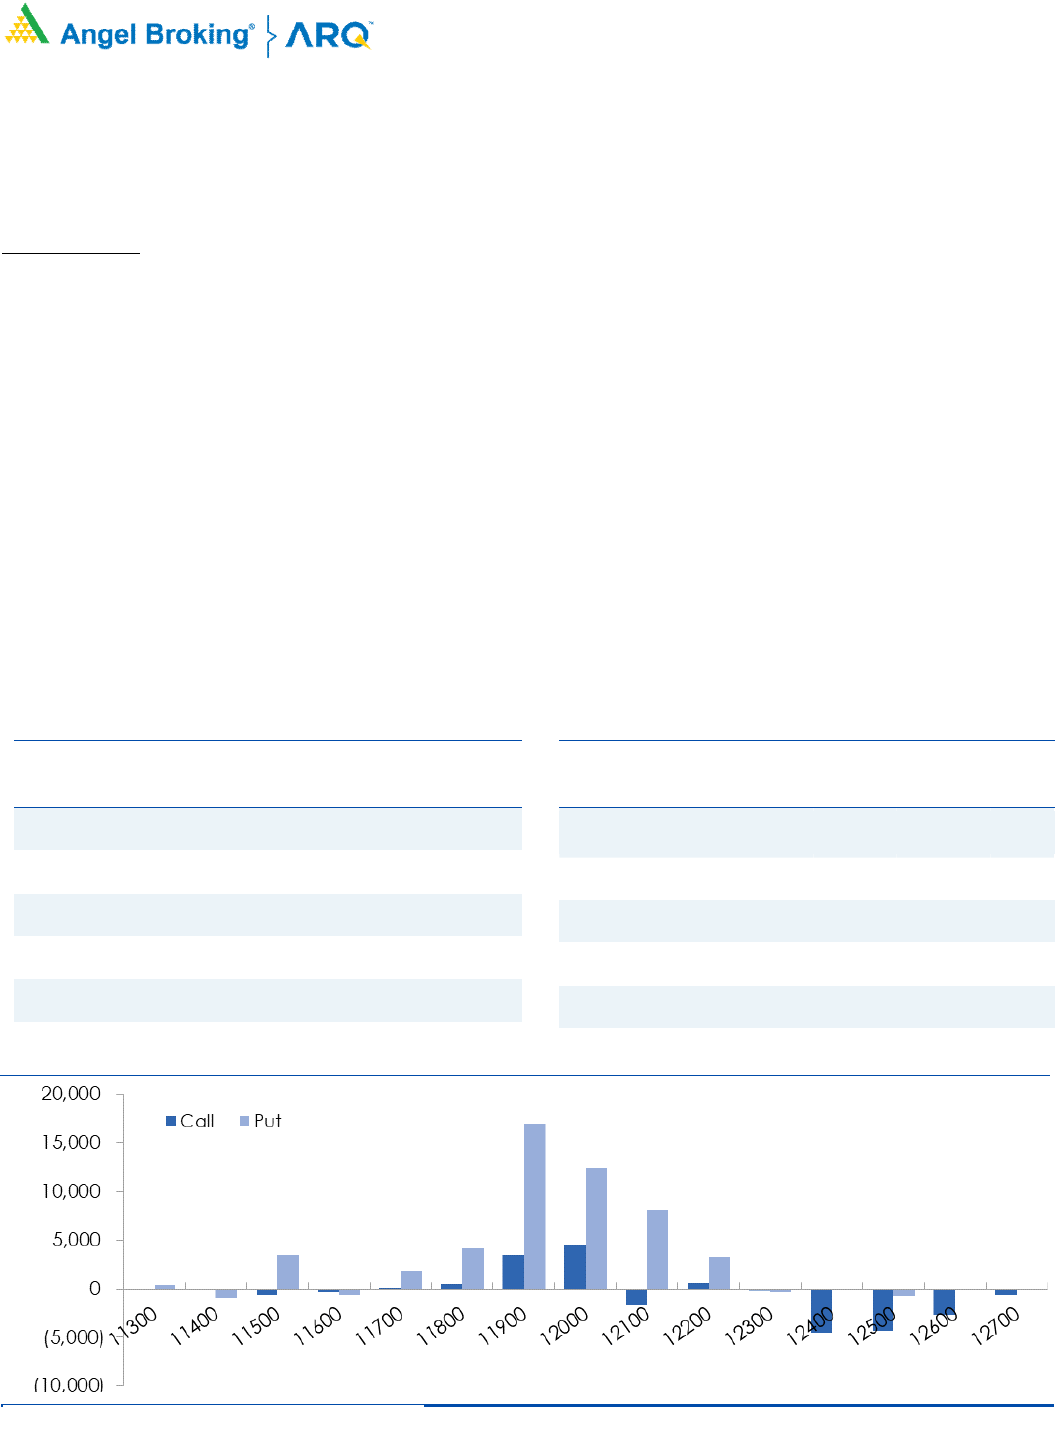
As far as Nifty options activities for the week are concerned, we saw fresh build-up in 11900-12000 call followed by 12100-12600
strikes. On the other side, 11900-12100 puts added huge positions. Maximum open interest for the monthly series now stands at
12000 for both call and put option.
We began the week on a slightly positive note but the benchmark index lacked buying interest and hence corrected towards 11800.
However, strong buying emerged from the support zone of 11800-11850 and we witnessed gap up opening for next two consecutive
session. On Friday, index opened above the hurdle of 12000 and follow-up buying led weekly closing slightly below 12100 mark. In
the correction seen from 12150-11800, we hardly saw any short formation and now in last three sessions recovery good amount of
fresh longs were formed in Nifty. The Nifty future premiums have also surged in recent rally, which is again a sign of strength.
Considering the above development, we would advise traders to use declines to add on fresh longs as we are soon heading to hit
fresh record highs.
Long Formation
Scrip
OI
Futures
OI
Chg (%)
Price
Price
Chg (%)
NMDC 20964000 22.77 114.80 3.84
MANAPPURAM 17784000 14.31 173.60 9.35
TATAMOTORS 65053300 13.24 177.40 9.78
EXIDEIND 9853400 12.90 186.70 2.19
HINDALCO 33456500 12.88 209.30 5.49
Weekly change in OI
Short Formation
Scrip
OI
Futures
OI
Chg (%)
Price
Price
Chg (%)
APOLLOHOSP 2330500 74.90 1361.75 (7.30)
UJJIVAN 9603400 27.57 328.65 (7.10)
YESBANK 257903800 12.83 44.65 (17.39)
APOLLOTYRE 9750000 8.08 167.55 (2.56)
BHARTIARTL 46439739 6.82 430.10 (3.69)

3
Technical and Derivatives Review | December 13, 2019
For Private Circulation Only
Research Team Tel: 022 - 39357600 Website: www.angelbroking.com
For Technical Queries E-mail: technicalresearch-cso@angelbroking.com
For Derivatives Queries E-mail: derivatives.desk@angelbroking.com
DISCLAIMER
Angel Broking Limited (hereinafter referred to as “Angel”) is a registered Member of National Stock Exchange of India Limited, Bombay
Stock Exchange Limited and Metropolitan Stock Exchange Limited. It is also registered as a Depository Participant with CDSL and Portfolio
Manager and Investment Adviser with SEBI. It also has registration with AMFI as a Mutual Fund Distributor. Angel Broking Limited is a
registered entity with SEBI for Research Analyst in terms of SEBI (Research Analyst) Regulations, 2014 vide registration number
INH000000164. Angel or its associates has not been debarred/ suspended by SEBI or any other regulatory authority for accessing
/dealing in securities Market. Angel or its associates/analyst has not received any compensation / managed or co-managed public
offering of securities of the company covered by Analyst during the past twelve months.
This document is solely for the personal information of the recipient, and must not be singularly used as the basis of any investment
decision. Nothing in this document should be construed as investment or financial advice. Each recipient of this document should make
such investigations as they deem necessary to arrive at an independent evaluation of an investment in the securities of the companies
referred to in this document (including the merits and risks involved), and should consult their own advisors to determine the merits and
risks of such an investment.
Reports based on technical and derivative analysis center on studying charts of a stock's price movement, outstanding positions and
trading volume, as opposed to focusing on a company's fundamentals and, as such, may not match with a report on a company's
fundamentals. Investors are advised to refer the Fundamental and Technical Research Reports available on our website to evaluate the
contrary view, if any.
The information in this document has been printed on the basis of publicly available information, internal data and other reliable sources
believed to be true, but we do not represent that it is accurate or complete and it should not be relied on as such, as this document is for
general guidance only. Angel Broking Limited or any of its affiliates/ group companies shall not be in any way responsible for any loss or
damage that may arise to any person from any inadvertent error in the information contained in this report. Angel Broking Limited has
not independently verified all the information contained within this document. Accordingly, we cannot testify, nor make any
representation or warranty, express or implied, to the accuracy, contents or data contained within this document. While Angel Broking
Limited endeavors to update on a reasonable basis the information discussed in this material, there may be regulatory, compliance, or
other reasons that prevent us from doing so.
This document is being supplied to you solely for your information, and its contents, information or data may not be reproduced,
redistributed or passed on, directly or indirectly.
Neither Angel Broking Limited, nor its directors, employees or affiliates shall be liable for any loss or damage that may arise from or in
connection with the use of this information.
Technical and Derivatives Team:
Sameet Chavan Chief Analyst – Technical & Derivatives sameet.chavan@angelbroking.com
Ruchit Jain Technical Analyst ruchit.jain@angelbroking.com
Rajesh Bhosale Technical Analyst rajesh.bhosle@angelbroking.com
Sneha Seth Derivatives Analyst sneha.seth@angelbroking.com