1
For Private Circulation Only
Technical and Derivatives Review
|June 12, 2020
Nifty reclaims 9900 with some authority
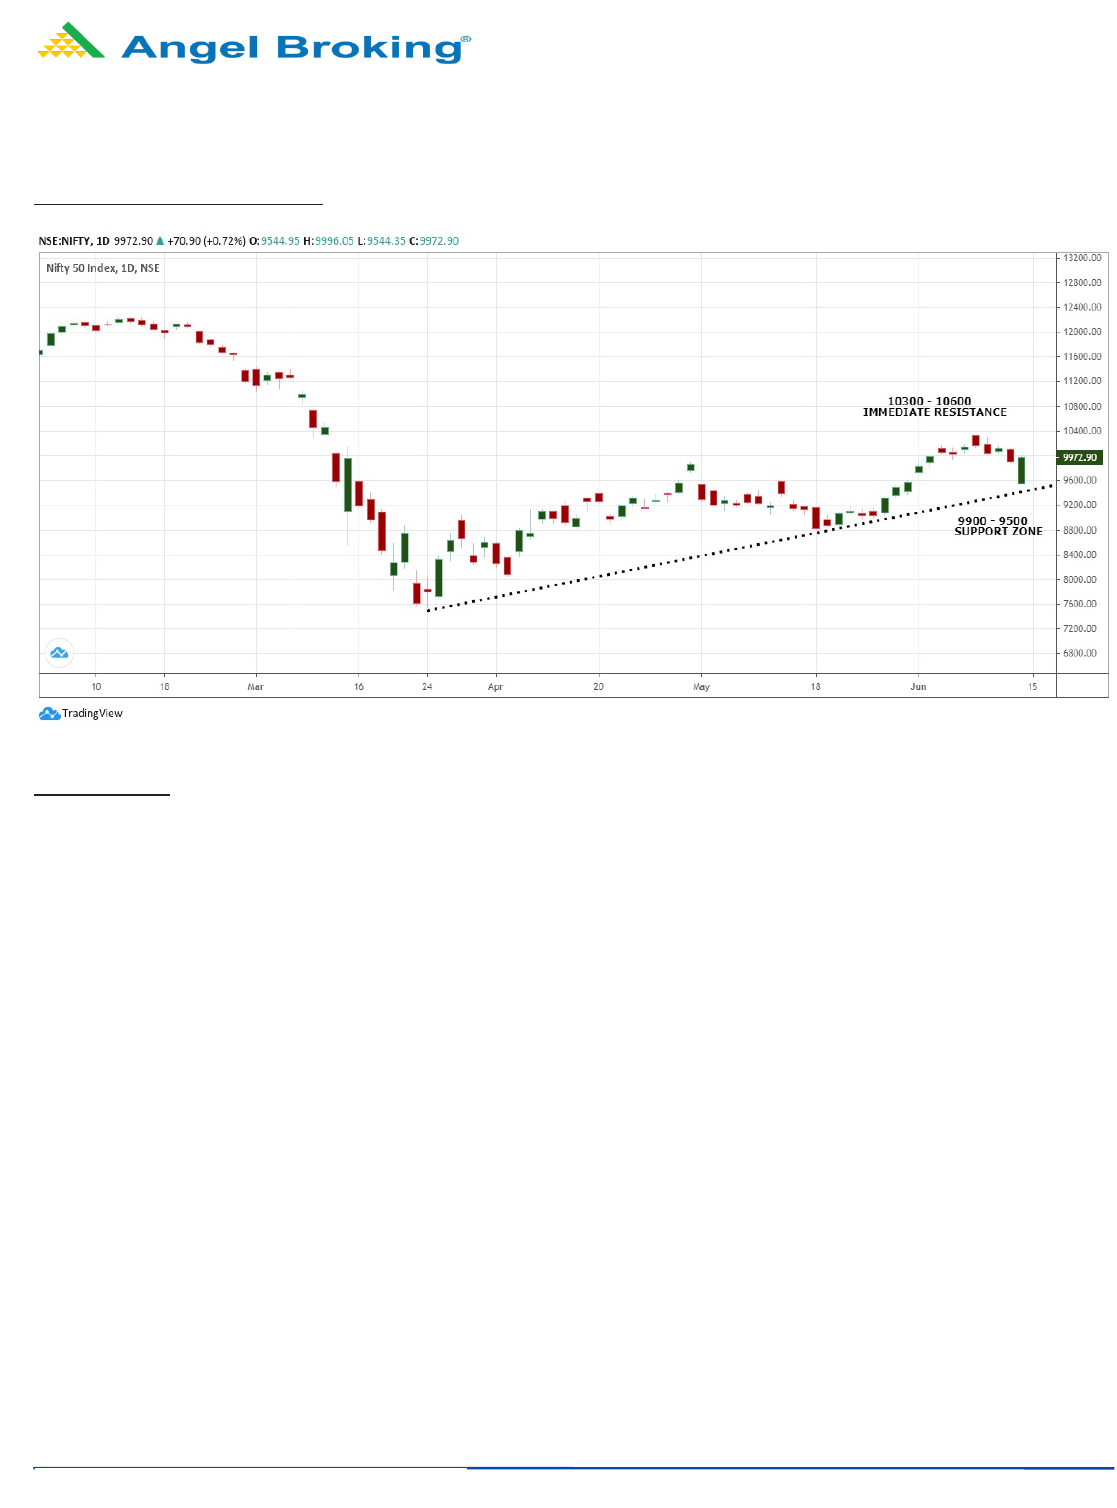
Sensex (33781) / Nifty (9973)
Source: Trading View
Future outlook
This week we started proceedings with a good bump up on Monday, owing to favorable global cues. However, this ecstasy was short lived
as we witnessed a gradual profit booking thereafter. Until Thursday’s first half, index kept gyrating in a very slender range but post the
deferment of Supreme Court’s verdict with respect to AGR dues, markets joined hands with global peers. And since they were trading
deeply in red, the Nifty breached the support of 10000. In fact, things worsened when US markets plunged more than 5% on Thursday. This
resulted in a massive gap down opening in our markets on Friday. Fortunately, our markets saw a v-shaped recovery throughout the
remaining part to conclude the day marginally in the green and thereby restricting weekly losses to a couple of percent.
Barring last two sessions, our market was undergoing a consolidation phase, but the range widened a bit towards the fag end. Broadly
speaking, in the midst of all this, our markets retraced recent up move and managed to reclaim the crucial support of 9900 in a matter of a
few trading hours. If you refer to our recent articles, for us, the trend changing level was 9900 and although it was breached intraday, we
will give more weightage for closing levels. Nifty has not only reclaimed it on a daily basis but with Friday’s close, it has been defended on a
weekly basis as well. Hence, we continue to remain upbeat and construe this decline as a retracement of the recent up move, which was
very much needed to provide the strength for the next leg of the rally. As far as supports are concerned, 9900 continue to be seen as key
support on closing basis. But with today’s move, we can mention a slightly bigger support zone of 9900 – 9544 for the coming week.
On the flipside, we expect Nifty to again go back to recent highs of 10150 – 10300 or may even head towards 10600 – 10800 levels. One of
the key rationales behind this hypothesis is the overall positioning of the Bank Nifty. Couple of weeks back, we could see confirmation of a
positive crossover in ‘RSI-Smoothened’ on the weekly chart. Historically it's proven that when this kind of crossover happens in this
oscillator, it has the tendency to give bigger moves and hence, this observation is adding conviction to our optimistic stance. Also, it would
be unfair not to throw some light on the ‘Midcap’ index, which has given a remarkable move on Friday and thereby indicates a strong move
in the offing.
2
For Private Circulation Only
Technical and Derivatives Review
|June 12, 2020
Options data hints support at 9500
Nifty spot closed at 9972.90 this week, against a close of 10142.15 last week. The Put-Call Ratio has decreased from 1.50 to 1.47.
The annualized Cost of Carry is negative at 4.94%. The Open Interest of Nifty Futures has increased by 4.52%.
Derivatives View
Nifty current month future closed with a discount of 17.55 points against a premium of 3.35 points to its spot. Next month future is
trading at a premium of 26.50 points.
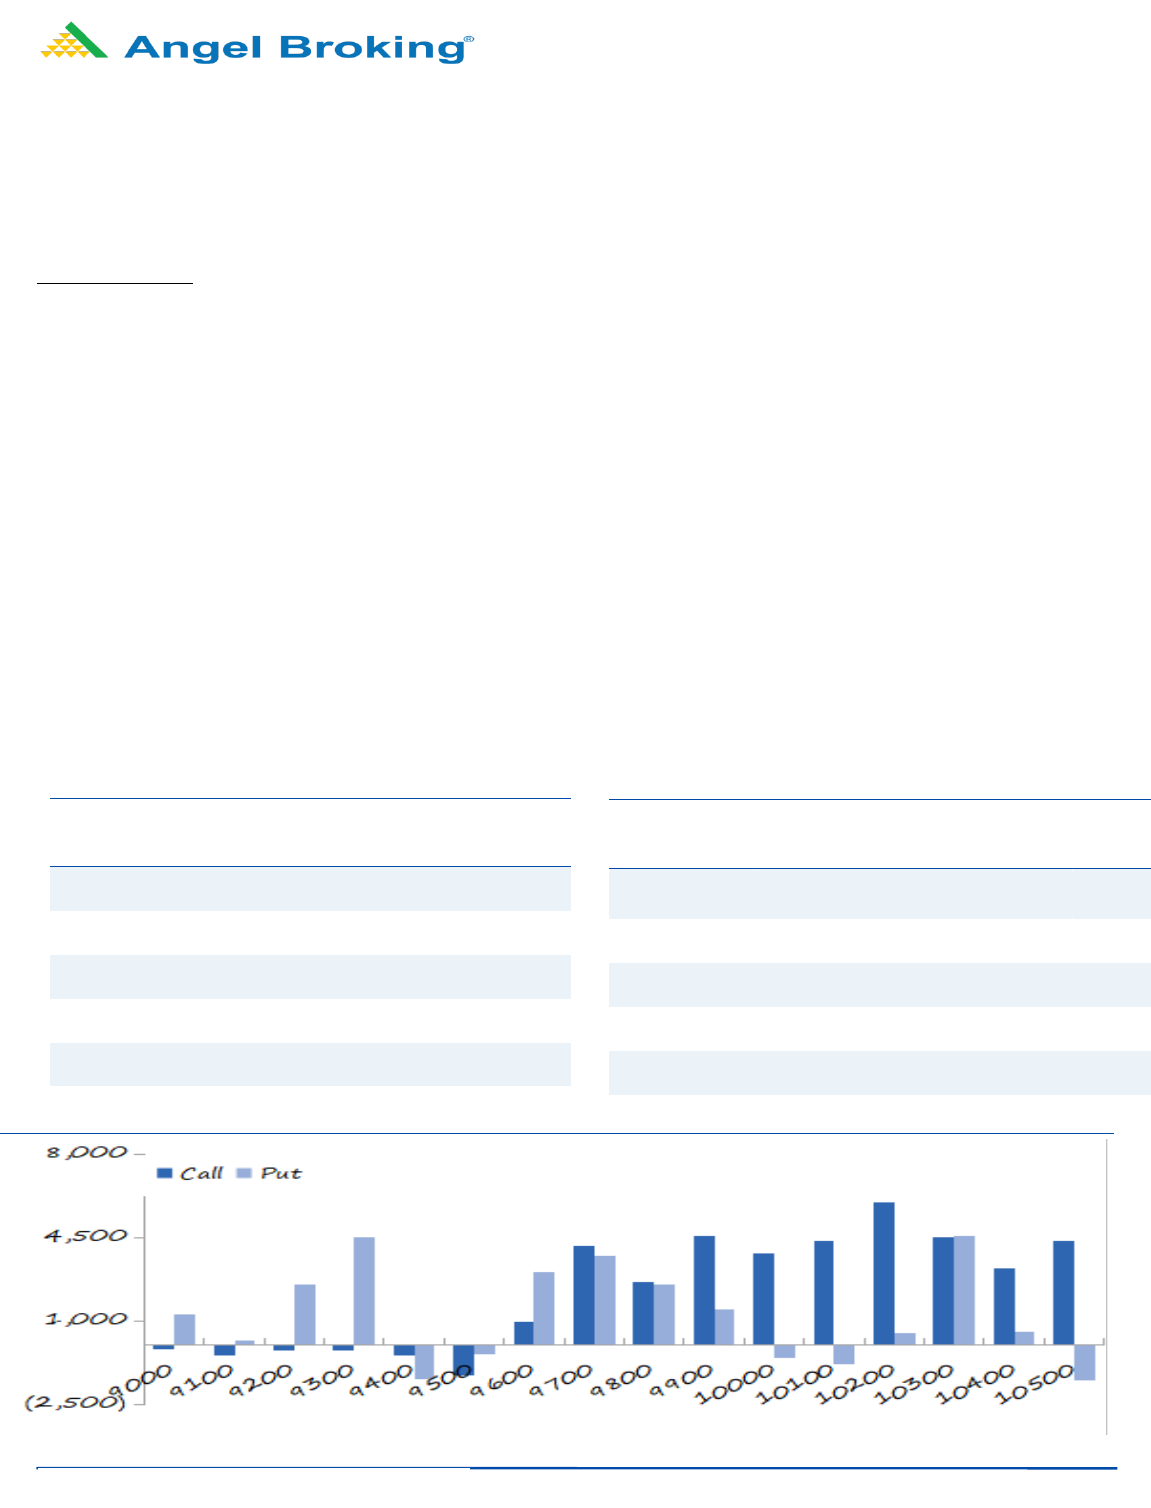
As far as Nifty options activities for the week are concerned, we witnessed some open interest addition in 9900-10300 call options.
On the flipside, 9800-9600 put options also saw some open interest addition. Maximum open interest for the weekly series is at
10000 call option and 9500 put option.
Nifty started trading for the week on a positive note around 10300, but we witnessed a gradual decline during the week to breach
the 10000 mark. On the last trading session of the week, Nifty opened gap down around 9550 due to negative global cues, but it
recovered to erase all the day’s losses and ended the week at 9973. FII’s turned net sellers in cash segment in last three sessions
while they were sellers in the index futures segment too. The weekly options data hints a support at 9500 and resistance at 10000
mark. At the fag end of the week, we saw a good momentum in the market post the gap down opening. A move above 10000 could
then lead to some unwinding by the call writers which could propel the indices higher. Hence, traders are advised to trade with a
positive bias and avoid taking contra trades.
Long Formation
Scrip
OI
Futures
OI
Chg (%)
Price
Price
Chg (%)
CHOLAFIN
7622500
32.34
160.45
10.24
MUTHOOTFIN
1761750
29.35
981.05
6.84
CADILAHC
7453600
20.57
374.40
4.19
M&M
17073400
16.34
508.85
4.84
INDUSINDBK
24716000
15.02
528.90
24.99
Weekly change in OI
Short Formation
Scrip
OI
Futures
OI
Chg (%)
Price
Price
Chg(%)
EXIDEIND 8283100 20.80 154.80 (10.83)
INFRATEL
10143600
19.71
224.55
(5.15)
PIDILITIND
2862500
18.11
1434.80
(5.03)
TATASTEEL
23590500
15.39
317.50
(6.52)
COALINDIA
37542400
9.89
134.85
(7.19)

3
For Private Circulation Only
Technical and Derivatives Review
|June 12, 2020
Research Team Tel: 022 - 39357600 (Extn – 6844) Website: www.angelbroking.com
DISCLAIMER
Angel Broking Limited (hereinafter referred to as “Angel”) is a registered Member of National Stock Exchange of India Limited, Bombay
Stock Exchange Limited and Metropolitan Stock Exchange Limited. It is also registered as a Depository Participant with CDSL and
Portfolio Manager and Investment Adviser with SEBI. It also has registration with AMFI as a Mutual Fund Distributor. Angel Broking
Limited is a registered entity with SEBI for Research Analyst in terms of SEBI (Research Analyst) Regulations, 2014 vide registration
number INH000000164. Angel or its associates has not been debarred/ suspended by SEBI or any other regulatory authority for
accessing /dealing in securities Market. Angel or its associates/analyst has not received any compensation / managed or co-managed
public offering of securities of the company covered by Analyst during the past twelve months.
This document is solely for the personal information of the recipient, and must not be singularly used as the basis of any investment
decision. Nothing in this document should be construed as investment or financial advice. Each recipient of this document should make
such investigations as they deem necessary to arrive at an independent evaluation of an investment in the securities of the companies
referred to in this document (including the merits and risks involved), and should consult their own advisors to determine the merits
and risks of such an investment.
Reports based on technical and derivative analysis center on studying charts of a stock's price movement, outstanding positions and
trading volume, as opposed to focusing on a company's fundamentals and, as such, may not match with a report on a company's
fundamentals. Investors are advised to refer the Fundamental and Technical Research Reports available on our website to evaluate the
contrary view, if any.
The information in this document has been printed on the basis of publicly available information, internal data and other reliable
sources believed to be true, but we do not represent that it is accurate or complete and it should not be relied on as such, as this
document is for general guidance only. Angel Broking Limited or any of its affiliates/ group companies shall not be in any way
responsible for any loss or damage that may arise to any person from any inadvertent error in the information contained in this report.
Angel Broking Limited has not independently verified all the information contained within this document. Accordingly, we cannot
testify, nor make any representation or warranty, express or implied, to the accuracy, contents or data contained within this document.
While Angel Broking Limited endeavors to update on a reasonable basis the information discussed in this material, there may be
regulatory, compliance, or other reasons that prevent us from doing so.
This document is being supplied to you solely for your information, and its contents, information or data may not be reproduced,
redistributed or passed on, directly or indirectly.
Neither Angel Broking Limited, nor its directors, employees or affiliates shall be liable for any loss or damage that may arise from or in
connection with the use of this information.
Technical and Derivatives Team:
Sameet Chavan Chief Analyst – Technical & Derivatives sameet.chavan@angelbroking.com
Ruchit Jain Senior Analyst - Technical & Derivatives ruchit.jain@angelbroking.com
Rajesh Bhosale Technical Analyst rajesh.bhosle@angelbroking.com
Sneha Seth Derivatives Analyst sneha.seth@angelbroking.com