1
For Private Circulat
ion Only
Technical and Derivatives Review
|July 10, 2020
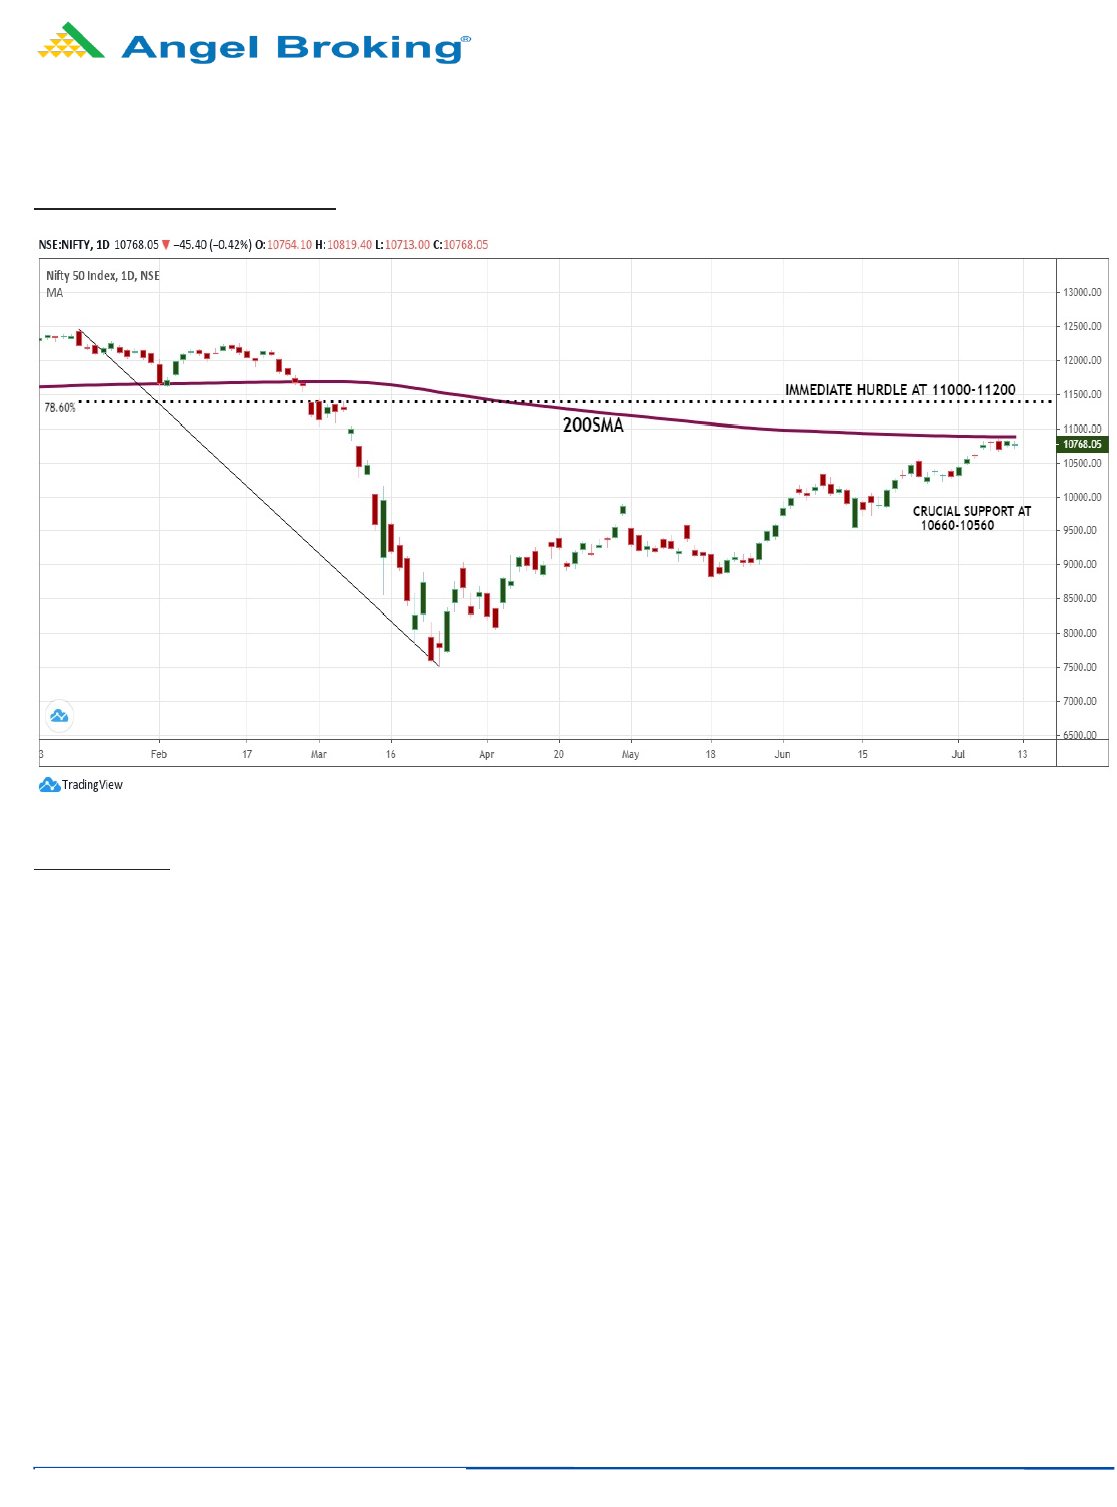
Market takes a breather around 200-SMA
Sensex (36594) / Nifty (10768)
Source: Trading View
Future outlook
Our markets carried the previous week’s positivity on Monday as well and hence, the Nifty started the proceedings with a decent
upside gap, owing to favourable cues from the global bourses. However, the momentum disappeared all of a sudden from the
market, which resulted into a lacklustre movement throughout the remaining part of the day. It is hard to believe but the Nifty
gyrated in a slender range of merely 160 points during the week. In the midst of all this, the Nifty concluded the week with moderate
gains of one and half percent.
It’s been a stellar Bull run for our markets since the March lows and markets never looked back to reach the crucial zone of ‘200-
SMA’ on daily chart. The kind of lethargic activity we witnessed in the week gone by was quite evident, because the market has seen
a relentless move without any major halt in between and has reached such a crucial junction. Firstly, as mentioned the key moving
average of 200-SMA on a daily chart. This coincides with the Weekly 89-EMA as well as monthly 20-EMA and hence, the bulls had to
respect them. Ideally, if the market has to correct, this is the perfect zone from where it can. In fact, in the previous article, we had
clearly advocated booking profits in the ongoing rally in the zone of 10700-11000 and we continue to do so at least for momentum
traders. But by no means, we advise going short on the market because the momentum in individual stocks is still strong and
importantly, we are seeing a consensus opinion about the market correcting from current levels. As we all know, when everyone
expects a fall, it never comes and vice versa. So, in our sense, the Nifty would first surpass the 10850 mark and head towards the
78.6% retracement zone of the entire fall i.e. 11000-11200, where we can actually see some profit booking taking place. If consensus
view has to fail, this possibility cannot be ruled out.
Any assumption needs a proper exit strategy if not worked as per the expectation. Hence, in this scenario, the hypothesis remains
valid as long as the crucial support of 10660-10560 remains intact. A breach of mentioned supports would certainly trigger a decent
profit booking in the market and hence, keep a tab of all the mentioned possibilities and key levels. It would be important to
highlight that the banking space holds a key in all this and hence, all eyes would be on its heavyweight constituents as well.
2
For Private Circulat
ion Only
Technical and Derivatives Review
|July 10, 2020
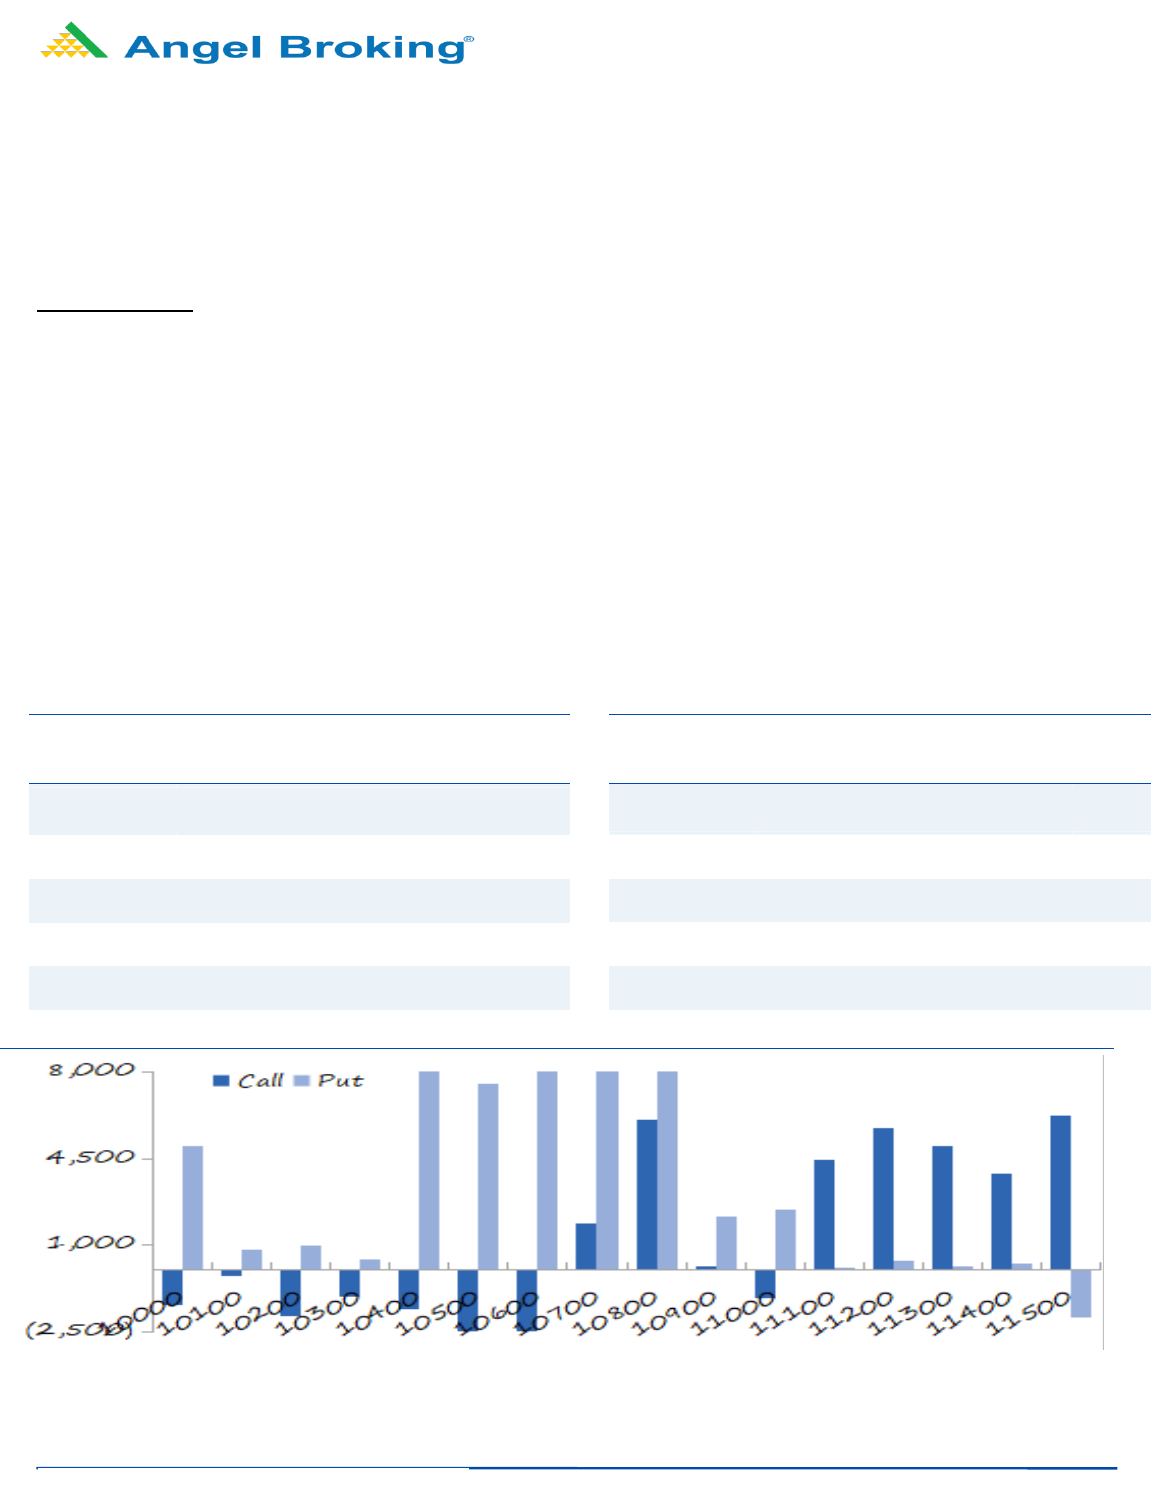
Stronger hands form long positions
Nifty spot closed at 10768.05 this week, against a close of 10607.35 last week. The Put-Call Ratio has decreased from 1.50 to 1.47.
The annualized Cost of Carry is negative at 0.24%. The Open Interest of Nifty Futures has increased by 11.31%.
Derivatives View
Nifty current month future closed with a discount of 1.40 points against a discount of 34.90 points points to its spot. Next month
future is trading at a premium of 8.85 points.
As far as Nifty options activities for the week are concerned, we witnessed some open interest addition in 10800 call and in 10800-
10600 put options. Maximum open interest for the weekly series is at 11000 call option and 10000 put option.
During this week, indices consolidated in a narrow range, but decent open interest addition was seen in Nifty as well as Bank Nifty.
FII’s formed fresh long positions in the index futures segment during this week too which led to an increase in their ‘Long Short
Ratio’ to over 57 percent. In the weekly options segment, open interest concentration is scattered in 10800-11000 call whereas
support is placed at 10700-10600. Long formation by the stronger hands is a positive sign and hence traders are advised to trade
with a positive bias. As per the data, 10600 is the support and if the same is breached then one should reassess the situation.
Weekly change in OI
Short Formation
Scrip
OI
Futures
OI
Chg (%)
Price
Price
Chg(%)
MGL 1336200 95.87 973.60 (9.28)
IGL
9895875
37.79
409.45
(8.72)
MUTHOOTFIN
4227750
28.38
1089.
45
(5.26)
INFRATEL
12569200
23.60
209.75
(7.33)
CUMMINSIND
2038800
22.49
392.30
(4.76)
Long Formation
Scrip
OI
Futures
OI
Chg (%)
Price
Price
Chg(%)
BAJFINANCE 7292250 16.42 3301.55 12.77
EQUITAS
15108800
15.45
59.70
11.69
SRF
605500
14.57
39
02.75
6.94
HINDALCO
39456800
13.38
164.35
12.38
NCC
22323000
12.13
33.70
10.49

3
For Private Circulat
ion Only
Technical and Derivatives Review
|July 10, 2020
Research Team Tel: 022 - 39357600 (Extn – 6844) Website: www.angelbroking.com
DISCLAIMER
Angel Broking Limited (hereinafter referred to as “Angel”) is a registered Member of National Stock Exchange of India Limited, Bombay
Stock Exchange Limited and Metropolitan Stock Exchange Limited. It is also registered as a Depository Participant with CDSL and
Portfolio Manager and Investment Adviser with SEBI. It also has registration with AMFI as a Mutual Fund Distributor. Angel Broking
Limited is a registered entity with SEBI for Research Analyst in terms of SEBI (Research Analyst) Regulations, 2014 vide registration
number INH000000164. Angel or its associates has not been debarred/ suspended by SEBI or any other regulatory authority for
accessing /dealing in securities Market. Angel or its associates/analyst has not received any compensation / managed or co-managed
public offering of securities of the company covered by Analyst during the past twelve months.
This document is solely for the personal information of the recipient, and must not be singularly used as the basis of any investment
decision. Nothing in this document should be construed as investment or financial advice. Each recipient of this document should make
such investigations as they deem necessary to arrive at an independent evaluation of an investment in the securities of the companies
referred to in this document (including the merits and risks involved), and should consult their own advisors to determine the merits
and risks of such an investment.
Reports based on technical and derivative analysis center on studying charts of a stock's price movement, outstanding positions and
trading volume, as opposed to focusing on a company's fundamentals and, as such, may not match with a report on a company's
fundamentals. Investors are advised to refer the Fundamental and Technical Research Reports available on our website to evaluate the
contrary view, if any.
The information in this document has been printed on the basis of publicly available information, internal data and other reliable
sources believed to be true, but we do not represent that it is accurate or complete and it should not be relied on as such, as this
document is for general guidance only. Angel Broking Limited or any of its affiliates/ group companies shall not be in any way
responsible for any loss or damage that may arise to any person from any inadvertent error in the information contained in this report.
Angel Broking Limited has not independently verified all the information contained within this document. Accordingly, we cannot
testify, nor make any representation or warranty, express or implied, to the accuracy, contents or data contained within this document.
While Angel Broking Limited endeavors to update on a reasonable basis the information discussed in this material, there may be
regulatory, compliance, or other reasons that prevent us from doing so.
This document is being supplied to you solely for your information, and its contents, information or data may not be reproduced,
redistributed or passed on, directly or indirectly.
Neither Angel Broking Limited, nor its directors, employees or affiliates shall be liable for any loss or damage that may arise from or in
connection with the use of this information.
Technical and Derivatives Team:
Sameet Chavan Chief Analyst – Technical & Derivatives sameet.chavan@angelbroking.com
Ruchit Jain Senior Analyst - Technical & Derivatives ruchit.jain@angelbroking.com
Rajesh Bhosale Technical Analyst rajesh.bhosle@angelbroking.com
Sneha Seth Derivatives Analyst sneha.seth@angelbroking.com
