1
For Private Circulation Only
Technical and Derivatives Review
| April 09, 2020
Colossal rally despite a truncated week, 9000 reclaimed convincingly
Sensex (31160) / Nifty (9112)
Source: Trading View
Future outlook
After an extended weekend, our markets kick started the new trading week on Tuesday with a decent bump up of more than 300 points.
This was mainly on the back of a strong relief move seen in US markets as the death toll with respect to coronavirus reduced a bit and
thereby gave early signs of subsiding this pandemic. Although, the close was muted on Wednesday, markets compensated well by yet
another gap up opening on the subsequent day. In fact, the buying momentum accelerated in the latter half to conclude the week well
above the 9000 mark.
Looking at the colossal rally of more than 12% on a weekly basis, who would believe that it was a truncated week and in merely 3 trading
sessions, the Nifty is convincingly beyond 9000. As far as the coronavirus pandemic is concerned, in reality, we are still not out of the
woods yet. But market mostly moves on hope or anticipation, this is clearly one of those instances. Practically, the major impact of this
epidemic has already been discounted by markets across the globe in last few weeks and there was just a small ray of hope needed to
rebound sharply from extreme oversold or under owned situations. With this, previous Friday’s decline becomes a bear trap as we are
significantly off lows now before anyone could realise.
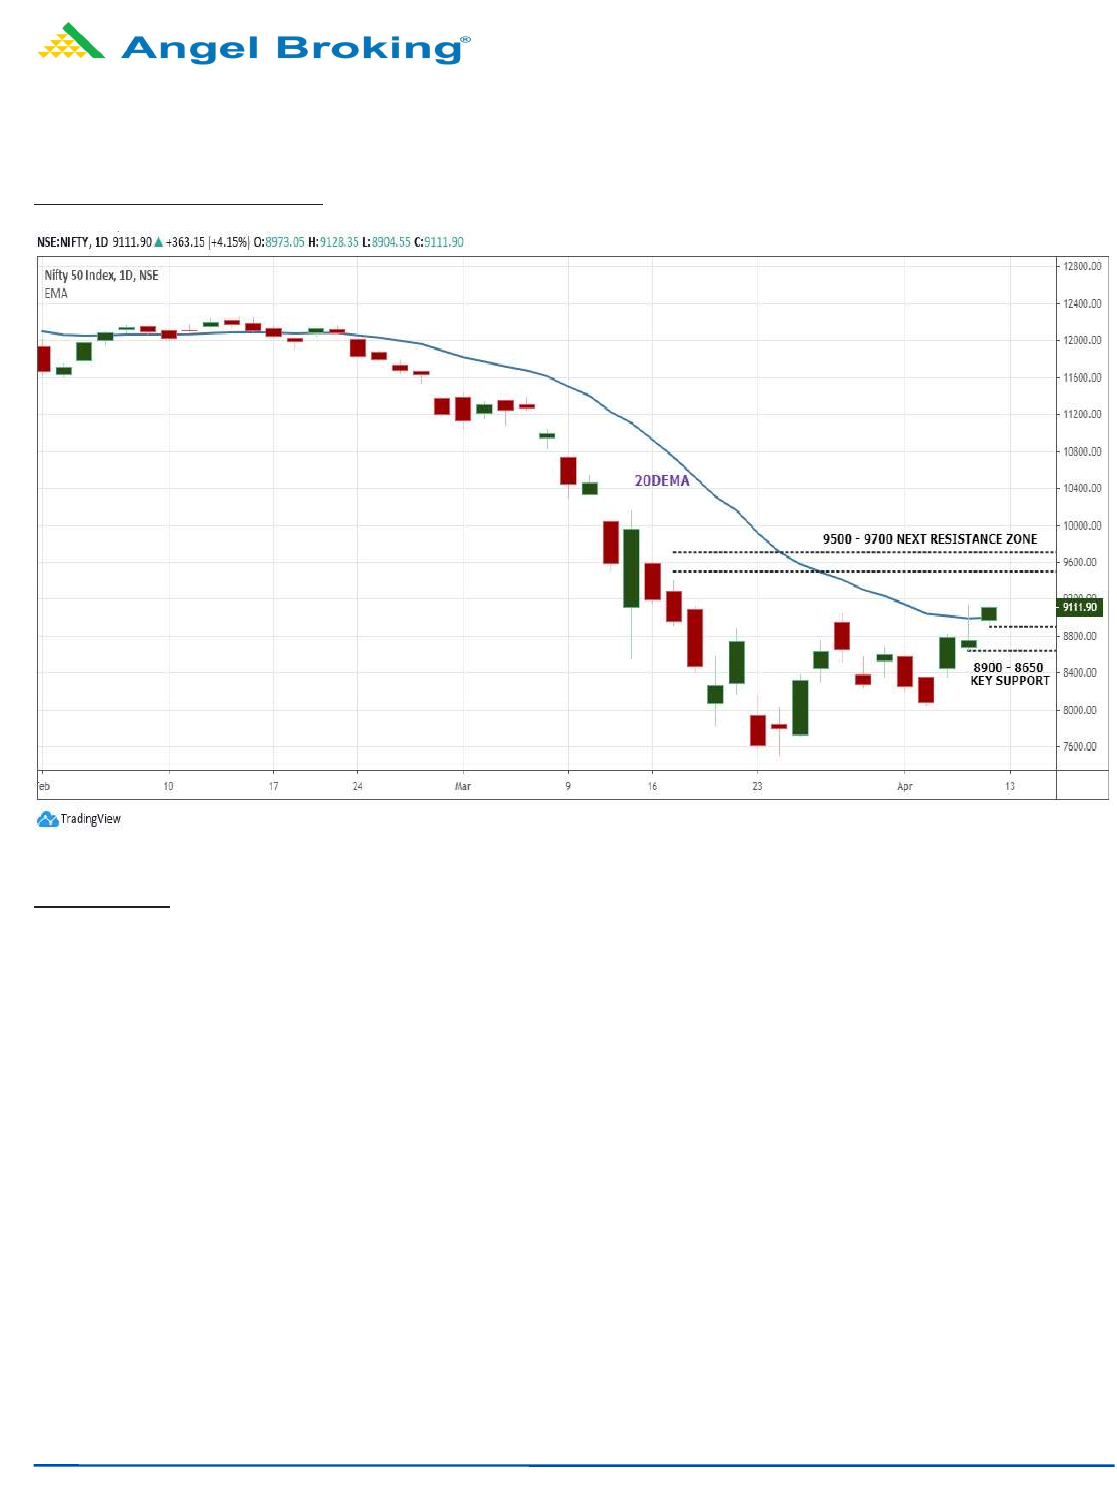
Technically speaking, the Nifty has now managed to surpass the ‘20-day EMA’ for the first time since 24th February. Since there was a
complete broad based participation in this move, it can be considered as a robust one. Looking at the way charts are shaped up, we will not
be surprised to see this rally getting extended towards 9500-9700 over the next few days. However, one must not forget that the recent
crisis is related to ‘Health’ and hence, it would be important to see further developments with respect to coronavirus over the weekend. If
no aberration seen then the above mentioned levels are very much on cards. On the flipside, 8900 followed by 8650 would be seen as key
supports. Traders are advised to keep following stock centric approach and should keep booking timely profits on a regular basis.
2
For Private Circulation Only
Technical and Derivatives Review
| April 09, 2020
India VIX corrects to end below 50
Nifty spot closed at 9111.90 this week, against a close of 8083.80 last week. The Put-Call Ratio has increased from 1.18 to 1.53. The
annualized Cost of Carry is negative at 4.80%. The Open Interest of Nifty Futures has increased by 12.39%.
Derivatives View
Nifty current month future closed with a discount of 25.20 points against a premium of 0.70 points to its spot. Next month future is
trading with a discount of 10.80 points.
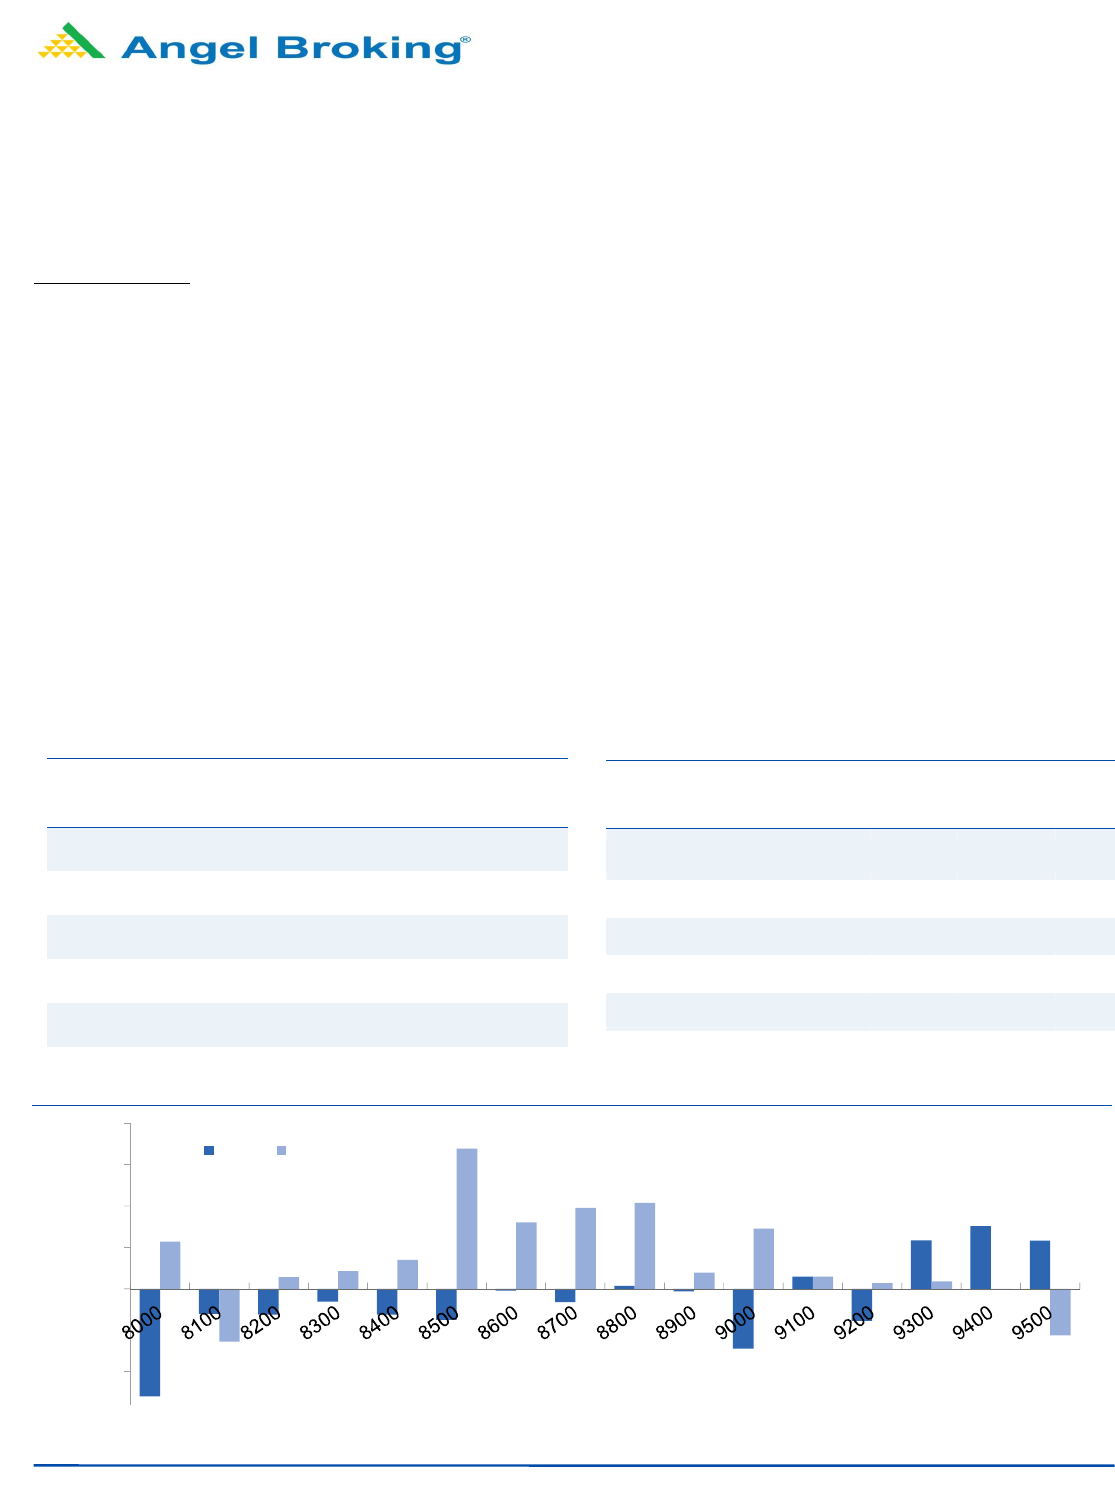
As far as Nifty options activities for the week are concerned, we witnessed unwinding in call options as the market rallied whereas
8800-8500 put options witnessed open interest addition. Maximum open interest for the monthly series now stands at 10000 call
option and 8000 put option.
During the week, the Nifty index rallied by over 12 percent with rise in open interest by 8 percent whereas Bank Nifty rallied by 15
percent with rise in open interest by 15.74 percent. FII’s covered some of their short positions and formed fresh long positions in the
index futures segment. Their ‘Long Short Ratio’ which was 28 percent on last Friday has now moved to 44 percent. We witnessed
open interest addition in put options as the market rallied and India VIX corrected during the week to end below the 50 mark. The
above data clearly indicates short covering along with fresh long formation was seen during this week. In the coming week, we could
see continuation of this momentum upto 9400-9500. The immediate support for Nifty is placed around 8800 followed by 8500.
Long Formation
Scrip
OI
Futures
OI
Chg (%)
Price
Price
Chg (%)
CUMMINSIND
1698300
88.32
355.50
18.60
TORNTPHARM
472000
51.28
2567.85
23.97
LUPIN
8616300
37.10
794.70
21.30
TVSMOTOR
3014550
35.09
301.80
19.43
CADILAHC
3982000
33.19
350.50
27.25
Weekly change in OI
(3,000)
(2,000)
(1,000)
0
1,000
2,000
3,000
4,000
Call Put
Short Formation
Scrip
OI
Futures
OI
Chg (%)
Price
Price
Chg (%)
- - - - -
- - - - -
- - - - -
- - - - -
- - - - -

3
For Private Circulation Only
Technical and Derivatives Review
| April 09, 2020
Research Team Tel: 022 - 39357600 Website: www.angelbroking.com
For Derivatives Queries E-mail: derivatives.desk@angelbroking.com
DISCLAIMER
Angel Broking Limited (hereinafter referred to as “Angel”) is a registered Member of National Stock Exchange of India Limited, Bombay
Stock Exchange Limited and Metropolitan Stock Exchange Limited. It is also registered as a Depository Participant with CDSL and
Portfolio Manager and Investment Adviser with SEBI. It also has registration with AMFI as a Mutual Fund Distributor. Angel Broking
Limited is a registered entity with SEBI for Research Analyst in terms of SEBI (Research Analyst) Regulations, 2014 vide registration
number INH000000164. Angel or its associates has not been debarred/ suspended by SEBI or any other regulatory authority for
accessing /dealing in securities Market. Angel or its associates/analyst has not received any compensation / managed or co-managed
public offering of securities of the company covered by Analyst during the past twelve months.
This document is solely for the personal information of the recipient, and must not be singularly used as the basis of any investment
decision. Nothing in this document should be construed as investment or financial advice. Each recipient of this document should make
such investigations as they deem necessary to arrive at an independent evaluation of an investment in the securities of the companies
referred to in this document (including the merits and risks involved), and should consult their own advisors to determine the merits
and risks of such an investment.
Reports based on technical and derivative analysis center on studying charts of a stock's price movement, outstanding positions and
trading volume, as opposed to focusing on a company's fundamentals and, as such, may not match with a report on a company's
fundamentals. Investors are advised to refer the Fundamental and Technical Research Reports available on our website to evaluate the
contrary view, if any.
The information in this document has been printed on the basis of publicly available information, internal data and other reliable
sources believed to be true, but we do not represent that it is accurate or complete and it should not be relied on as such, as this
document is for general guidance only. Angel Broking Limited or any of its affiliates/ group companies shall not be in any way
responsible for any loss or damage that may arise to any person from any inadvertent error in the information contained in this report.
Angel Broking Limited has not independently verified all the information contained within this document. Accordingly, we cannot
testify, nor make any representation or warranty, express or implied, to the accuracy, contents or data contained within this document.
While Angel Broking Limited endeavors to update on a reasonable basis the information discussed in this material, there may be
regulatory, compliance, or other reasons that prevent us from doing so.
This document is being supplied to you solely for your information, and its contents, information or data may not be reproduced,
redistributed or passed on, directly or indirectly.
Neither Angel Broking Limited, nor its directors, employees or affiliates shall be liable for any loss or damage that may arise from or in
connection with the use of this information.
Technical and Derivatives Team:
Sameet Chavan Chief Analyst – Technical & Derivatives sameet.chavan@angelbroking.com
Ruchit Jain Technical Analyst ruchit.jain@angelbroking.com
Rajesh Bhosale Technical Analyst rajesh.bhosle@angelbroking.com
Sneha Seth Derivatives Analyst sneha.seth@angelbroking.com