1
For Private Circulation Only
Technical and Derivatives Review | February 01, 2020
Budget disappoints, markets back to 200 SMA
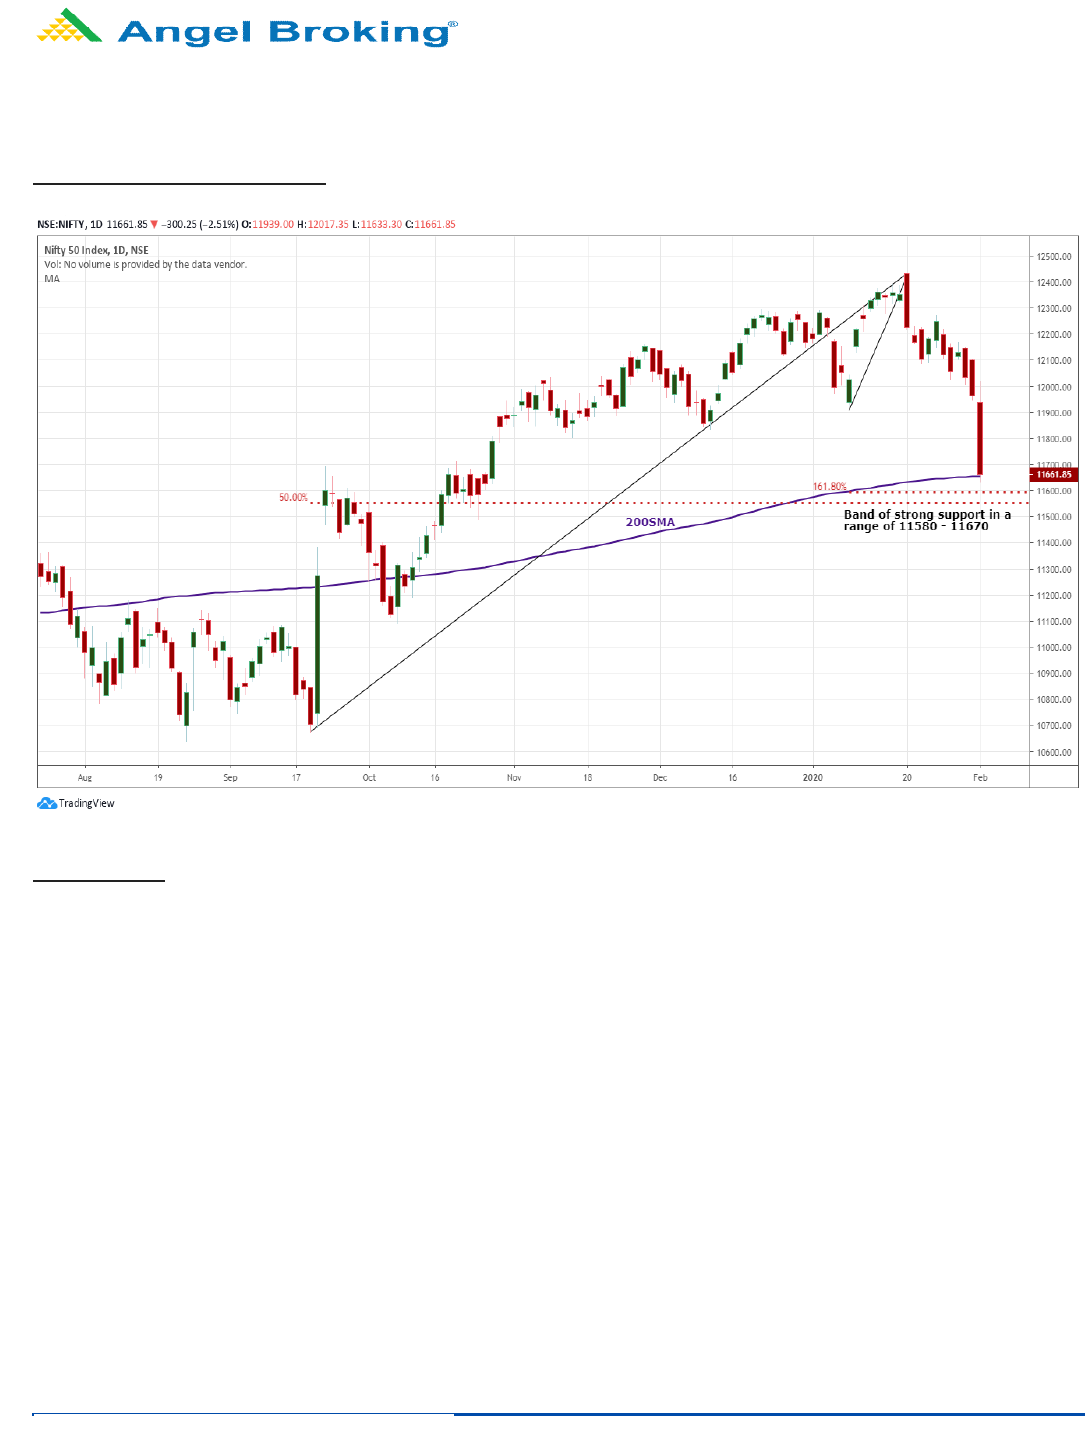
Sensex (39736) / Nifty (11662)
Source: Trading View
Future outlook
The week started with ‘Coronavirus’ threat increasing rapidly across the globe. Although, we too reacted to this development, the
negativity was not as high as it was in the global peers as participants were mainly focusing on our mega event i.e. ‘Union Budget’. But it
turned out to be a nightmare for the bulls as we saw sharp cut on the budget day; courtesy to not so encouraging announcements from the
Finance Minister. In the process, Nifty ended the extended week with a massive cut of nearly 5% to the previous week’s close.
Honestly speaking, this is not the kind of event one would have expected for. Participants were quite hopeful of hearing some positive
announcement from the Finance minister. But eventually they left dejected and this is what we could see from such reaction. Now, if we try
to analyse the chart, we can see index hastening towards its ‘200-SMA’ before anyone could realise it. In fact, there are multiple indicators
that converge in the band of nearly 100 points. This 200-SMA level of 11654 coincides with 161% reciprocal retracement of the rise from
11929.60 to 12430.50. In addition, the 50% retracement of the entire up move from 10670.25 to 12430.50 comes around 11580. It does
not end here as we can see previous breakout point also at 11660. Looking at all these supports, bulls would remain a bit hopeful now also.
But yes, the confidence may have been completely shaken with the velocity at which we fell on Saturday.
Thus, first half of this week would be quite crucial for our market. If we do not see any escalation on the global as well as domestic front,
we may see some recovery from the mentioned supports. However, a failure to do so, one should get prepared for lower levels. Although,
the broader market too had undergone a severe correction, the only ray of hope is the higher degree structure of the ‘Nifty MIDCAP 50’
index. The weekly and monthly time frame charts as of now suggests a retracement move towards the breakout points and hence, just
keep your fingers crossed and hope for the negativity to subside in this week. Till then better to stay light and avoid taking undue risks.
2
For Private Circulation Only
Technical and Derivatives Review | February 01, 2020
Nifty PCR-OI plunged below 1
Nifty spot closed at 11661.85 this week, against a close of 12248.25 last week. The Put-Call Ratio has decreased from 1.42 to 0.86.
The annualized Cost of Carry is negative at 0.84%. The Open Interest of Nifty Futures has decreased by 1.06%.
Derivatives View
Nifty current month future closed with a discount of 6.95 points against a premium of 61.25 points to its spot. Next month future is
trading with a premium of 38.65 points.
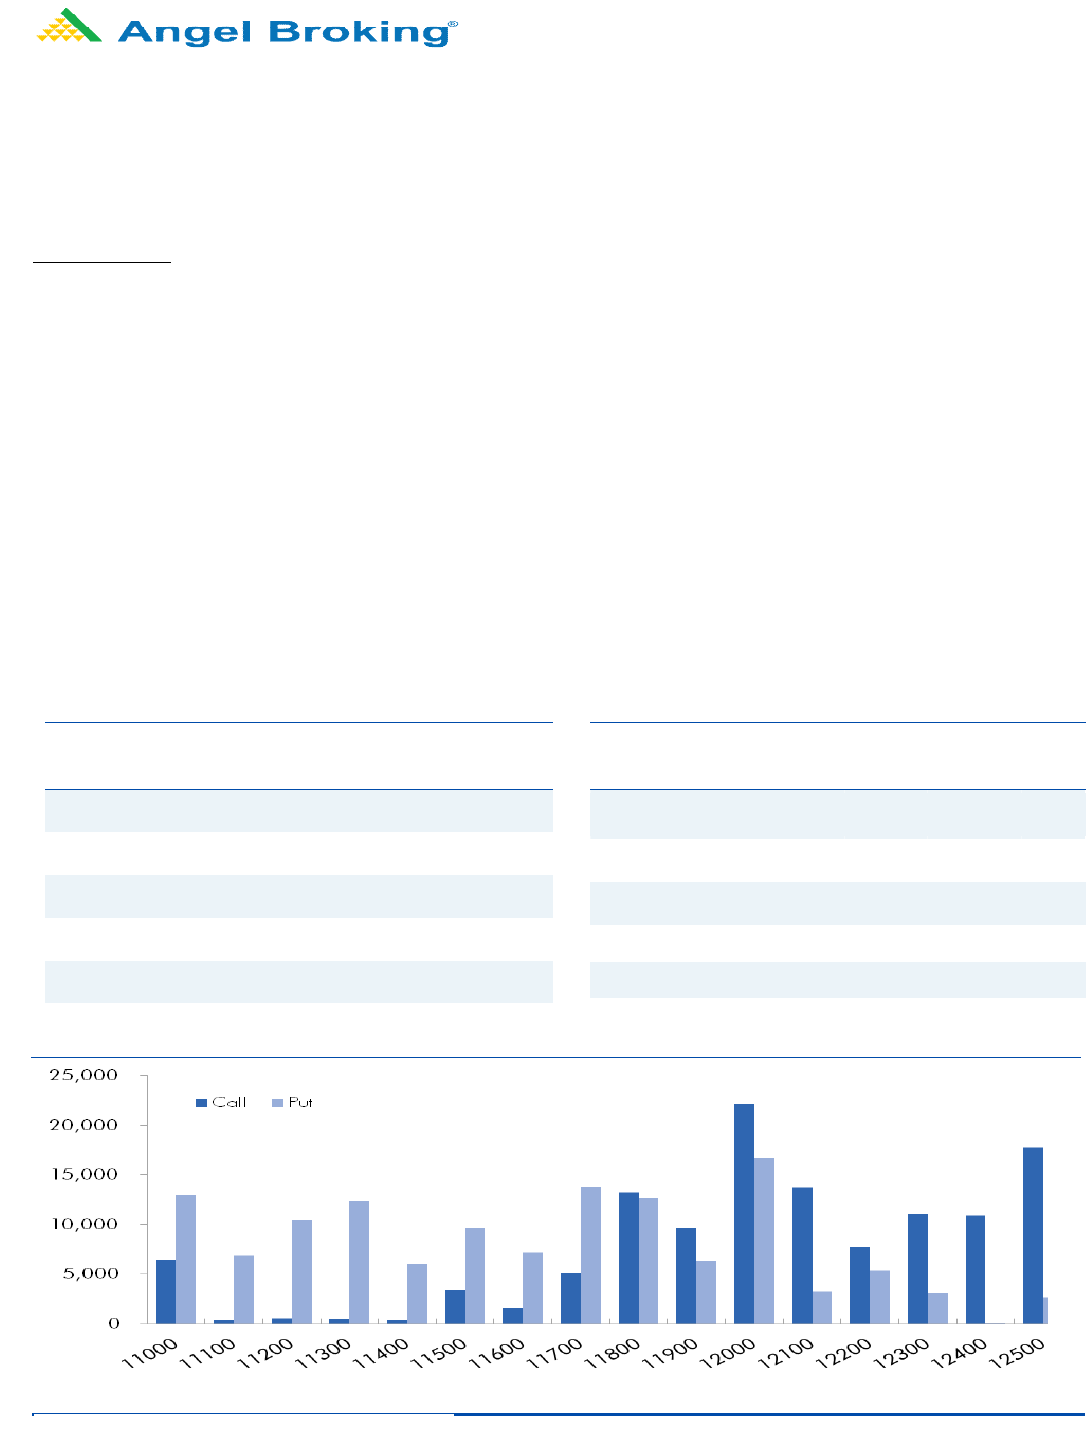
As far as Nifty options activities for the week are concerned, we saw build-up scattered between 11800-12500 call and 11000-12000
put options. Maximum open interest for the monthly series now stands at 12000 put and 12500 call option.
Post last week correction, we started off the week on a negative note and saw follow-up selling towards the important support zone
of 12000. On Wednesday, Nifty showed some respite in the opening and managed to conclude above 12100 mark; however, this got
sold into and we witnessed extension of massive selling in next three sessions. On Friday, the benchmark index corrected another
2.5% to conclude the week tad below 11700 mark. Last series, we hardly saw any relevant open interest addition MoM and the
rollover were also below the averages. In last two sessions, we witnessed huge addition of short positions in Nifty and BankNifty
Futures. Considering the above development, we would advise traders to wait for the follow-up move in the next 2-3 trading
sessions before initiating any directional positions.
Long Formation
Scrip
OI
Futures
OI
Chg (%)
Price
Price
Chg (%)
COALINDIA 64662300 74.02 167.70 (13.49)
ONGC 99097000 73.55 100.00 (15.25)
NTPC 146683200 67.19 105.05 (8.25)
OIL 13959693 46.68 118.50 (15.84)
BEL 56442000 36.41 82.45 (19.05)
Weekly change in OI
Short Formation
Scrip
OI
Futures
OI
Chg (%)
Price
Price
Chg (%)
JUBLFOOD 2896500 2.71 1885.85 4.33
TECHM 15853200 2.79 806.85 2.50
HINDUNILVR 9556200 2.09 2078.75 0.26

3
For Private Circulation Only
Technical and Derivatives Review | February 01, 2020
Research Team Tel: 022 - 39357600 Website: www.angelbroking.com
For Technical Queries E-mail: technicalresearch-cso@angelbroking.com
For Derivatives Queries E-mail: derivatives.desk@angelbroking.com
DISCLAIMER
Angel Broking Limited (hereinafter referred to as “Angel”) is a registered Member of National Stock Exchange of India Limited, Bombay
Stock Exchange Limited and Metropolitan Stock Exchange Limited. It is also registered as a Depository Participant with CDSL and Portfolio
Manager and Investment Adviser with SEBI. It also has registration with AMFI as a Mutual Fund Distributor. Angel Broking Limited is a
registered entity with SEBI for Research Analyst in terms of SEBI (Research Analyst) Regulations, 2014 vide registration number
INH000000164. Angel or its associates has not been debarred/ suspended by SEBI or any other regulatory authority for accessing
/dealing in securities Market. Angel or its associates/analyst has not received any compensation / managed or co-managed public
offering of securities of the company covered by Analyst during the past twelve months.
This document is solely for the personal information of the recipient, and must not be singularly used as the basis of any investment
decision. Nothing in this document should be construed as investment or financial advice. Each recipient of this document should make
such investigations as they deem necessary to arrive at an independent evaluation of an investment in the securities of the companies
referred to in this document (including the merits and risks involved), and should consult their own advisors to determine the merits and
risks of such an investment.
Reports based on technical and derivative analysis center on studying charts of a stock's price movement, outstanding positions and
trading volume, as opposed to focusing on a company's fundamentals and, as such, may not match with a report on a company's
fundamentals. Investors are advised to refer the Fundamental and Technical Research Reports available on our website to evaluate the
contrary view, if any.
The information in this document has been printed on the basis of publicly available information, internal data and other reliable sources
believed to be true, but we do not represent that it is accurate or complete and it should not be relied on as such, as this document is for
general guidance only. Angel Broking Limited or any of its affiliates/ group companies shall not be in any way responsible for any loss or
damage that may arise to any person from any inadvertent error in the information contained in this report. Angel Broking Limited has
not independently verified all the information contained within this document. Accordingly, we cannot testify, nor make any
representation or warranty, express or implied, to the accuracy, contents or data contained within this document. While Angel Broking
Limited endeavors to update on a reasonable basis the information discussed in this material, there may be regulatory, compliance, or
other reasons that prevent us from doing so.
This document is being supplied to you solely for your information, and its contents, information or data may not be reproduced,
redistributed or passed on, directly or indirectly.
Neither Angel Broking Limited, nor its directors, employees or affiliates shall be liable for any loss or damage that may arise from or in
connection with the use of this information.
Technical and Derivatives Team:
Sameet Chavan Chief Analyst – Technical & Derivatives sameet.chavan@angelbroking.com
Ruchit Jain Technical Analyst ruchit.jain@angelbroking.com
Rajesh Bhosale Technical Analyst rajesh.bhosle@angelbroking.com
Sneha Seth Derivatives Analyst sneha.seth@angelbroking.com