October
10
, 2023
www.angelone.in
Technical & Derivatives Report
8
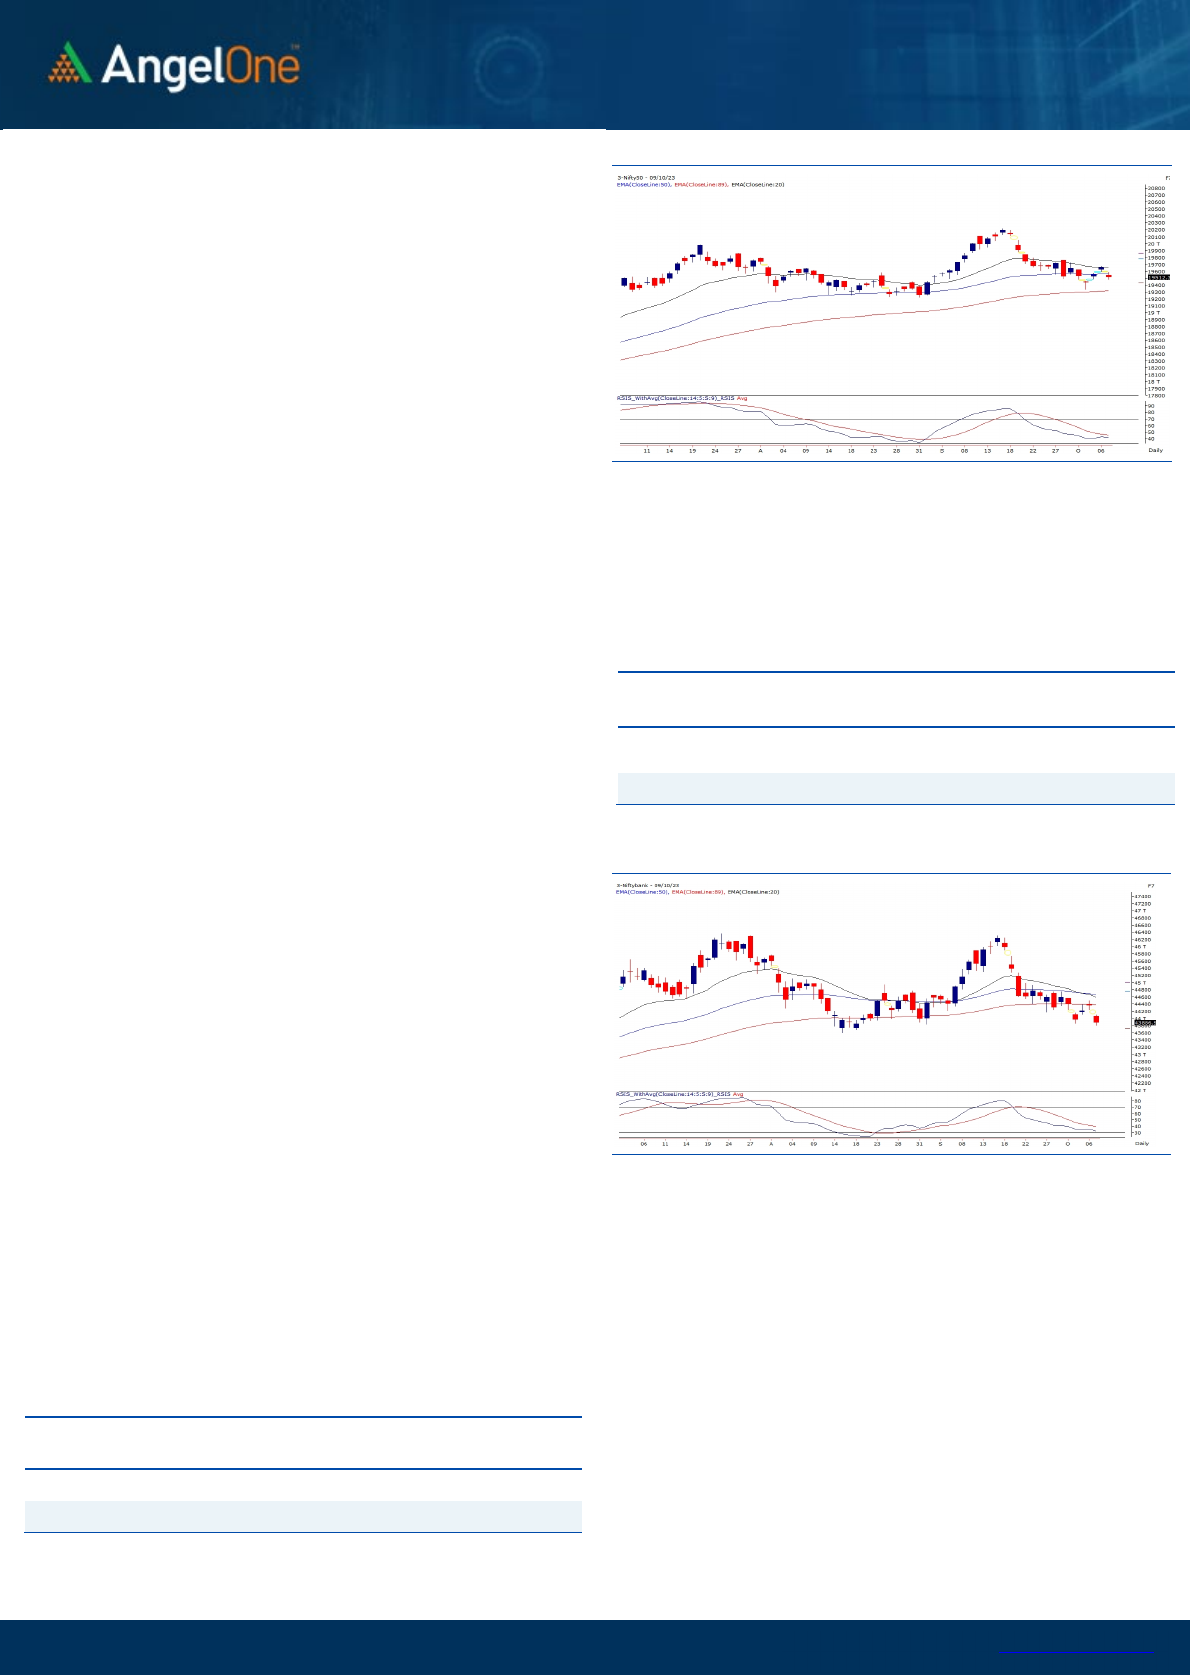
Nifty Bank Outlook (
4
3886
)
The high beta index started the week on a sluggish note with a gap-
down opening, taking cues from the rising global uncertainty over the
weekend. The Bank Nifty index had a nervous start and sneaked below
the previous week’s low at the early trades but later managed to hold
on to the losses and witnessed a choppy ride through the remaining
part of the session. With the strong sell-off, the Bank Nifty index
corrected nearly a percent to eventually settle below 43900 level.
Technically, the bears are being resilient in letting go of the grip from
their hands and with the recent price action, the weakness seems
eminent. On the levels front, 43850-43800 is the crucial zone to
adhere to and any breakdown on a closing basis could further disrupt
the price chart in the near term. The next potential pitstop could be
seen around 43500, followed by the 200 SMA of 43100 zone on an
immediate basis. On the higher end, 44200 withholds a crucial
resistance zone, followed by 44500 in the comparable period. During
such uncertainty, it is advisable to be cautious and avoid making
aggressive bets until trends get clarity.
Key Levels
Support 1 – 43800 Resistance 1 – 44200
Support 2 – 43500 Resistance 2 – 44500
Exhibit 1: Nifty Daily Chart
Exhibit 2: Nifty Bank Daily Chart
Sensex (
6
5
512
) / Nifty (
19
512
)
Over the weekend, fresh geopolitical concerns arose due to an attack
by the Palestinian militant group Hamas on Israel, causing
apprehensions in the global financial market. As a result, our markets
experienced a gap-down opening to start the week. Following this
initial weakness, there was an attempt to recover, but the intraday
bounce was met with selling pressure, leading the Nifty to conclude the
day with a 0.72% cut, ending a tad above the 19500 mark.
Last week, there was an effort to rebound from lower levels; however,
the move lacked substantial strength, prompting us to exercise caution
and avoid aggressive long positions. Presently, the markets are once
again feeling the pressure of emerging concerns in the background. On
the daily chart, we have observed a series of gaps over the past few
days. These gaps, occurring within a range, are categorized as common
gaps, typically seen when markets lack a clear trend direction. Our
assessment suggests that the markets are somewhat jittery, with last
week's prices encountering resistance near the short-term 20EMA
moving average, presently situated around 19650. This level can be
considered an immediate obstacle, and until we convincingly breach it,
it is advisable to refrain from aggressive long positions.
Conversely, the ongoing weakness may drive the Nifty lower,
potentially towards 19450 and then 19300 later in this week. While
yesterday's damage was relatively limited, traders are cautioned
against hastily entering aggressive positions, and it is advisable to let
the current market conditions settle before determining the next
directional trend.
Key Levels
Support 1 – 19450 Resistance 1 – 19590
Support 2 – 19300 Resistance 2 – 19650

www.angelone.in
Technical & Derivatives Report
October
10
,
2023
View
The Indian equity market had a tentative start due to
geopolitical concerns. Post the opening index made
an attempt of recovery to head towards the 19600
mark but failed to sustain at higher levels. Eventually,
we concluded with a cut of seven tenth of a percent.
FIIs were net sellers in the cash market segment to
the tune of Rs. 998 cr. Simultaneously, they sold
worth Rs. 290 cr in Index futures with a rise in open
interest, indicating short formation.
On the derivatives front, we hardly saw any fresh
build-up in key indices. FIIs continued with a selling
streak in equities and added few bearish bets in the
index futures segment. We observed massive build-
up on the call side particularly in the 19600-19800
strikes. On the flip side, the open interest activity
remained muted; however highest build-up remains
intact in 19500 put strike. Considering the above
data points, we would avoid any aggressive bets for
the time being and adopt wait and watch approach.
Comments
The Nifty futures open interest has decreased by 0.46%
and Bank Nifty futures open interest has decreased by
2.43% as the market closed at 19512.35.
The Nifty October future closed with a premium of 26.8
points against 25 points in the last trading session. The
November series closed at a premium of 143.30 points.
The INDIA VIX has increased from 10.30 to 11.40. At the
same time, the PCR-OI of Nifty has decreased from 1.12
to 1.04.
A few of the liquid counters where we have seen high
cost of carry are MOTHERSON, CROMPTON, CUB, BEL
and BIOCON.
Historical Volatility
SCRIP HV
GMRINFRA 44.06
VOLTAS 31.19
L&TFH 41.78
PETRONET 28.89
ADANIPORTS 49.27
Nifty Vs OI
19000
19200
19400
19600
19800
20000
20200
20400
20600
9,000
9,500
10,000
10,500
11,000
11,500
12,000
12,500
13,000
13,500
14,000
9-15 9-19 9-25 9-27 9-29 10-5
Openinterest Nifty
OI Gainers
SCRIP OI
OI
CHG. (%)
PRICE
PRICE
CHG. (%)
UBL 2777200 22.17 1564.00 -0.15
IPCALAB 1897350 12.40 936.10 -0.09
PERSISTENT 1265425 9.46 5595.75 -2.65
ATUL 461250 8.56 6884.70 -1.36
HEROMOTOCO 3983700 7.80 2955.10 -2.95
HCLTECH 11565400 6.92 1249.60 1.43
M&MFIN 44628000 6.31 285.65 -1.68
AUROPHARMA 16319600 6.24 911.10 1.12
OI Losers
SCRIP OI
OI
CHG. (%)
PRICE
PRICE
CHG. (%)
DELTACORP 17600 -9.54 141.65 2.86
SBILIFE 7166250 -8.56 1277.25 -0.61
BOSCHLTD 108400 -7.43 19255.65 -0.23
GRANULES 10088000 -6.70 355.80 -1.78
IGL 10993125 -6.02 460.45 -0.30
BAJAJFINSV 10719000 -5.82 1621.55 -0.94
PNB 276688000 -5.58 73.35 -4.55
LALPATHLAB 960300 -3.99 2479.15 0.12
Put-Call Ratio
SCRIP PCR (OI) PCR (VOL)
NIFTY 1.04 1.06
BANKNIFTY 0.73 0.88
RELIANCE 0.58 0.44
ICICIBANK 0.53 0.49
INFY 0.57 0.55

www.angelone.in
Technical & Derivatives Report
October
10
,
2023
Note: Above mentioned Bullish or Bearish Spreads in Nifty (Oct Series) are given as an information and not as a recommendation.
Nifty Spot =
19
512.35
FII Statistics for
October
0
9
, 2023
Detail Buy
Contracts
OI Value
(in Cr.)
Sell Net CHANGE
INDEX
FUTURES
2242.95 2533.25 (290.30) 187467 15417.05 2.62
INDEX
OPTIONS
964299.48 974644.52 (10345.04) 3295531 267228.67 8.30
STOCK
FUTURES
10842.71 11389.96 (547.25) 2405129 187339.68 (0.23)
STOCK
OPTIONS
18211.05 18458.48 (247.43) 179685 14392.03 7.84
Total
995596.19
1007026.21
(11430.02) 6067812
484377.43
4.57
Turnover on
October
0
9
, 2023
Instrument
No. of
Contracts
Turnover
(in Cr.)
Change
(%)
Index Futures
23348.38 23348.38
0.00
Index Options
177163339
37893.46
-18.28
Stock Futures
673337 56255.98
-9.27
Stock Options
3093934 4455.78 6.83
Total
30,93,934 4455.78 -10.26
Bull-Call Spreads
Action Strike Price Risk Reward BEP
Buy
19500 208.35
54.90
45.10
19554.90
Sell
19600 153.45
Buy
19500 208.35
101.20
98.80
19601.20
Sell
19700 107.15
Buy
19600 153.45
46.30 53.70 19646.30
Sell
19700 107.15
Bear-Put Spreads
Action Strike Price Risk Reward BEP
Buy
19500 167.95
36.60
63.40
19463.40
Sell 19400 131.35
Buy 19500 167.95
67.30
132.70
19432.70
Sell
19300 100.65
Buy
19400 131.35
30.70 69.30 19369.30
Sell 19300 100.65
Nifty Put
-
Call Analysis
,0
1000,000
2000,000
3000,000
4000,000
5000,000
6000,000
19000 19100 19200 19300 19400 19500 19600 19700 19800 19900 20000 20100 20200 20300
Call Put

www.angelone.in
Technical & Derivatives Report
October
10
,
2023
`
Daily Pivot Levels for Nifty Constituents
Scrips S2 S1 PIVOT R1 R2
ADANIENT 2,388 2,413 2,436 2,461 2,485
ADANIPORTS 763 776 797 810 831
APOLLOHOSP 4,952 4,996 5,031 5,075 5,110
ASIANPAINT 3,119 3,135 3,149 3,165 3,179
AXISBANK 983 990 995 1,001 1,006
BAJAJ-AUTO 4,899 4,953 5,011 5,065 5,123
BAJFINANCE 7,940 7,980 8,057 8,097 8,174
BAJAJFINSV 1,595 1,606 1,617 1,627 1,638
BPCL 334 337 339 343 345
BHARTIARTL 912 918 923 930 935
BRITANNIA 4,475 4,497 4,516 4,539 4,558
CIPLA 1,144 1,152 1,159 1,167 1,175
COALINDIA 281 284 286 290 292
DIVISLAB 3,616 3,661 3,729 3,773 3,841
DRREDDY 5,347 5,421 5,474 5,548 5,601
EICHERMOT 3,366 3,406 3,441 3,481 3,516
GRASIM 1,865 1,877 1,887 1,899 1,909
HCLTECH 1,214 1,232 1,249 1,267 1,285
HDFCBANK 1,501 1,509 1,519 1,527 1,537
HDFCLIFE 603 609 619 625 636
HEROMOTOCO 2,850 2,903 2,976 3,029 3,102
HINDALCO 460 465 469 474 478
HINDUNILVR 2,467 2,489 2,503 2,525 2,538
ICICIBANK 933 936 939 942 945
INDUSINDBK 1,393 1,411 1,428 1,446 1,463
INFY 1,447 1,461 1,476 1,490 1,505
ITC 434 437 440 443 446
JSW STEEL 744 751 756 763 768
KOTAKBANK 1,706 1,712 1,723 1,729 1,740
LT 3,041 3,056 3,070 3,085 3,100
LTIMINDTREE 5,144 5,175 5,205 5,236 5,265
M&M 1,496 1,506 1,523 1,533 1,551
MARUTI 10,104 10,174 10,254 10,325 10,405
NESTLEIND 22,707 22,794 22,888 22,975 23,068
NTPC 228 231 234 237 239
ONGC 179 181 183 184 186
POWERGRID 192 194 195 197 199
RELIANCE 2,284 2,289 2,301 2,306 2,318
SBILIFE 1,264 1,275 1,283 1,294 1,302
SBIN 578 581 585 589 592
SUNPHARMA 1,096 1,108 1,121 1,133 1,146
TCS 3,600 3,616 3,648 3,664 3,696
TATACONSUM
860 869 877 886 894
TATAMOTORS 609 613 618 622 626
TATASTEEL 121 122 124 125 126
TECHM 1,188 1,199 1,213 1,225 1,239
TITAN 3,224 3,246 3,271 3,293 3,318
ULTRACEMCO 8,017 8,060 8,130 8,173 8,243
UPL 593 601 606 614 619
WIPRO 399 402 406 409 414

www.angelone.in
Technical & Derivatives Report
October
10
,
2023
Technical and Derivatives Team:
Sameet Chavan Head Research – Technical & Derivatives sameet.chavan@angelone.in
Sneha Seth Senior Analyst – Technical & Derivatives sneha.seth@angelone.in
Rajesh Bhosale Analyst - Technical rajesh.bhosle@angelone.in
Osho Krishan Senior Analyst – Technical & Derivatives osho.krishan@angelone.in
Hitesh Rathi Analyst – Technical & Derivatives hitesh.rathi@angelone.in
Research Team Tel: 022 – 39357600 Website: www.angelone.in
For Technical Queries E-mail: technicalresearch-cso@angelone.in
For Derivatives Queries E-mail: derivatives.desk@angelone.in
DISCLAIMER
We, Angel One Limited (hereinafter referred to as “Angel”) a company duly incorporated under the provisions of the Companies Act, 1956 with
its registered office at 601, 6th Floor, Ackruti Star, Central Road, MIDC, Andheri East, Mumbai – 400093, CIN: (L67120MH1996PLC101709) and
duly registered as a member of National Stock Exchange of India Limited, Bombay Stock Exchange Limited, Metropolitan Stock Exchange Limited,
Multi Commodity Exchange of India Ltd and National Commodity & Derivatives Exchange Ltd. Angel One limited is a company engaged in
diversified financial services business including securities broking, DP services, distribution of Mutual Fund products. It is also registered as a
Depository Participant with CDSL and Portfolio Manager and Investment Adviser with SEBI. It also has registration with AMFI as a Mutual Fund
Distributor. Angel One Limited is a registered entity with SEBI for Research Analyst in terms of SEBI (Research Analyst) Regulations, 2014 vide
registration number INH000000164 and also registered with PFRDA as PoP ,Registration No.19092018. Angel Group does not have any joint
ventures or associates. Angel One Limited is the ultimate parent company of the Group. Angel or its associates has not been debarred/ suspended
by SEBI or any other regulatory authority for accessing /dealing in securities Market.
AOL was merged with Angel Global Capital Private Limited and subsequently name of Angel Global Capital Private Limited was changed to Angel
Broking Private Limited (AOL) pursuant to scheme of Amalgamation sanctioned by the Hon'ble High Court of Judicature at Bombay by Orders
passed in Company Petition No 710 of 2011 and the approval granted by the Registrar of Companies. Further, name of Angel Broking Private
Limited again got changed to Angel Broking Limited (AOL) pursuant to fresh certificate of incorporation issued by Registrar of Companies (ROC)
dated June 28, 2018. Further name of Angel Broking name changed to Angel One Ltd pursuant to fresh certificate of incorporation issued by
Registrar of Companies (ROC) dated 23-09-21.
In case of any grievances please write to: support@angelone.in, Compliance Officer Details: Name : Hiren Thakkar, Tel No. –08657864228, Email
id - compliance@angelone.in
Registration granted by SEBI and certification from NISM in no way guarantee performance of the intermediary or provide any assurance of returns
to investors.
This document is solely for the personal information of the recipient, and must not be singularly used as the basis of any investment decision.
Nothing in this document should be construed as investment or financial advice. Each recipient of this document should make such investigations
as they deem necessary to arrive at an independent evaluation of an investment in the securities of the companies referred to in this document
(including the merits and risks involved), and should consult their own advisors to determine the merits and risks of such an investment.
Angel or its associates or research analyst or his relative may have actual/beneficial ownership of 1% or more in the securities of the subject
company at the end of the month immediately preceding the date of publication of the research report. Neither Angel or its associates nor
Research Analysts or his relative has any material conflict of interest at the time of publication of research report.
Angel or its associates might have received any compensation from the companies mentioned in the report during the period preceding twelve
months from the date of this report for services in respect of managing or co-managing public offerings, corporate finance, investment banking or
merchant banking, brokerage services or other advisory service in a merger or specific transaction in the normal course of business. Angel or its
associates did not receive any compensation or other benefits from the companies mentioned in the report or third party in connection with the
research report. Neither research entity nor research analyst has been engaged in market making activity for the subject company.

www.angelone.in
Technical & Derivatives Report
October
10
,
2023
*
Reports based on technical and derivative analysis center on studying charts of a stock's price movement, outstanding positions and trading
volume, as opposed to focusing on a company's fundamentals and, as such, may not match with a report on a company's fundamentals. Investors
are advised to refer the Fundamental and Technical Research Reports available on our website to evaluate the contrary view, if any.
The information in this document has been printed on the basis of publicly available information, internal data and other reliable sources believed
to be true, but we do not represent that it is accurate or complete and it should not be relied on as such, as this document is for general guidance
only. Angel One Limited or any of its affiliates/ group companies shall not be in any way responsible for any loss or damage that may arise to any
person from any inadvertent error in the information contained in this report. Angel One Limited does not warrant the accuracy, adequacy or
completeness of the service, information and materials and expressly disclaims liability for errors or omissions in the service, information and
materials. While Angel One Limited endeavours to update on a reasonable basis the information discussed in this material, there may be
regulatory, compliance, or other reasons that prevent us from doing so.
This document is being supplied to you solely for your information, and its contents, information or data may not be reproduced, redistributed or
passed on, directly or indirectly.
Neither Angel One Limited, nor its directors, employees or affiliates shall be liable for any loss or damage that may arise from or in connection
with the use of this information. Angel or its associates or Research Analyst or his relative might have financial interest in the subject company.
Research analyst has not served as an officer, director or employee of the subject company.
Investment in securities market are subject to market risks. Read all the related documents carefully before investing.
Any communication sent to clients on phone numbers or e-mail ids registered with the Trading Member is meant for client consumption and such
material should not be redistributed. Brokerage will not exceed SEBI prescribed limit. Any Information provided by us through any medium based
on our research or that of our affiliates or third parties or other external sources is subject to domestic and international market conditions and
we do not guarantee the availability or otherwise of any securities or other instruments and such Information is merely an estimation of certain
investments, and we have not and shall not be deemed to have assumed any responsibility for any such Information. You should seek independent
professional advice and/or tax advice regarding the suitability of any investment decision whether based on any Information provided by us
through the Site from inhouse research or third party reports or otherwise.
The report and information contained herein is strictly confidential and meant solely for the selected recipient and may not be altered in any way,
transmitted to, copied or distributed, in part or in whole, to any other person or to the media or reproduced in any form, without prior written
consent.
