October
0
6
, 2023
www.angelone.in
Technical & Derivatives Report
8
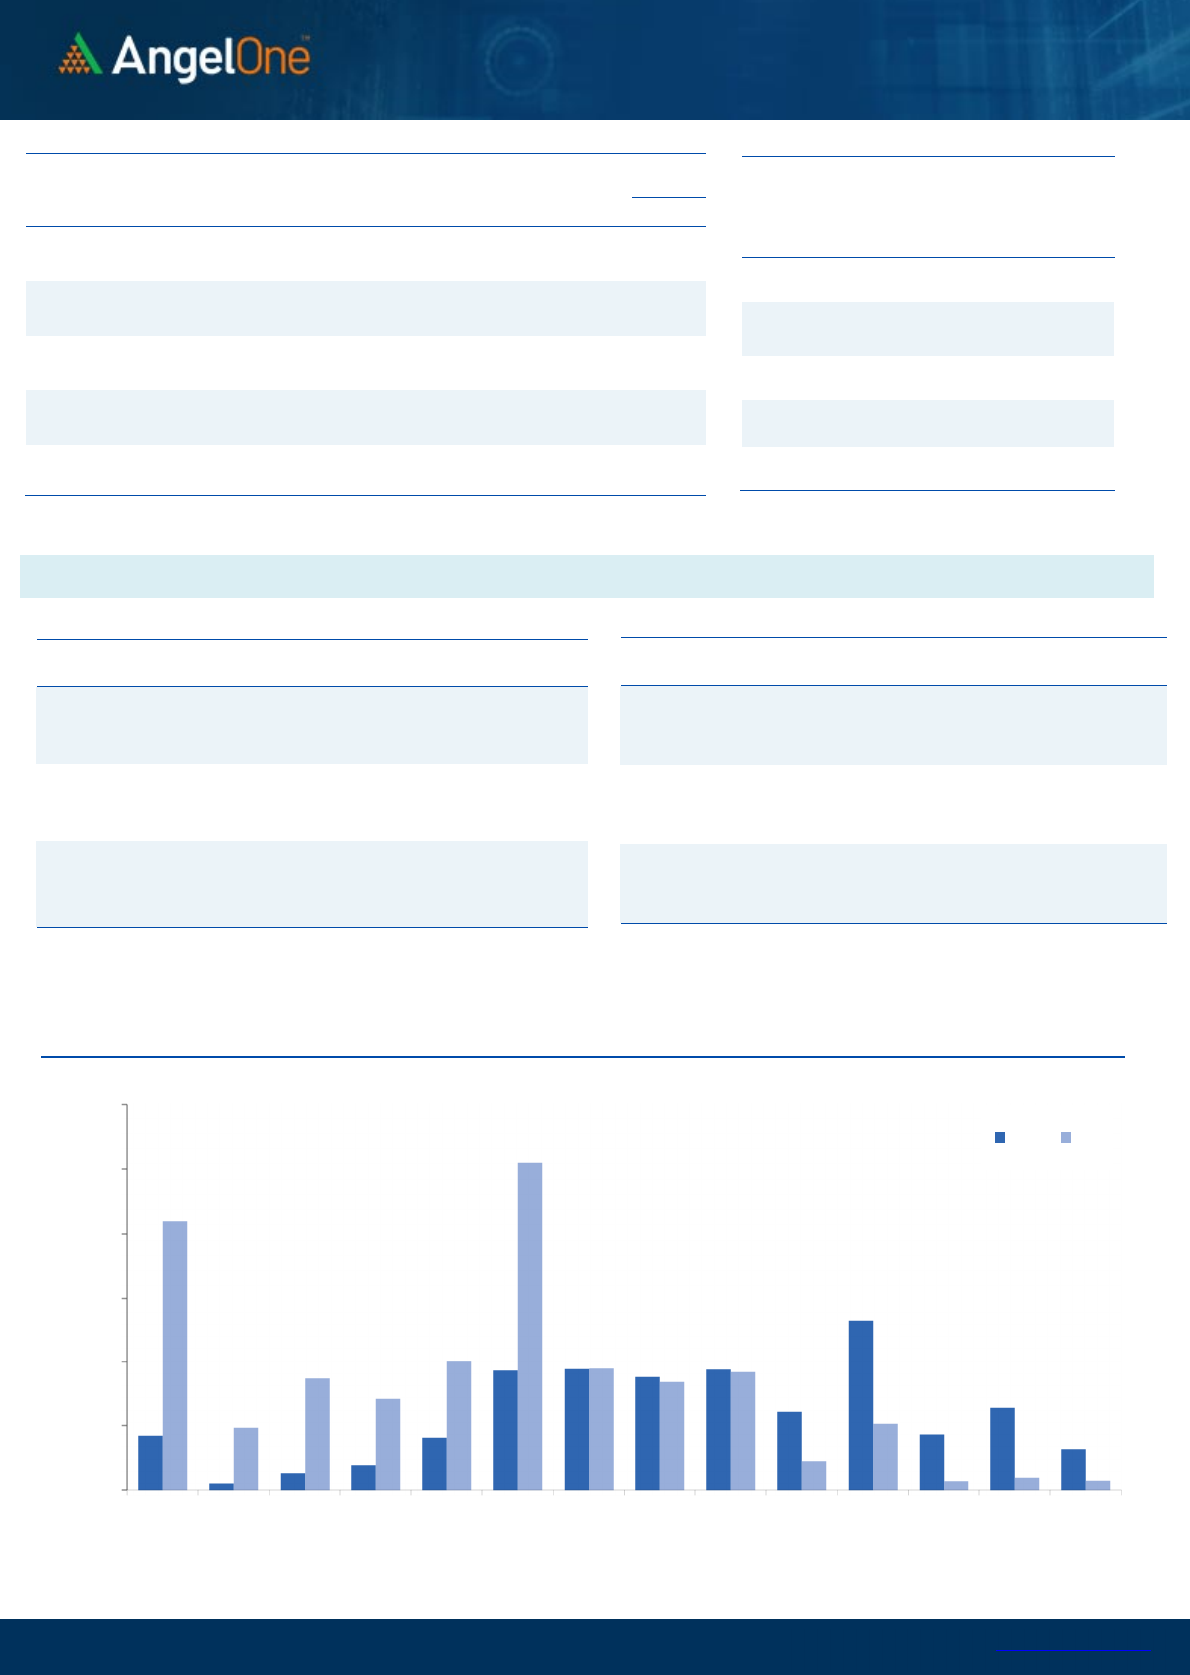
Nifty Bank Outlook (
44213
)
Ahead of the key RBI Policy announcement, there was a brief relief in
this sector following a recent period of turmoil. Prices opened
significantly higher than the previous session's high, but the day was
marked by erratic movements within a certain range. Eventually, the
Bank Nifty closed just above the opening levels, recording gains of
slightly over half a percent, closing a tad above 44200.
Yesterday’s price structure appears uncertain in anticipation of the
important policy announcement, as indicated by the small-bodied
candle on the daily chart. Despite a strong initial opening, the high-
beta index remained cautious at higher levels and refrained from
breaching the precise 89EMA resistance. On the day of the policy
release, the low point reached on Wednesday, around 43800, holds
great significance. It is expected that any decline towards this level will
likely attract buyers, given that it coincides with the September
month's lowest point, from where a robust rally originated.
Consequently, this level is considered sacred. A breach below this level
could potentially trigger further short-term weakness, leading to levels
between 43500 and 43300 in the near term. On the flip side, resistance
levels are placed at regular intervals.
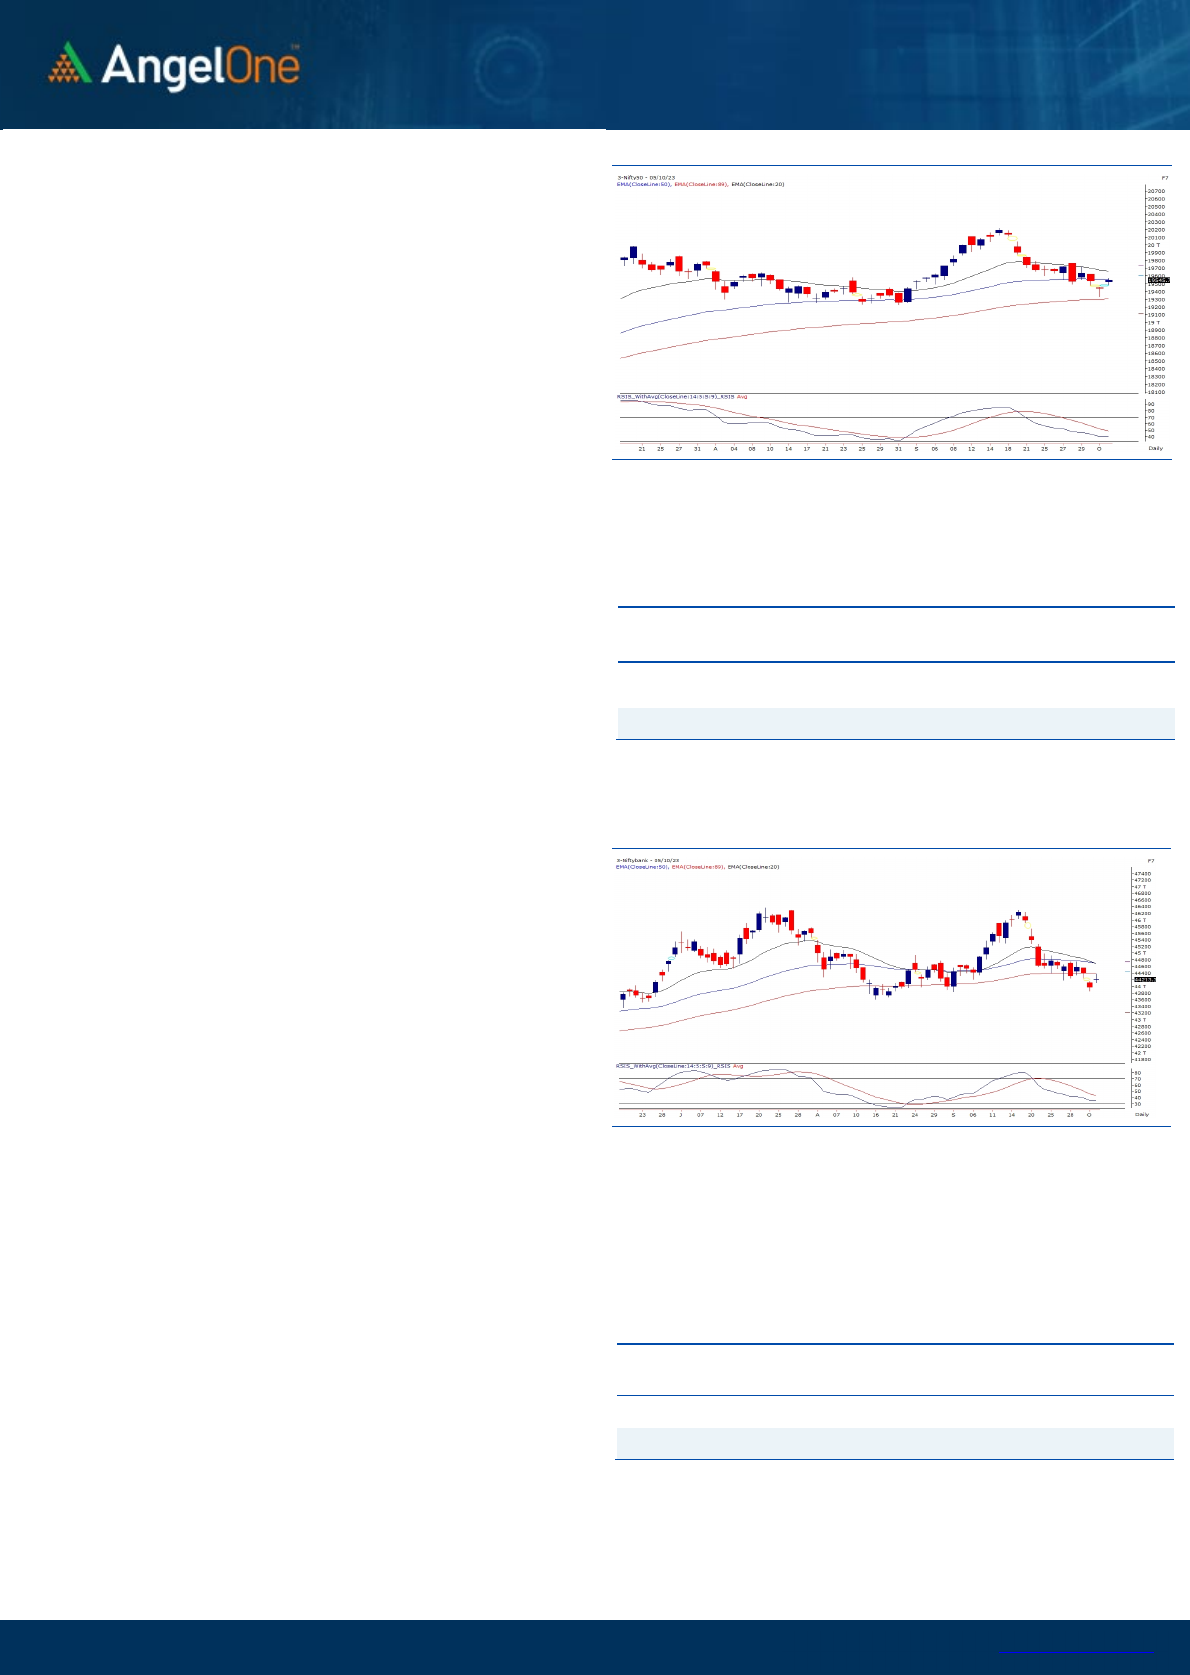
Exhibit 1: Nifty Daily Chart
Exhibit 2: Nifty Bank Daily Chart
Sensex (
6
5
632
) / Nifty (
19
546
)
Our market has seen a smart rebound after the improved global
sentiments, wherein the benchmark index started the weekly expiry
session with a gap-up and maintained the stature throughout the day.
Post the initial hiccup, there has been no sign of bearishness in the
index, and eventually, the Nifty50 index snapped its two days hefty
selling streak and concluded the day around 19550 levels, procuring
0.56 percent.
On the daily chart, the index has formed an island bar formation and a
follow-up buying could construe a positive development for the bulls of
D-Street. However, we aren’t entirely out of the woods and need to
keep a close tab on global developments along with the upcoming RBI
monetary policy outcome, which could direct the near-term trend for
our markets. On the levels front, a series of support could be seen from
19500-19450, followed by the sacrosanct support of the recent swing
low around 19300. While on the higher end, the 19700 zone remains
to act as a formidable hurdle.
We expect the consolidation phase to continue till any breakthrough
of the aforementioned range is not seen in Nifty. Also, one needs to
avoid complacency and stay fussy with stock selection until the
trends get clarity.
Key Levels
Support 1 – 19450 Resistance 1 – 19650
Support 2 – 19400 Resistance 2 – 19700
However, on the policy day, the range of 44500 to 44800 is viewed
as a formidable barrier. All eyes are on the crucial RBI policy decision
and the subsequent commentary, as it is expected to dictate the
short-term trend. It is advisable for traders to wait for confirmation
before engaging in aggressive trading bets.
Key Levels
Support 1 – 44000 Resistance 1 – 44500
Support 2 – 43800 Resistance 2 – 44800

www.angelone.in
Technical & Derivatives Report
October
0
6
,
2023
View
The Indian equity market witnessed a cheerful start.
As the day progressed, fresh buying emerged in the
initial two hours to test 19550 but the index
remained tentative at the higher levels thereafter to
eventually end the day tad above 19500.
FIIs were net sellers in the cash market segment to
the tune of Rs. 1864 cr. Simultaneously, they bought
worth Rs. 524 cr in Index futures with marginal
change in open interest, indicating blend of short
covering and long formation.
We observed the addition of bullish bets in Nifty and
the banking index witnessed a short covering move.
On the options front, the build-up remained
scattered for both call and put options for the
coming weekly series. However, 19500 put and
19600 call strikes hold maximum open interest
concentration. Meanwhile, the selling streak from
stronger hands continues in the cash but
interestingly the covered shorts and added a few
bullish bets index future segment. Yesterday’s
recovery was encouraging but any move beyond
19600 will be important to watch out for now.
Comments
The Nifty futures open interest has increased by 6.31%
and Bank Nifty futures open interest has decreased by
4.05% as the market closed at 19545.75.
The Nifty October future closed with a premium of
22.25 points against 33.15 points in the last trading
session. The November series closed at a premium of
143.40 points.
The INDIA VIX has decreased from 11.66 to 10.94. At
the same time, the PCR-OI of Nifty has remained
unchanged at 0.96.
A few of the liquid counters where we have seen high
cost of carry are IDEA, GMRINFRA, CANFINHOME,
SHRIRAMFIN and INDIACEM.
Historical Volatility
SCRIP HV
MARICO 27.28
SUNTV 34.33
INDIGO 34.78
BSOFT 44.02
NAUKRI 40.33
Nifty Vs OI
19000
19200
19400
19600
19800
20000
20200
20400
20600
9,000
9,500
10,000
10,500
11,000
11,500
12,000
12,500
13,000
13,500
14,000
9-14 9-18 9-21 9-26 9-28 10-3
Openinterest Nifty
OI Gainers
SCRIP OI
OI
CHG. (%)
PRICE
PRICE
CHG. (%)
COROMANDEL 1428700 13.52 1166.10 2.34
OBEROIRLTY 7613200 10.91 1091.05 -2.57
MFSL 9005600 9.65 911.90 3.10
DALBHARAT 1639000 9.16 2258.15 -2.04
MARICO 12949200 8.15 542.45 -5.06
SUNTV 9153000 7.92 634.15 3.63
LAURUSLABS 13081500 7.85 394.65 0.70
DIXON 1301000 7.79 5148.10 -1.28
OI Losers
SCRIP OI
OI
CHG. (%)
PRICE
PRICE
CHG. (%)
MCX 17600 -7.63 1949.25 0.99
HINDUNILVR 8962800 -6.11 2519.60 0.29
ULTRACEMCO 1739900 -5.47 8177.00 0.49
EICHERMOT 3274250 -4.85 3443.35 1.07
BAJFINANCE 4039500 -4.43 7850.85 0.11
SBIN 91038000 -4.42 592.15 1.23
DELTACORP 14333200 -4.28 136.65 0.11
MGL 2669600 -4.03 1113.30 -0.93
Put-Call Ratio
SCRIP PCR (OI) PCR (VOL)
NIFTY 0.96 0.98
BANKNIFTY 0.84 0.88
RELIANCE 0.59 0.36
ICICIBANK 0.51 0.42
INFY 0.54 0.38
www.angelone.in
Technical & Derivatives Report
October
0
6
,
2023
Note: Above mentioned Bullish or Bearish Spreads in Nifty (Oct Series) are given as an information and not as a recommendation.
Nifty Spot =
19
545.75
FII Statistics for
October
0
5
, 2023
Detail Buy
Contracts
OI Value
(in Cr.)
Sell Net
CHANGE
INDEX
FUTURES
4945.03
4421.04
523.99
186943
15525.05
(0.26)
INDEX
OPTIONS
1334273.00
1403713.61
(69440.61) 2389713
197461.80
(20.06)
STOCK
FUTURES
16117.74
14616.54
1501.20
2405375
188168.81
(1.84)
STOCK
OPTIONS
16885.80
16738.84
146.96
158295
12825.84
4.70
Total
1372221.57
1439490.03
(67268.46) 5140326
413981.50
(11.04)
Turnover on
October
0
5
, 2023
Instrument
No. of
Contracts
Turnover
(in Cr.)
Change
(%)
Index Futures
348846 27310.96
45.07
Index Options
591705009
51425.16
19.64
Stock Futures
978138 79513.77
25.02
Stock Options
3413309 4798.44 10.55
Total
34,13,309 4798.44 25.66
Bull-Call Spreads
Action Strike Price Risk Reward BEP
Buy
19600 169.70
46.10
53.90
19646.10
Sell
19700 123.60
Buy
19600 169.70
82.90
117.10
19682.90
Sell
19800 86.80
Buy
19700 123.60
36.80 63.20 19736.80
Sell
19800 86.80
Bear-Put Spreads
Action Strike Price Risk Reward BEP
Buy
19500 161.50
36.85
63.15
19463.15
Sell 19400 124.65
Buy 19500 161.50
66.80
133.20
19433.20
Sell
19300 94.70
Buy
19400 124.65
29.95 70.05 19370.05
Sell 19300 94.70
Nifty Put
-
Call Analysis
,0
1000,000
2000,000
3000,000
4000,000
5000,000
6000,000
19000 19100 19200 19300 19400 19500 19600 19700 19800 19900 20000 20100 20200 20300
Call Put

www.angelone.in
Technical & Derivatives Report
October
0
6
,
2023
`
Daily Pivot Levels for Nifty Constituents
Scrips S2 S1 PIVOT R1 R2
ADANIENT 2,426 2,446 2,466 2,486 2,507
ADANIPORTS 814 820 826 831 838
APOLLOHOSP 4,998 5,023 5,051 5,076 5,104
ASIANPAINT 3,146 3,176 3,204 3,234 3,262
AXISBANK 980 992 1,000 1,012 1,021
BAJAJ-AUTO 4,878 4,944 4,992 5,059 5,106
BAJFINANCE 7,776 7,814 7,864 7,902 7,952
BAJAJFINSV 1,520 1,531 1,544 1,555 1,567
BPCL 340 342 345 347 350
BHARTIARTL 916 922 926 933 936
BRITANNIA 4,479 4,507 4,527 4,555 4,576
CIPLA 1,145 1,153 1,163 1,171 1,181
COALINDIA 281 285 288 292 295
DIVISLAB 3,635 3,666 3,686 3,717 3,736
DRREDDY 5,352 5,380 5,427 5,455 5,502
EICHERMOT 3,361 3,402 3,428 3,469 3,495
GRASIM 1,865 1,878 1,893 1,906 1,921
HCLTECH 1,213 1,224 1,239 1,250 1,265
HDFCBANK 1,521 1,528 1,540 1,547 1,559
HDFCLIFE 616 620 624 628 632
HEROMOTOCO 2,964 2,990 3,020 3,046 3,075
HINDALCO 460 465 474 479 488
HINDUNILVR 2,484 2,502 2,513 2,531 2,543
ICICIBANK 930 936 940 945 949
INDUSINDBK 1,383 1,392 1,404 1,413 1,425
INFY 1,438 1,451 1,463 1,476 1,489
ITC 432 434 437 439 443
JSW STEEL 747 751 757 761 767
KOTAKBANK 1,708 1,721 1,734 1,747 1,760
LT 2,999 3,047 3,081 3,130 3,164
LTIMINDTREE 5,166 5,196 5,226 5,256 5,285
M&M 1,496 1,517 1,534 1,555 1,572
MARUTI 10,035 10,122 10,197 10,284 10,359
NESTLEIND 22,601 22,760 22,934 23,092 23,266
NTPC 229 231 234 237 240
ONGC 179 181 182 184 185
POWERGRID 193 195 197 199 201
RELIANCE 2,297 2,306 2,318 2,326 2,338
SBILIFE 1,257 1,266 1,274 1,283 1,291
SBIN 584 588 591 595 598
SUNPHARMA 1,103 1,111 1,120 1,128 1,137
TCS 3,515 3,552 3,588 3,625 3,661
TATACONSUM
851 855 862 867 874
TATAMOTORS 612 616 619 622 625
TATASTEEL 124 124 125 126 127
TECHM 1,185 1,195 1,210 1,220 1,234
TITAN 3,138 3,177 3,204 3,243 3,270
ULTRACEMCO 8,087 8,132 8,170 8,216 8,254
UPL 598 601 605 609 613
WIPRO 402 404 407 410 413

www.angelone.in
Technical & Derivatives Report
October
0
6
,
2023
Technical and Derivatives Team:
Sameet Chavan Head Research – Technical & Derivatives sameet.chavan@angelone.in
Sneha Seth Senior Analyst – Technical & Derivatives sneha.seth@angelone.in
Rajesh Bhosale Analyst - Technical rajesh.bhosle@angelone.in
Osho Krishan Senior Analyst – Technical & Derivatives osho.krishan@angelone.in
Hitesh Rathi Analyst – Technical & Derivatives hitesh.rathi@angelone.in
Research Team Tel: 022 – 39357600 Website: www.angelone.in
For Technical Queries E-mail: technicalresearch-cso@angelone.in
For Derivatives Queries E-mail: derivatives.desk@angelone.in
DISCLAIMER
We, Angel One Limited (hereinafter referred to as “Angel”) a company duly incorporated under the provisions of the Companies Act, 1956 with
its registered office at 601, 6th Floor, Ackruti Star, Central Road, MIDC, Andheri East, Mumbai – 400093, CIN: (L67120MH1996PLC101709) and
duly registered as a member of National Stock Exchange of India Limited, Bombay Stock Exchange Limited, Metropolitan Stock Exchange Limited,
Multi Commodity Exchange of India Ltd and National Commodity & Derivatives Exchange Ltd. Angel One limited is a company engaged in
diversified financial services business including securities broking, DP services, distribution of Mutual Fund products. It is also registered as a
Depository Participant with CDSL and Portfolio Manager and Investment Adviser with SEBI. It also has registration with AMFI as a Mutual Fund
Distributor. Angel One Limited is a registered entity with SEBI for Research Analyst in terms of SEBI (Research Analyst) Regulations, 2014 vide
registration number INH000000164 and also registered with PFRDA as PoP ,Registration No.19092018. Angel Group does not have any joint
ventures or associates. Angel One Limited is the ultimate parent company of the Group. Angel or its associates has not been debarred/ suspended
by SEBI or any other regulatory authority for accessing /dealing in securities Market.
AOL was merged with Angel Global Capital Private Limited and subsequently name of Angel Global Capital Private Limited was changed to Angel
Broking Private Limited (AOL) pursuant to scheme of Amalgamation sanctioned by the Hon'ble High Court of Judicature at Bombay by Orders
passed in Company Petition No 710 of 2011 and the approval granted by the Registrar of Companies. Further, name of Angel Broking Private
Limited again got changed to Angel Broking Limited (AOL) pursuant to fresh certificate of incorporation issued by Registrar of Companies (ROC)
dated June 28, 2018. Further name of Angel Broking name changed to Angel One Ltd pursuant to fresh certificate of incorporation issued by
Registrar of Companies (ROC) dated 23-09-21.
In case of any grievances please write to: support@angelone.in, Compliance Officer Details: Name : Hiren Thakkar, Tel No. –08657864228, Email
id - compliance@angelone.in
Registration granted by SEBI and certification from NISM in no way guarantee performance of the intermediary or provide any assurance of returns
to investors.
This document is solely for the personal information of the recipient, and must not be singularly used as the basis of any investment decision.
Nothing in this document should be construed as investment or financial advice. Each recipient of this document should make such investigations
as they deem necessary to arrive at an independent evaluation of an investment in the securities of the companies referred to in this document
(including the merits and risks involved), and should consult their own advisors to determine the merits and risks of such an investment.
Angel or its associates or research analyst or his relative may have actual/beneficial ownership of 1% or more in the securities of the subject
company at the end of the month immediately preceding the date of publication of the research report. Neither Angel or its associates nor
Research Analysts or his relative has any material conflict of interest at the time of publication of research report.
Angel or its associates might have received any compensation from the companies mentioned in the report during the period preceding twelve
months from the date of this report for services in respect of managing or co-managing public offerings, corporate finance, investment banking or
merchant banking, brokerage services or other advisory service in a merger or specific transaction in the normal course of business. Angel or its
associates did not receive any compensation or other benefits from the companies mentioned in the report or third party in connection with the
research report. Neither research entity nor research analyst has been engaged in market making activity for the subject company.

www.angelone.in
Technical & Derivatives Report
October
0
6
,
2023
*
Reports based on technical and derivative analysis center on studying charts of a stock's price movement, outstanding positions and trading
volume, as opposed to focusing on a company's fundamentals and, as such, may not match with a report on a company's fundamentals. Investors
are advised to refer the Fundamental and Technical Research Reports available on our website to evaluate the contrary view, if any.
The information in this document has been printed on the basis of publicly available information, internal data and other reliable sources believed
to be true, but we do not represent that it is accurate or complete and it should not be relied on as such, as this document is for general guidance
only. Angel One Limited or any of its affiliates/ group companies shall not be in any way responsible for any loss or damage that may arise to any
person from any inadvertent error in the information contained in this report. Angel One Limited does not warrant the accuracy, adequacy or
completeness of the service, information and materials and expressly disclaims liability for errors or omissions in the service, information and
materials. While Angel One Limited endeavours to update on a reasonable basis the information discussed in this material, there may be
regulatory, compliance, or other reasons that prevent us from doing so.
This document is being supplied to you solely for your information, and its contents, information or data may not be reproduced, redistributed or
passed on, directly or indirectly.
Neither Angel One Limited, nor its directors, employees or affiliates shall be liable for any loss or damage that may arise from or in connection
with the use of this information. Angel or its associates or Research Analyst or his relative might have financial interest in the subject company.
Research analyst has not served as an officer, director or employee of the subject company.
Investment in securities market are subject to market risks. Read all the related documents carefully before investing.
Any communication sent to clients on phone numbers or e-mail ids registered with the Trading Member is meant for client consumption and such
material should not be redistributed. Brokerage will not exceed SEBI prescribed limit. Any Information provided by us through any medium based
on our research or that of our affiliates or third parties or other external sources is subject to domestic and international market conditions and
we do not guarantee the availability or otherwise of any securities or other instruments and such Information is merely an estimation of certain
investments, and we have not and shall not be deemed to have assumed any responsibility for any such Information. You should seek independent
professional advice and/or tax advice regarding the suitability of any investment decision whether based on any Information provided by us
through the Site from inhouse research or third party reports or otherwise.
The report and information contained herein is strictly confidential and meant solely for the selected recipient and may not be altered in any way,
transmitted to, copied or distributed, in part or in whole, to any other person or to the media or reproduced in any form, without prior written
consent.
