October
0
5
, 2023
www.angelone.in
Technical & Derivatives Report
8
Nifty Bank Outlook (
4
3964
)
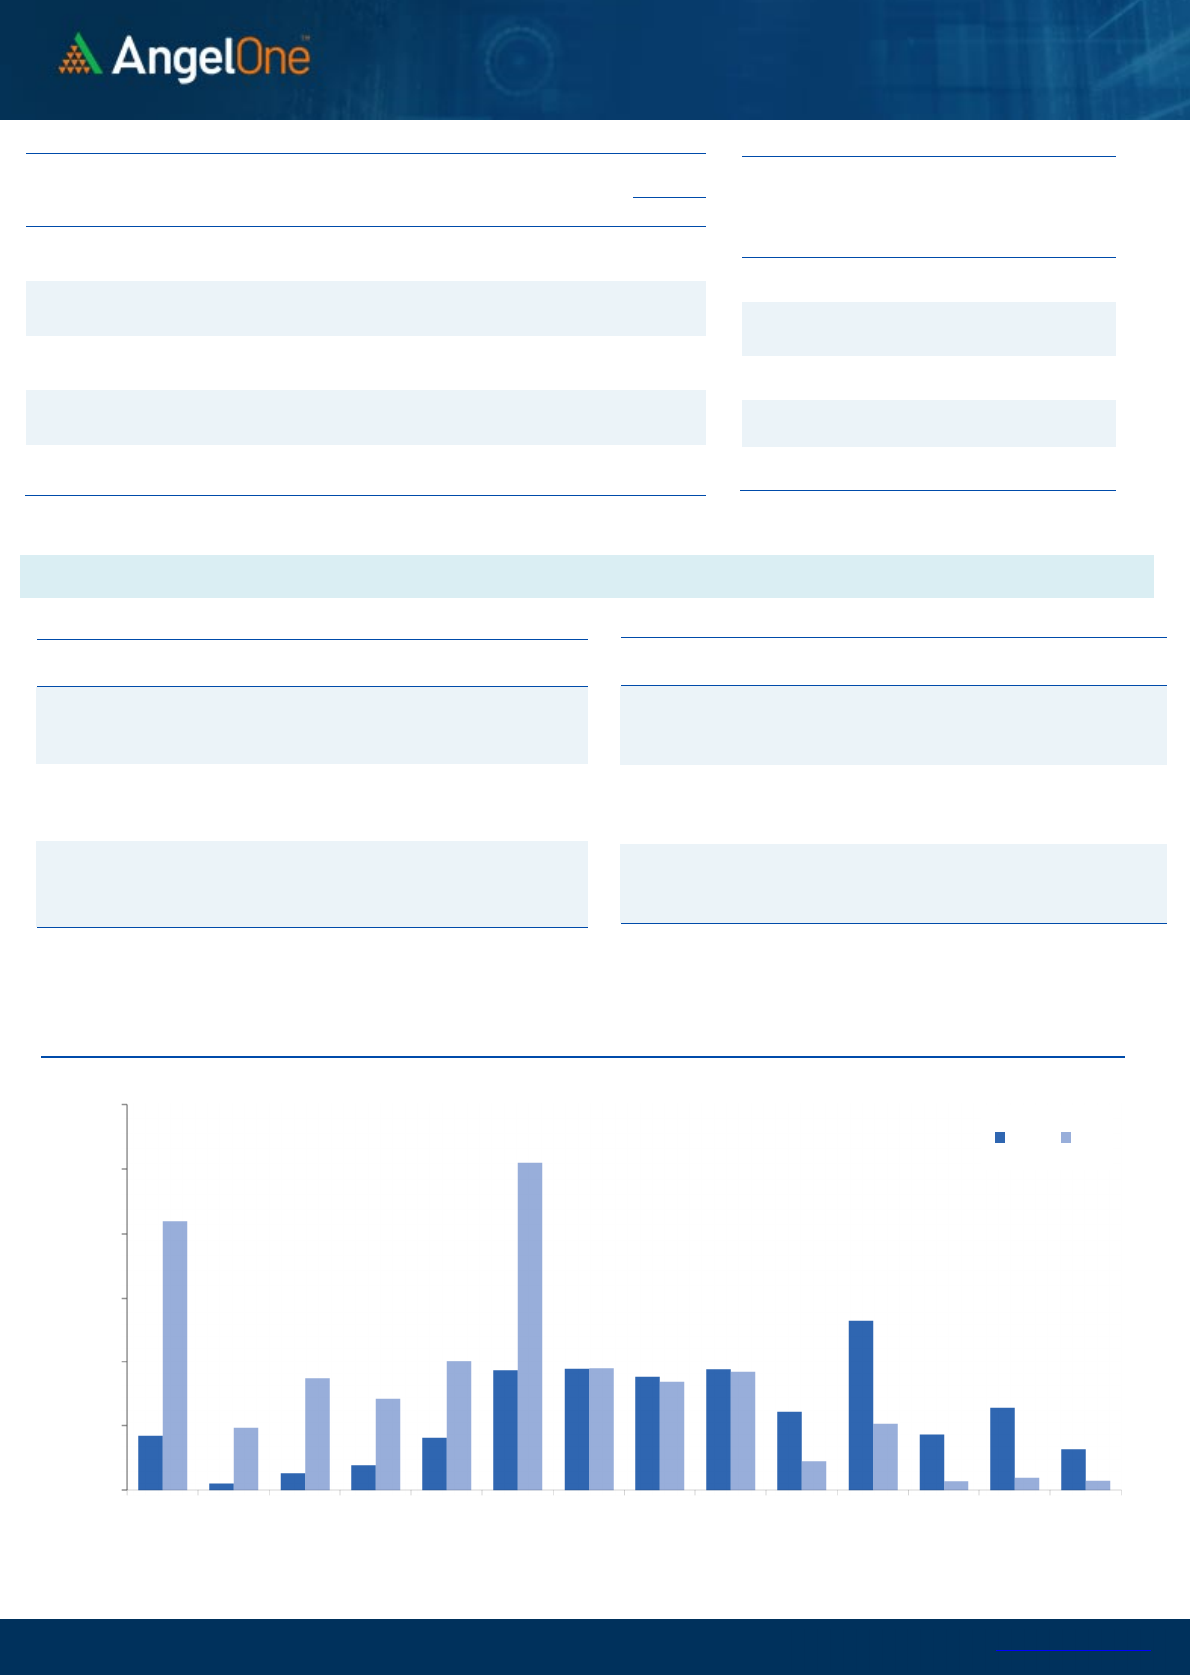
Bank Nifty experienced a gap-down opening, which was followed by
an extended selling pressure in the initial trading hour. However, after
that initial decline, Bank Nifty, much like the previous session, traded
within a specific range for the remaining part of the session, eventually
closing down by around a percent, tad below the 44000 mark.
The bearish sentiment remains strong, with Bank Nifty shedding over
2000 points in just 11 trading sessions from its recent all time high.
During this downward move, price levels broke through several
support levels with ease, catching traders on back foot who were
expecting a rebound off those support levels. Notably, we are now
observing a second bearish gap in this decline, signalling that bearish
momentum is still prevalent. The next crucial support levels to monitor
are in the range of 43500 - 43300, as these levels have served as a
foundational support since the May month. Given the oversold
conditions on hourly indicators and the upcoming RBI policy
announcement, these support zones should ideally act as significant
points for potential bullish reversals in the coming sessions. On the
contrary, due to the rapid descent in prices, there will likely be strong
resistance levels at regular intervals. However, immediate key
resistance can be noted around the bearish gap left yesterday at
44250, followed by the 89-day EMA at 44400.
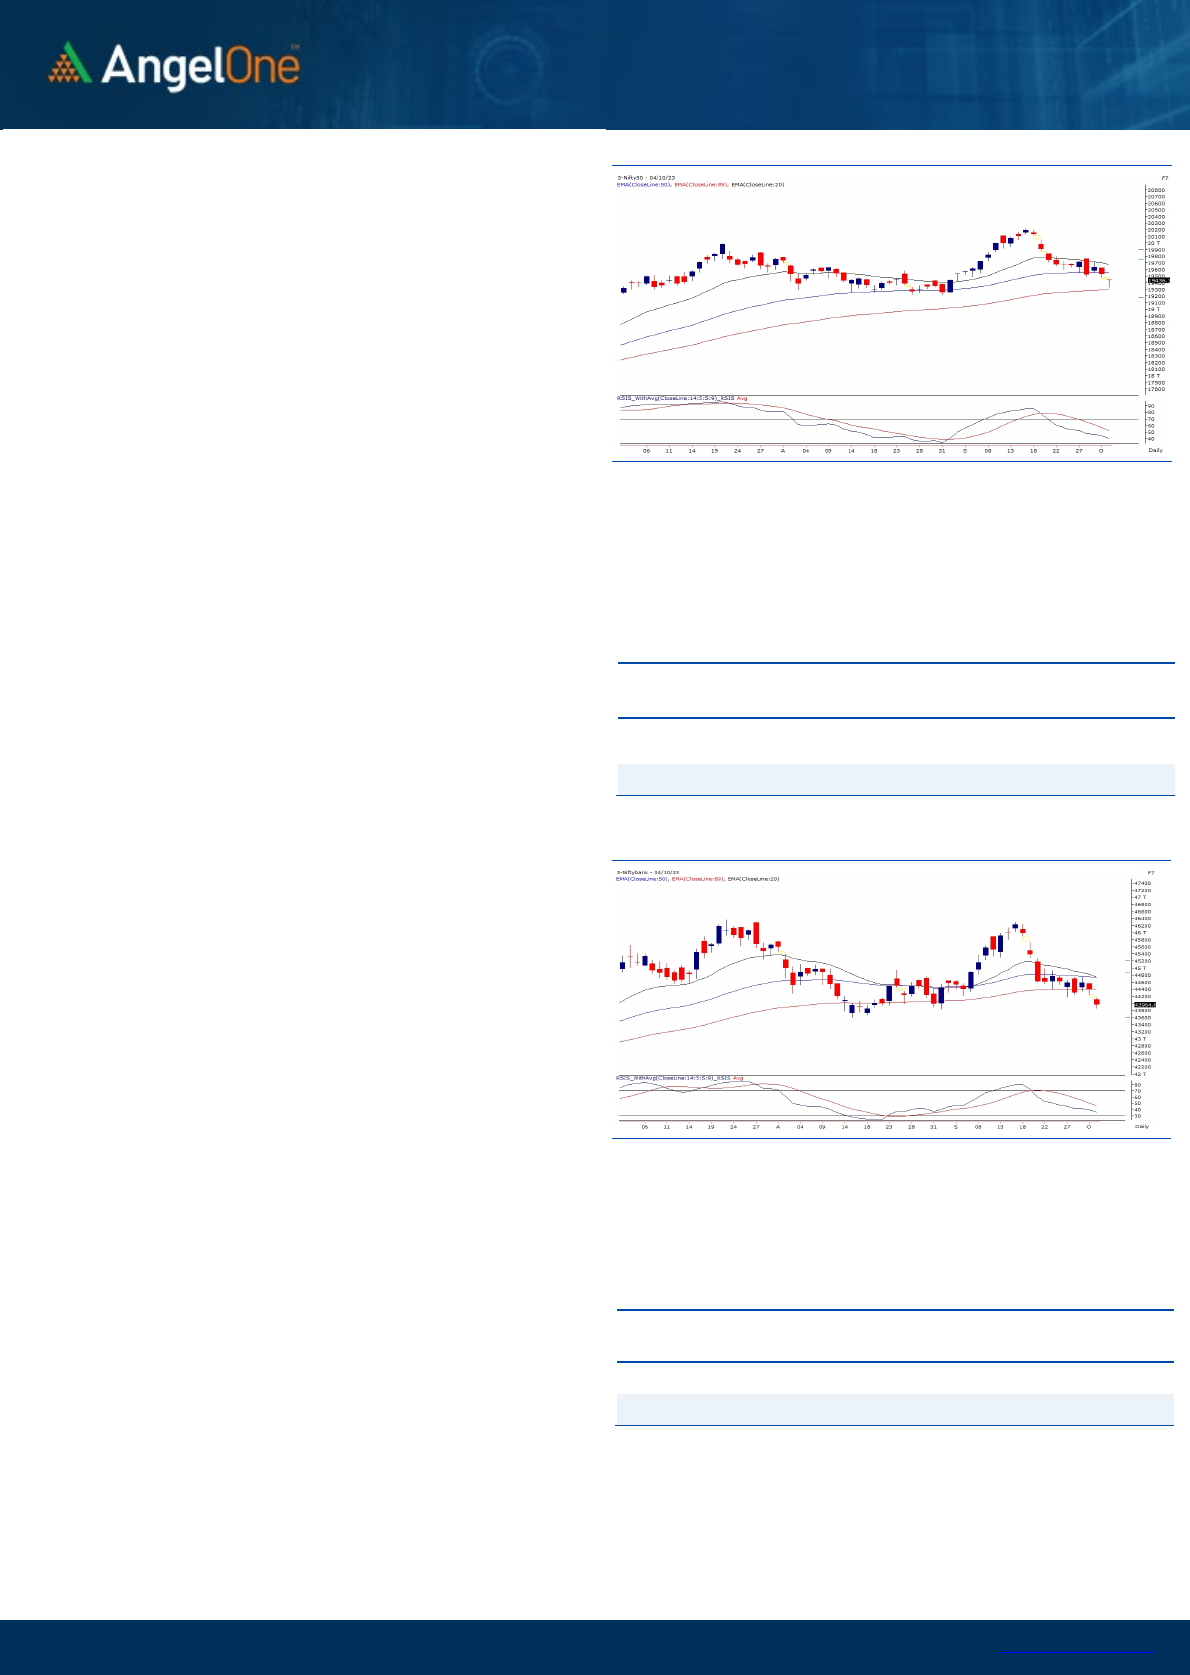
Exhibit 1: Nifty Daily Chart
Exhibit 2: Nifty Bank Daily Chart
Sensex (
6
5
226
) / Nifty (
19
436
)
The Indian equity market started the day on a negative note that too
with a gap-down opening, taking cues from the adverse effect of rising
bond yield and its repercussions on the global equity market. Post the
opening bell, the key indices remained under pressure with no sign of
respite or a pullback. However, by the penultimate hour, a modest
resurgence was seen from the lows which pared down some of the
losses. Eventually, the Nifty50 index concluded the day a tad
below 19450, with a 0.47 percent cut for the second consecutive
session.
The technical structure turned a bit skeptical, with the consolidation
breakdown in the key indices. Undoubtedly the parameters entered
oversold territory, but with the ongoing global tremors, we might
expect the fall to continue. However, the smart recovery by the day's
end indicates the bulls are not out yet and any relief could augur well
from hereon. On level specific, the zone of 19350 is likely to cushion
any further blip, while a breach could bring the previous runaway gap
of 19200 very much in the vicinity. On the flip side, the pivotal zone
of 19500 should now be acting as the immediate hurdle for the index.
While the sacrosanct resilience is placed around the 19700 odd zone,
above which only one may expect the robust momentum to reinstate.
There has been a broad sell-off in our market, with the majority
sector adjourned in red, wherein the major beating was seen in the
PSU Banking space. Until we witness relief from our global peers,
such tremors are likely to prevail; hence, it is advisable to stay
abreast with global developments and avoid being aggressive for the
time being.
Key Levels
Support 1 – 19350 Resistance 1 – 19500
Support 2 – 19200 Resistance 2 – 19640
Traders are advised to closely monitor these levels when making
trading decisions, but it's important to exercise caution as volatility
is expected to be elevated ahead of the key event and should avoid
undue risk.
Key Levels
Support 1 – 43500 Resistance 1 – 44250
Support 2 – 43300 Resistance 2 – 44400

www.angelone.in
Technical & Derivatives Report
October
0
5
,
2023
View
The Indian equity market witnessed a gap down
opening with follow-up selling to drag index below
19350. Eventually, due to final hour recovery, we
concluded the day a tad below 19450.
FIIs were net sellers in the cash market segment to
the tune of Rs. 4424 cr. Simultaneously, they sold
worth Rs. 560 cr in Index futures with the rise in open
interest, indicating the addition of fresh shorts.
We observed the addition of bearish bets in Nifty and
the banking index. On the options front, significant
PE writing at 19300-19400 strikes, suggests this
range may provide immediate support. On the
higher end, 19500- 19600 call strike have attracted
substantial open interest. Meanwhile, the selling
streak from stronger hands continues in the cash and
index future segment. Hence, the LSR declined
further to 25% from 28% seen on Friday. For now, we
would prefer opting for the wait and watch approach
and letting things settle before initiating any
directional bets in the system.
Comments
The Nifty futures open interest has increased by 3.86%
and Bank Nifty futures open interest has increased by
27.70% as the market closed at 19436.10.
The Nifty October future closed with a premium of
33.15 points against 42.75 points in the last trading
session. The November series closed at a premium of
153.95 points.
The INDIA VIX has decreased from 11.79 to 11.66. At
the same time, the PCR-OI of Nifty has increased from
0.91 to 0.96.
A few of the liquid counters where we have seen high
cost of carry are NAVINFLUOR, GLENMARK, SUNTV,
VEDL and ABBOTINDIA.
Historical Volatility
SCRIP HV
AXISBANK 28.54
NESTLEIND 21.16
IBULHSGFIN 64.16
L&TFH 40.96
M&MFIN 43.71
Nifty Vs OI
19000
19200
19400
19600
19800
20000
20200
20400
20600
9,000
9,500
10,000
10,500
11,000
11,500
12,000
12,500
13,000
13,500
14,000
9-13 9-15 9-19 9-25 9-27 9-29
Openinterest Nifty
OI Gainers
SCRIP OI
OI
CHG. (%)
PRICE
PRICE
CHG. (%)
AXISBANK 52965625 24.97 995.55 -4.46
SBIN 95250000 18.23 586.25 -2.84
ESCORTS 2050400 17.84 3195.55 2.21
SIEMENS 2284150 14.64 3501.40 -1.86
PNB 292848000 12.47 79.75 -4.30
PERSISTENT 1113700 11.75 5692.45 -0.76
DELTACORP 14974400 11.37 135.80 -0.65
NAUKRI 1623600 11.02 4058.65 -1.45
OI Losers
SCRIP OI
OI
CHG. (%)
PRICE
PRICE
CHG. (%)
COROMANDEL 17600 -8.41 1144.10 -0.42
LTTS 596800 -7.73 4550.45 -0.28
INDIGO 4241100 -7.53 2384.95 -1.39
EICHERMOT 3441025 -7.05 3400.90 1.66
NTPC 88155000 -6.93 235.15 -2.42
IPCALAB 1639300 -5.51 921.50 -1.31
RBLBANK 58580000 -5.39 249.30 -2.45
SUNTV 8481000 -5.34 611.15 -1.75
Put-Call Ratio
SCRIP PCR (OI) PCR (VOL)
NIFTY 0.96 0.86
BANKNIFTY 0.72 0.87
RELIANCE 0.58 0.38
ICICIBANK 0.50 0.43
INFY 0.55 0.34
www.angelone.in
Technical & Derivatives Report
October
0
5
,
2023
Note: Above mentioned Bullish or Bearish Spreads in Nifty (Oct Series) are given as an information and not as a recommendation.
Nifty Spot =
19
436.10
FII Statistics for
October
0
4
, 2023
Detail Buy
Contracts
OI Value
(in Cr.)
Sell Net
CHANGE
INDEX
FUTURES
3905.64
4465.33
(559.69) 187428
15225.71
13.20
INDEX
OPTIONS
2056283.92
2096589.92
(40306.00) 2989485
266870.14
(24.04)
STOCK
FUTURES
16193.72
23378.70
(7184.98) 2450459
190957.76
3.82
STOCK
OPTIONS
20573.75
20761.83
(188.08) 151186
12244.02
17.45
Total
2096957.03
2145195.78
(48238.75) 5778558
485297.63
(12.32)
Turnover on
October
0
4
, 2023
Instrument
No. of
Contracts
Turnover
(in Cr.)
Change
(%)
Index Futures
226695 18825.52
-32.09
Index Options
397133117
42984.65
-1.14
Stock Futures
768490 63598.78
-13.57
Stock Options
2894729 4340.54 -15.76
Total
28,94,729 4340.54 -13.47
Bull-Call Spreads
Action Strike Price Risk Reward BEP
Buy
19500 192.20
49.00
51.00
19549.00
Sell
19600 143.20
Buy
19500 192.20
89.25
110.75
19589.25
Sell
19700 102.95
Buy
19600 143.20
40.25 59.75 19640.25
Sell
19700 102.95
Bear-Put Spreads
Action Strike Price Risk Reward BEP
Buy
19500 222.90
45.20
54.80
19454.80
Sell 19400 177.70
Buy 19500 222.90
83.10
116.90
19416.90
Sell
19300 139.80
Buy
19400 177.70
37.90 62.10 19362.10
Sell 19300 139.80
Nifty Put
-
Call Analysis
,0
1000,000
2000,000
3000,000
4000,000
5000,000
6000,000
19000 19100 19200 19300 19400 19500 19600 19700 19800 19900 20000 20100 20200 20300
Call Put

www.angelone.in
Technical & Derivatives Report
October
0
5
,
2023
`
Daily Pivot Levels for Nifty Constituents
Scrips S2 S1 PIVOT R1 R2
ADANIENT 2,343 2,404 2,453 2,514 2,564
ADANIPORTS 804 814 830 840 856
APOLLOHOSP 4,928 4,988 5,042 5,102 5,157
ASIANPAINT 3,132 3,151 3,170 3,189 3,208
AXISBANK 959 977 1,007 1,025 1,055
BAJAJ-AUTO 4,831 4,875 4,947 4,991 5,063
BAJFINANCE 7,683 7,768 7,906 7,991 8,129
BAJAJFINSV 1,502 1,517 1,537 1,552 1,571
BPCL 337 339 342 344 347
BHARTIARTL 915 920 923 927 930
BRITANNIA 4,440 4,486 4,513 4,559 4,586
CIPLA 1,147 1,157 1,171 1,181 1,195
COALINDIA 283 285 288 291 294
DIVISLAB 3,619 3,663 3,698 3,742 3,776
DRREDDY 5,342 5,380 5,439 5,477 5,537
EICHERMOT 3,293 3,347 3,378 3,432 3,463
GRASIM 1,861 1,879 1,894 1,912 1,927
HCLTECH 1,217 1,228 1,236 1,248 1,256
HDFCBANK 1,472 1,501 1,518 1,547 1,564
HDFCLIFE 620 623 627 630 635
HEROMOTOCO 2,951 2,970 2,995 3,014 3,039
HINDALCO 466 470 474 478 482
HINDUNILVR 2,449 2,478 2,495 2,524 2,541
ICICIBANK 920 925 930 935 941
INDUSINDBK 1,363 1,382 1,405 1,424 1,448
INFY 1,406 1,425 1,438 1,457 1,469
ITC 429 432 437 441 445
JSW STEEL 744 751 759 765 774
KOTAKBANK 1,701 1,712 1,719 1,730 1,737
LT 2,953 2,991 3,027 3,065 3,101
LTIMINDTREE 5,098 5,142 5,171 5,215 5,243
M&M 1,484 1,503 1,521 1,539 1,557
MARUTI 9,974 10,052 10,168 10,246 10,362
NESTLEIND 22,158 22,572 22,965 23,380 23,773
NTPC 226 231 236 240 245
ONGC 181 182 183 184 186
POWERGRID 194 196 198 200 202
RELIANCE 2,286 2,300 2,309 2,324 2,333
SBILIFE 1,244 1,257 1,278 1,291 1,311
SBIN 574 580 590 596 606
SUNPHARMA 1,099 1,112 1,125 1,138 1,151
TCS 3,450 3,494 3,521 3,565 3,592
TATACONSUM
848 857 863 871 878
TATAMOTORS 602 608 614 620 627
TATASTEEL 123 124 126 127 128
TECHM 1,173 1,189 1,202 1,218 1,232
TITAN 3,120 3,143 3,174 3,197 3,228
ULTRACEMCO 7,905 8,013 8,153 8,261 8,400
UPL 594 598 603 607 611
WIPRO 399 402 404 407 408

www.angelone.in
Technical & Derivatives Report
October
0
5
,
2023
Technical and Derivatives Team:
Sameet Chavan Head Research – Technical & Derivatives sameet.chavan@angelone.in
Sneha Seth Senior Analyst – Technical & Derivatives sneha.seth@angelone.in
Rajesh Bhosale Analyst - Technical rajesh.bhosle@angelone.in
Osho Krishan Senior Analyst – Technical & Derivatives osho.krishan@angelone.in
Hitesh Rathi Analyst – Technical & Derivatives hitesh.rathi@angelone.in
Research Team Tel: 022 – 39357600 Website: www.angelone.in
For Technical Queries E-mail: technicalresearch-cso@angelone.in
For Derivatives Queries E-mail: derivatives.desk@angelone.in
DISCLAIMER
We, Angel One Limited (hereinafter referred to as “Angel”) a company duly incorporated under the provisions of the Companies Act, 1956 with
its registered office at 601, 6th Floor, Ackruti Star, Central Road, MIDC, Andheri East, Mumbai – 400093, CIN: (L67120MH1996PLC101709) and
duly registered as a member of National Stock Exchange of India Limited, Bombay Stock Exchange Limited, Metropolitan Stock Exchange Limited,
Multi Commodity Exchange of India Ltd and National Commodity & Derivatives Exchange Ltd. Angel One limited is a company engaged in
diversified financial services business including securities broking, DP services, distribution of Mutual Fund products. It is also registered as a
Depository Participant with CDSL and Portfolio Manager and Investment Adviser with SEBI. It also has registration with AMFI as a Mutual Fund
Distributor. Angel One Limited is a registered entity with SEBI for Research Analyst in terms of SEBI (Research Analyst) Regulations, 2014 vide
registration number INH000000164 and also registered with PFRDA as PoP ,Registration No.19092018. Angel Group does not have any joint
ventures or associates. Angel One Limited is the ultimate parent company of the Group. Angel or its associates has not been debarred/ suspended
by SEBI or any other regulatory authority for accessing /dealing in securities Market.
AOL was merged with Angel Global Capital Private Limited and subsequently name of Angel Global Capital Private Limited was changed to Angel
Broking Private Limited (AOL) pursuant to scheme of Amalgamation sanctioned by the Hon'ble High Court of Judicature at Bombay by Orders
passed in Company Petition No 710 of 2011 and the approval granted by the Registrar of Companies. Further, name of Angel Broking Private
Limited again got changed to Angel Broking Limited (AOL) pursuant to fresh certificate of incorporation issued by Registrar of Companies (ROC)
dated June 28, 2018. Further name of Angel Broking name changed to Angel One Ltd pursuant to fresh certificate of incorporation issued by
Registrar of Companies (ROC) dated 23-09-21.
In case of any grievances please write to: support@angelone.in, Compliance Officer Details: Name : Hiren Thakkar, Tel No. –08657864228, Email
id - compliance@angelone.in
Registration granted by SEBI and certification from NISM in no way guarantee performance of the intermediary or provide any assurance of returns
to investors.
This document is solely for the personal information of the recipient, and must not be singularly used as the basis of any investment decision.
Nothing in this document should be construed as investment or financial advice. Each recipient of this document should make such investigations
as they deem necessary to arrive at an independent evaluation of an investment in the securities of the companies referred to in this document
(including the merits and risks involved), and should consult their own advisors to determine the merits and risks of such an investment.
Angel or its associates or research analyst or his relative may have actual/beneficial ownership of 1% or more in the securities of the subject
company at the end of the month immediately preceding the date of publication of the research report. Neither Angel or its associates nor
Research Analysts or his relative has any material conflict of interest at the time of publication of research report.
Angel or its associates might have received any compensation from the companies mentioned in the report during the period preceding twelve
months from the date of this report for services in respect of managing or co-managing public offerings, corporate finance, investment banking or
merchant banking, brokerage services or other advisory service in a merger or specific transaction in the normal course of business. Angel or its
associates did not receive any compensation or other benefits from the companies mentioned in the report or third party in connection with the
research report. Neither research entity nor research analyst has been engaged in market making activity for the subject company.

www.angelone.in
Technical & Derivatives Report
October
0
5
,
2023
*
Reports based on technical and derivative analysis center on studying charts of a stock's price movement, outstanding positions and trading
volume, as opposed to focusing on a company's fundamentals and, as such, may not match with a report on a company's fundamentals. Investors
are advised to refer the Fundamental and Technical Research Reports available on our website to evaluate the contrary view, if any.
The information in this document has been printed on the basis of publicly available information, internal data and other reliable sources believed
to be true, but we do not represent that it is accurate or complete and it should not be relied on as such, as this document is for general guidance
only. Angel One Limited or any of its affiliates/ group companies shall not be in any way responsible for any loss or damage that may arise to any
person from any inadvertent error in the information contained in this report. Angel One Limited does not warrant the accuracy, adequacy or
completeness of the service, information and materials and expressly disclaims liability for errors or omissions in the service, information and
materials. While Angel One Limited endeavours to update on a reasonable basis the information discussed in this material, there may be
regulatory, compliance, or other reasons that prevent us from doing so.
This document is being supplied to you solely for your information, and its contents, information or data may not be reproduced, redistributed or
passed on, directly or indirectly.
Neither Angel One Limited, nor its directors, employees or affiliates shall be liable for any loss or damage that may arise from or in connection
with the use of this information. Angel or its associates or Research Analyst or his relative might have financial interest in the subject company.
Research analyst has not served as an officer, director or employee of the subject company.
Investment in securities market are subject to market risks. Read all the related documents carefully before investing.
Any communication sent to clients on phone numbers or e-mail ids registered with the Trading Member is meant for client consumption and such
material should not be redistributed. Brokerage will not exceed SEBI prescribed limit. Any Information provided by us through any medium based
on our research or that of our affiliates or third parties or other external sources is subject to domestic and international market conditions and
we do not guarantee the availability or otherwise of any securities or other instruments and such Information is merely an estimation of certain
investments, and we have not and shall not be deemed to have assumed any responsibility for any such Information. You should seek independent
professional advice and/or tax advice regarding the suitability of any investment decision whether based on any Information provided by us
through the Site from inhouse research or third party reports or otherwise.
The report and information contained herein is strictly confidential and meant solely for the selected recipient and may not be altered in any way,
transmitted to, copied or distributed, in part or in whole, to any other person or to the media or reproduced in any form, without prior written
consent.
