www.angelbroking.com
Technical & Derivatives Report
August 31, 2020
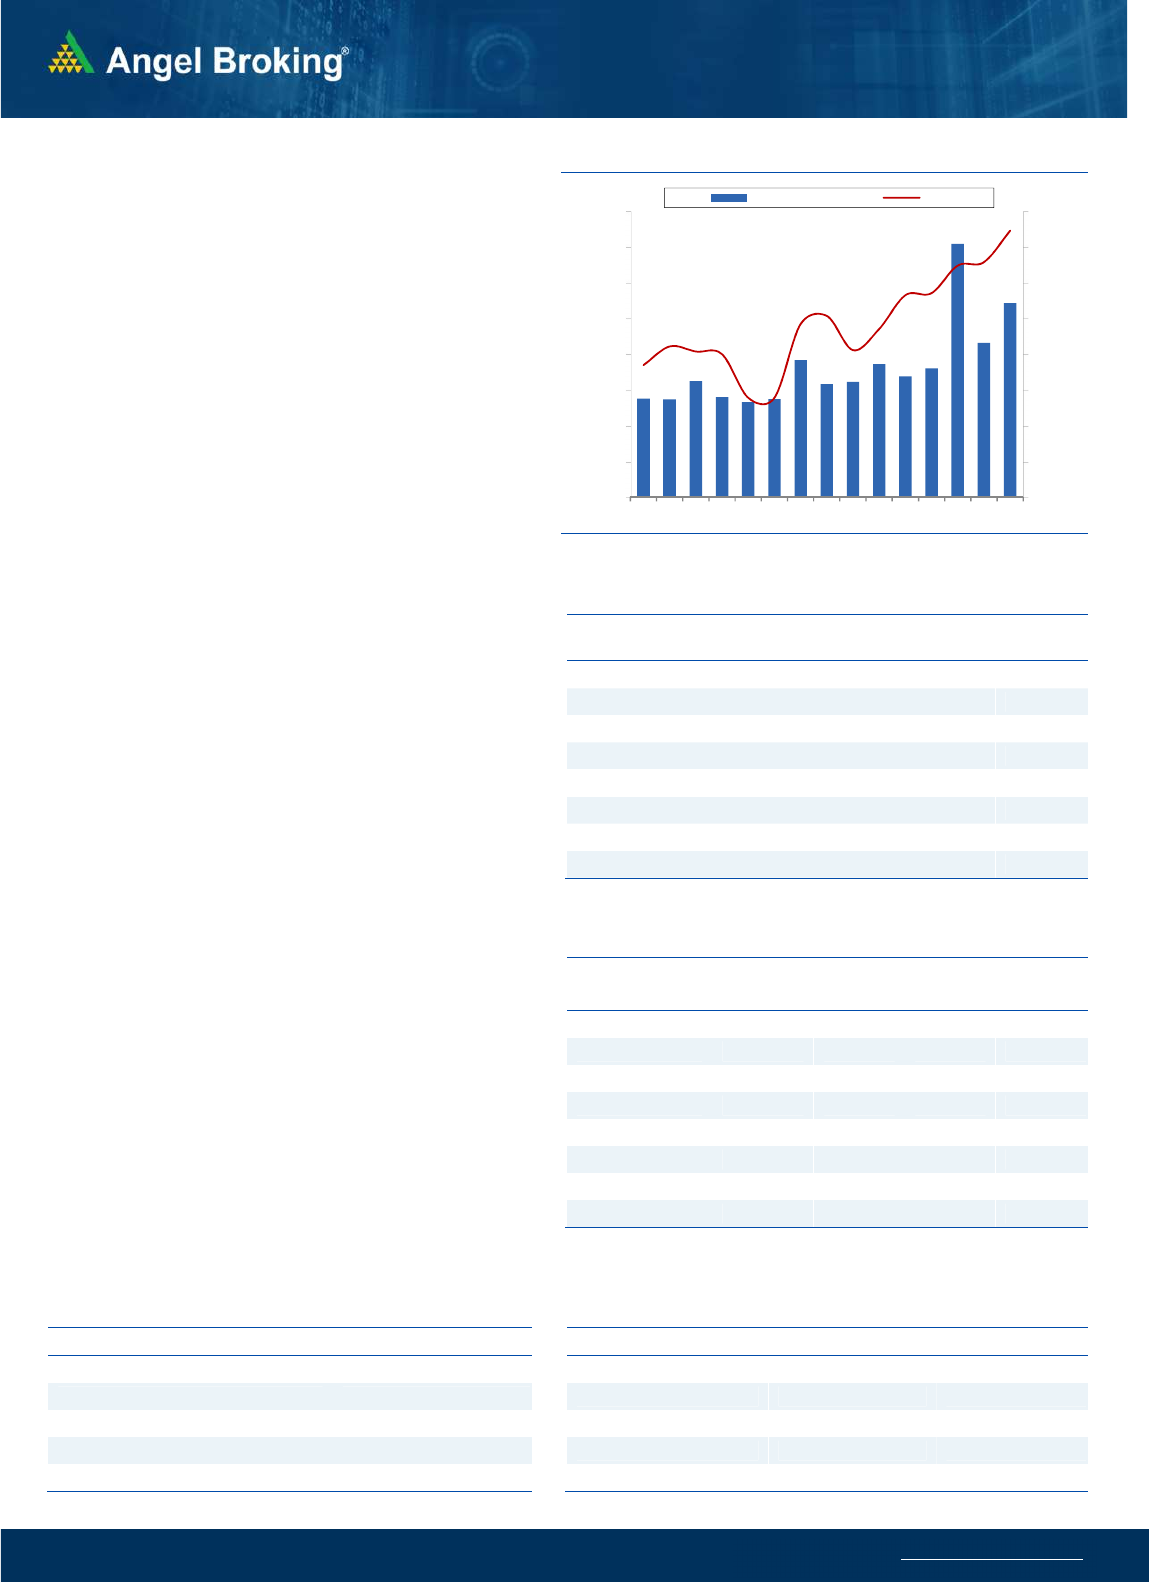
Nifty Bank Outlook - (24524)
On Friday, the bank index started on a flat note however it
witnessed a spectacular intraday rally to end with gains of around
4% and whooping 10% gains agains the previous week close.
After a severe underperformance for the last few weeks, the bank
nifty finally joined the bulls party and single handedly pushed
Nifty towards 11700 mark. During the week, the bank index broke
one by one key resistance with ease and the momentum is
strongly gripped by bulls. Going ahead the bias remains positive
and traders are advised to focus on stock specific approach within
the sector which are providing outperforming opportunities. As far
as levels are concerned, 24850 followed by 200SMA at 25000 can
be taken as immediate resistance whereas 24200 and 24000 are
the immediate support levels.
Key Levels
Support 1 – 24200 Resistance 1 – 24850
Support 2 – 24000 Resistance 2 – 25000
Exhibit 1: Nifty Daily Chart
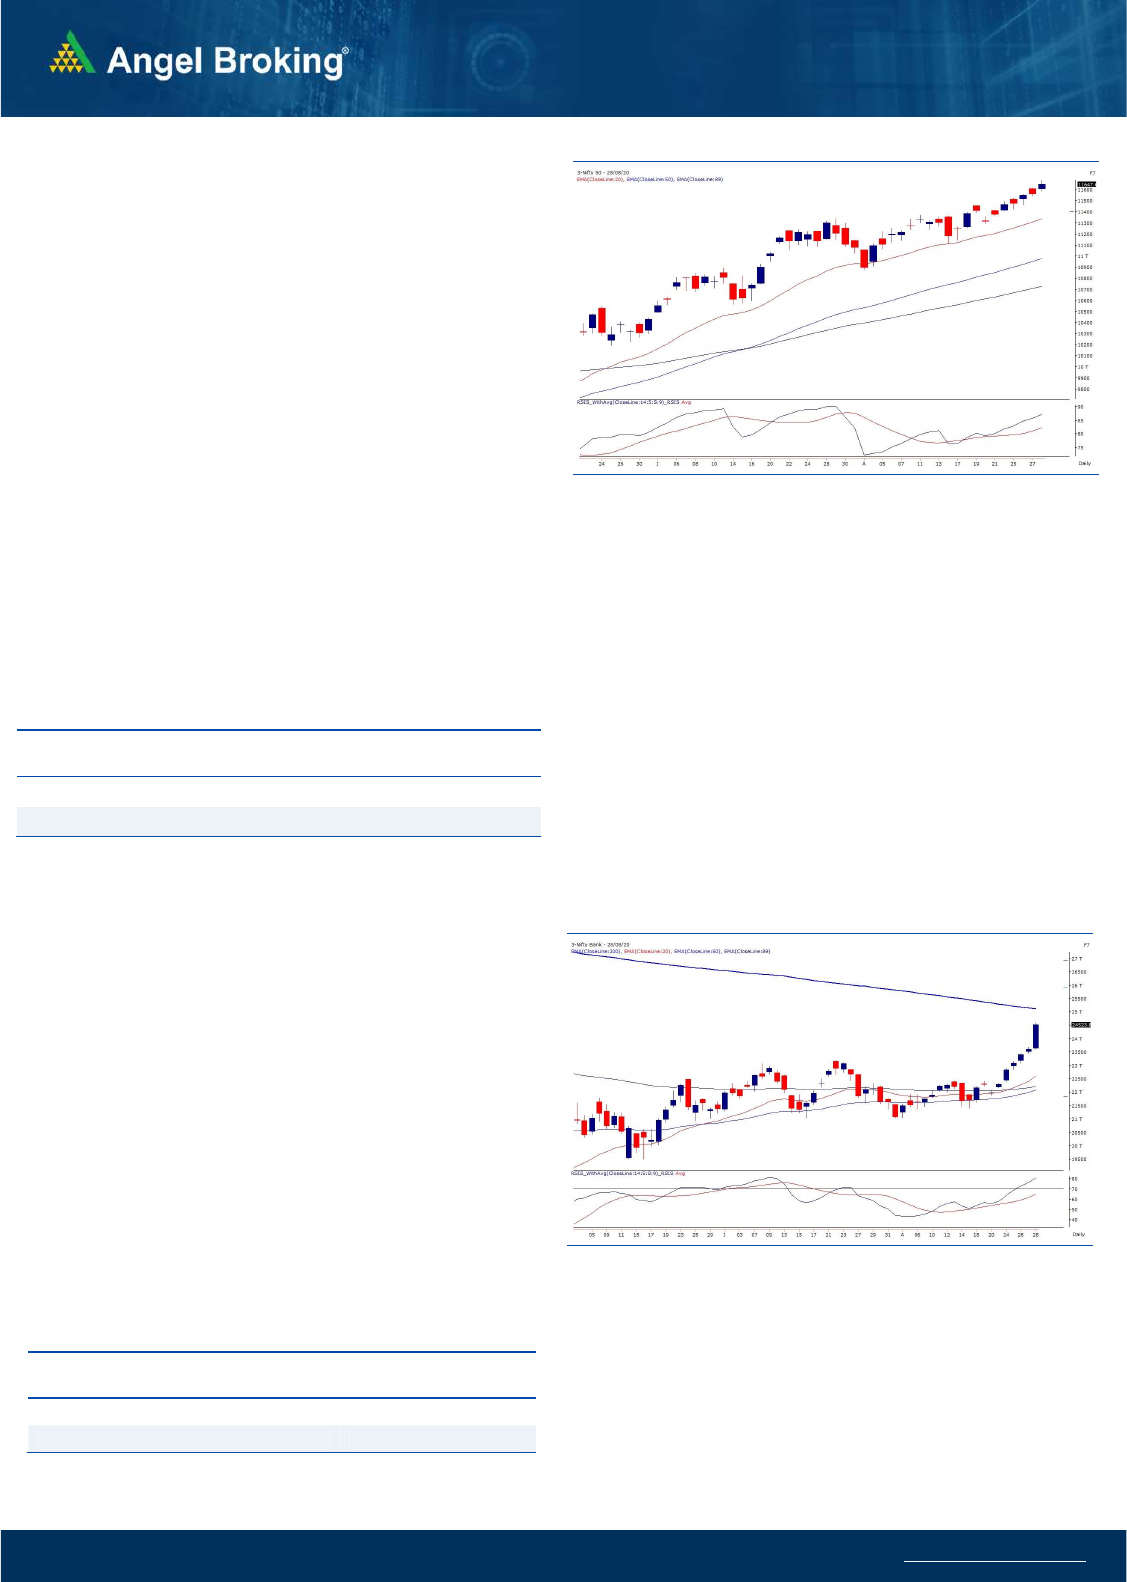
Sensex (39467) / Nifty (11648)
The expiry session was quite boring for our benchmark; but our
markets started with a bang on Friday above the 11600 mark, owing
to extremely positive cues from the Dow futures early morning. In
first couple of hours, the Nifty hastened towards the 11700 mark;
but cooled off a bit in the latter half to conclude tad below 11650.
The ongoing rally across the globe is just extraordinary and we are
not at all falling behind. Although we are not actively participating
in index specific trades since last a week (After 11350-11400) or so,
the focus remained on individual stocks. Yes but at the same time,
we are advocating booking timely profits on trades as well and we
would continue to do so. After a certain time, it’s always better to let
go some move and focus on money management. As far as levels
are concerned, 11700-11750 remains to be an immediate hurdle;
whereas on the flipside, 11600 followed by 11540 would be seen as
key support levels. It may sound a bit repetitive but since we have
approached yet another cluster of resistances, we continue to advise
some caution at higher levels, rather better to take one step at a
time and keep a close eye on key levels.
.Key Levels
Support 1 – 11600 Resistance 1 – 11700
Support 2 – 11540 Resistance 2 – 11750
Exhibit 2: Nifty Bank Daily Chart
Since last few days, the banking space started to outperform and
single handedly, the up move was propelled by the banking stocks.
In fact, the Bank Nifty witnessed a stellar intraday move on Friday
and thereby marking whopping 10% gains during the week. Apart
from this, there was a decent stock specific action throughout the
day, but the broader market slightly took a back sit.
www.angelbroking.com
Technical & Derivatives Report
August 31, 2020
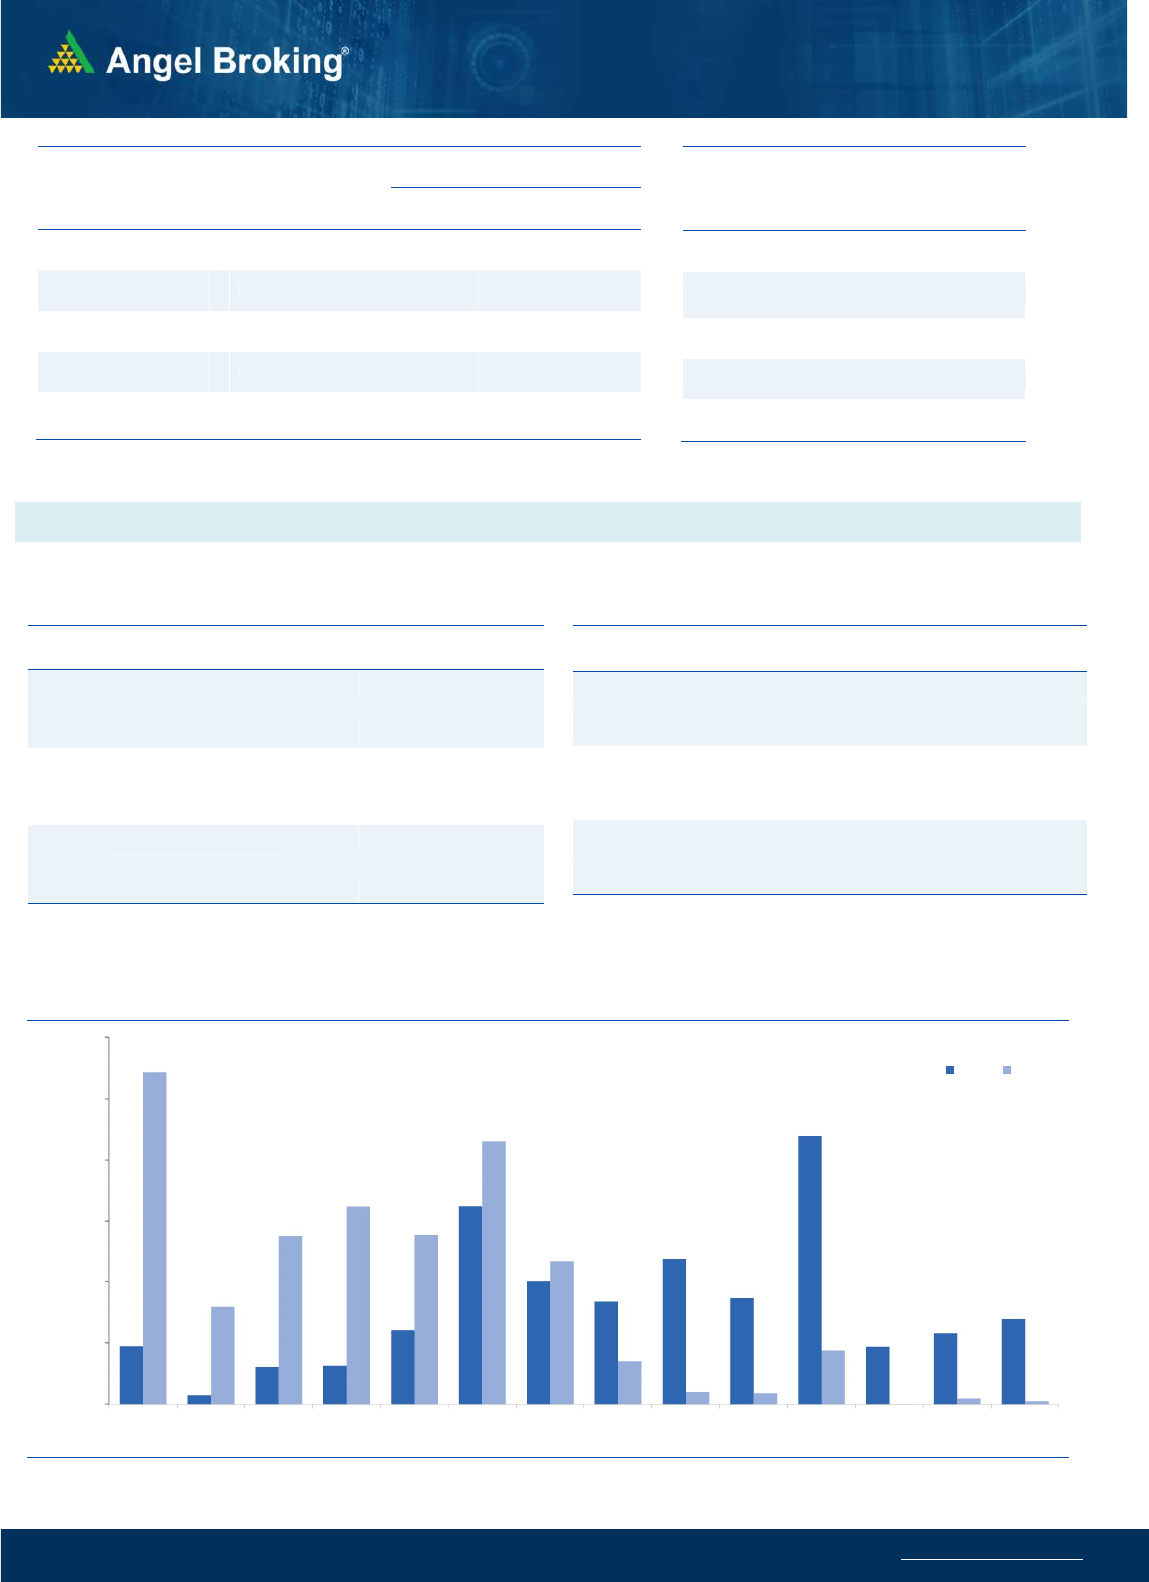
Nifty Vs OI
10900
11000
11100
11200
11300
11400
11500
11600
11700
10,000
10,500
11,000
11,500
12,000
12,500
13,000
13,500
14,000
8/10 8/12 8/14 8/18 8/20 8/24 8/26 8/28
(`000)
Openinterest Nifty
View
s
Quite similar to the last few sessions, Nifty started on a
positive note and traded within a range with positive
bias. Eventually, Nifty ended the Friday’s session with
gains of 0.67% tad below 11650 levels.
FIIs were net buyers in the cash market segment to the
tune of Rs. 1004 crores. In index futures, they bought
worth 351 crores with decrease in open interest
indicating short covering on Friday
.
Nifty continued with its upmove post expiry whereas
BankNifty attracted buying interest which led to its
outperformance on Friday. FII's continued their buying
streak in the cash segment and 77 percent of their
positions in the index futures segment are on the long
side. The weekly options data indicate support at 11600
and 11500 for the near term. Traders are advised to
trade with a positive bias and look for stock/sector
specific buying opportunities from a near term
perspective. If the index breaks the 11500 mark, then
one should reassess the data and trade accordingly.
C
o
mme
n
t
s
The Nifty futures open interest has increased by 4.62%
Bank Nifty futures open interest has increased by 18.38%
as market closed at 11647.60 levels.
The Nifty September future closed with a premium of
27.65 point against a premium of 20.8 point in last trading
session. The October series closed at a premium of 41.45
point.
The INDIA VIX has decreased from 18.89 to 18.34.
At the same time, the PCR-OI of Nifty remained
unchanged at 1.64.
Few of the liquid counters where we have seen high cost
of carry are IDEA, SAIL, COFORGE, INFRATEL AND
TATACHEM.
OI Gainers
SCRIP OI
OI
CHG. (%)
PRICE
PRICE
CHG. (%)
PNB 48496000 107.67 37.05 4.63
BHEL 62223000 102.67 41.65 5.94
IDEA 507500000 49.98 10.10 15.25
CANBK 13840000 49.38 114.80 8.11
INFRATEL 15495200 41.68 201.50 1.37
SAIL 39786000 32.53 40.95 0.00
BANKBARODA 72463400 30.67 51.60 5.82
ASHOKLEY 22095000 23.68 70.50 -3.41
OI Losers
SCRIP OI
OI
CHG. (%)
PRICE
PRICE
CHG. (%)
GODREJPROP 819000 -14.69 902.90 -1.04
ESCORTS 2274800 -11.55 1141.10 -1.60
NMDC 29895400 -9.47 107.50 11.61
APOLLOTYRE 12850000 -7.25 133.55 -1.03
ICICIBANK 114838625 -6.94 409.70 4.40
M&MFIN 16775724 -5.84 143.65 1.84
INDUSINDBK 32021600 -5.60 665.40 10.17
MFSL 1864200 -5.60 598.10 -0.81
Put-Call Ratio
SCRIP PCR-OI PCR-VOL
NIFTY 1.64 0.86
BANKNIFTY 1.44 0.68
RELIANCE 0.60 0.49
ICICIBANK 0.71 0.46
INFY 0.47 0.59
Historical Volatility
SCRIP HV
NMDC 58.88
PVR 63.00
CANBK 65.12
FEDERALBNK 67.00
AXISBANK 73.61
www.angelbroking.com
Technical & Derivatives Report
August 31, 2020
Note: Above mentioned Bullish or Bearish Spreads in Nifty (September Series) are given as an information and not as a recommendation.
Nifty Spot =
11647.60
FII Statistics for August 28, 2020
Detail Buy
Sell Net
Open Interest
Contracts
Value
(in Cr.)
Change
(%)
INDEX
FUTURES
5301.44
4950.75
350.69
136543
11352.32
(3.17)
INDEX
OPTIONS
177134.31
175739.88
1394.43
662022
53511.24
27.41
STOCK
FUTURES
15754.84
16562.08
(807.24) 1222456
88649.23
1.70
STOCK
OPTIONS
4921.24
4673.35
247.89
45871
3217.60
78.05
Total 203111.83
201926.06
1185.77
2066892
156730.39
9.45
Turnover on August 28, 2020
Instrument
No. of
Contracts
Turnover
( in Cr. )
Change
(%)
Index Futures 5,01,830 34567.13 0.22
Index Options
1,74,74,380
12,16,370.10
-63.04
Stock Futures 9,65,974 68238.89 -28.91
Stock Options
11,30,924
83159.79 -5.09
Total 2,00,73,108
14,02,335.91
-60.04
Bull-Call Spreads
Action Strike Price Risk Reward BEP
Buy 11700 188.85
50.85 49.15 11750.85
Sell 11800 138.00
Buy 11700 188.85
91.35 108.65 11791.35
Sell 11900 97.50
Buy 11800 138.00
40.50 59.50 11840.50
Sell 11900 97.50
Bear-Put Spreads
Action Strike Price Risk Reward BEP
Buy 11600 174.25
34.00 66.00 11566.00
Sell 11500 140.25
Buy 11600 174.25
62.10 137.90 11537.90
Sell 11400 112.15
Buy 11500 140.25
28.10 71.90 11471.90
Sell 11400 112.15
Nifty Put-Call Analysis
,0
500,000
1000,000
1500,000
2000,000
2500,000
3000,000
11000 11100 11200 11300 11400 11500 11600 11700 11800 11900 12000 12100 12200 12300
Call Put

www.angelbroking.com
Technical & Derivatives Report
August 31, 2020
Daily Pivot Levels for Nifty Constituents
Scrips
S2
S1
PIVOT
R1
R2
ADANIPORTS
343
351
357
366
372
ASIANPAINT 1,926 1,942
1,969
1,986
2,013
AXISBANK
462
486
499
523
536
BAJAJ-AUTO 2,966 2,990
3,026
3,050
3,087
BAJFINANCE 3,588 3,629
3,659
3,700
3,730
BAJAJFINSV 6,435 6,490
6,570
6,625
6,705
BPCL
408
412
417
420
425
BHARTIARTL
504
514
522
531
539
INFRATEL
191
196
205
210
219
BRITANNIA 3,762 3,778
3,803
3,819
3,843
CIPLA
731
740
755
764
780
COALINDIA
136
138
140
141
144
DRREDDY 4,295 4,335
4,400
4,440
4,506
EICHERMOT 2,167 2,190
2,223
2,246
2,279
GAIL
98
98
99
100
101
GRASIM
667
684
701
718
734
HCLTECH
695
701
709
714
722
HDFCBANK 1,082 1,098
1,112
1,128
1,142
HDFC
578
584
594
599
609
HEROMOTOCO
1,852
1,868
1,878
1,894
1,905
HINDALCO 2,978 3,019
3,091
3,132
3,205
HINDUNILVR
191
192
194
196
197
ICICIBANK 2,122 2,137
2,160
2,175
2,197
IOC
386
398
405
417
424
INDUSINDBK
86
87
88
89
90
INFY
557
611
650
705
744
ITC
921
928
940
947
960
JSW STEEL
193
194
195
197
198
KOTAKBANK
274
277
284
287
293
LT 1,374 1,421
1,447
1,494
1,520
M&M
962
972
988
998
1,015
MARUTI
618
625
636
642
654
NESTLEIND 6,969 7,036
7,096
7,164
7,224
NTPC 15,908
16,005
16,186
16,283
16,464
ONGC
99
100
102
103
105
POWERGRID
79
80
81
81
83
RELIANCE
179
180
184
185
189
SHREECEM 2,092 2,104
2,118
2,131
2,145
SBIN 20,912
21,121
21,460
21,669
22,009
SUNPHARMA
213
219
223
228
232
TCS
522
539
552
569
582
TATAMOTORS 2,206 2,222
2,251
2,267
2,296
TATASTEEL
137
140
143
146
149
TECHM
413
419
428
434
443
TITAN
732
742
750
760
769
ULTRACEMCO 1,121 1,128
1,138
1,144
1,155
UPL 4,023 4,043
4,066
4,086
4,109
VEDANTA
490
505
513
527
536
WIPRO
269
271
273
274
276
ZEEL
207
210
214
218
222

www.angelbroking.com
Technical & Derivatives Report
August 31, 2020
*
Research Team Tel: 022 – 39357600 (Extn. 6844) Website: www.angelbroking.com
For Technical & Derivatives Queries E-mail: technicalrese[email protected]
DISCLAIMER
Angel Broking Limited (hereinafter referred to as “Angel”) is a registered Member of National Stock Exchange of India Limited, Bombay
Stock Exchange Limited and Metropolitan Stock Exchange Limited. It is also registered as a Depository Participant with CDSL and
Portfolio Manager and Investment Adviser with SEBI. It also has registration with AMFI as a Mutual Fund Distributor. Angel Broking
Limited is a registered entity with SEBI for Research Analyst in terms of SEBI (Research Analyst) Regulations, 2014 vide registration
number INH000000164. Angel or its associates has not been debarred/ suspended by SEBI or any other regulatory authority for
accessing /dealing in securities Market. Angel or its associates/analyst has not received any compensation / managed or co-managed
public offering of securities of the company covered by Analyst during the past twelve months.
This document is solely for the personal information of the recipient, and must not be singularly used as the basis of any investment
decision. Nothing in this document should be construed as investment or financial advice. Each recipient of this document should make
such investigations as they deem necessary to arrive at an independent evaluation of an investment in the securities of the companies
referred to in this document (including the merits and risks involved), and should consult their own advisors to determine the merits
and risks of such an investment.
Reports based on technical and derivative analysis center on studying charts of a stock's price movement, outstanding positions and
trading volume, as opposed to focusing on a company's fundamentals and, as such, may not match with a report on a company's
fundamentals. Investors are advised to refer the Fundamental and Technical Research Reports available on our website to evaluate the
contrary view, if any.
The information in this document has been printed on the basis of publicly available information, internal data and other reliable
sources believed to be true, but we do not represent that it is accurate or complete and it should not be relied on as such, as this
document is for general guidance only. Angel Broking Limited or any of its affiliates/ group companies shall not be in any way
responsible for any loss or damage that may arise to any person from any inadvertent error in the information contained in this report.
Angel Broking Limited has not independently verified all the information contained within this document. Accordingly, we cannot
testify, nor make any representation or warranty, express or implied, to the accuracy, contents or data contained within this document.
While Angel Broking Limited endeavors to update on a reasonable basis the information discussed in this material, there may be
regulatory, compliance, or other reasons that prevent us from doing so.
This document is being supplied to you solely for your information, and its contents, information or data may not be reproduced,
redistributed or passed on, directly or indirectly.
Technical and Derivatives Team:
Sameet Chavan Chief Analyst - Technical & Derivatives sameet.chavan@angelbroking.com
Ruchit Jain Senior Analyst - Technical & Derivatives ruchit.jain@angelbroking.com
Rajesh Bhosale Technical Analyst rajesh.bhosle@angelbroking.com
Sneha Seth Derivatives Analyst sneha.seth@angelbroking.com
