www.angelbroking.com
March 31, 2021
Technical & Derivatives Report
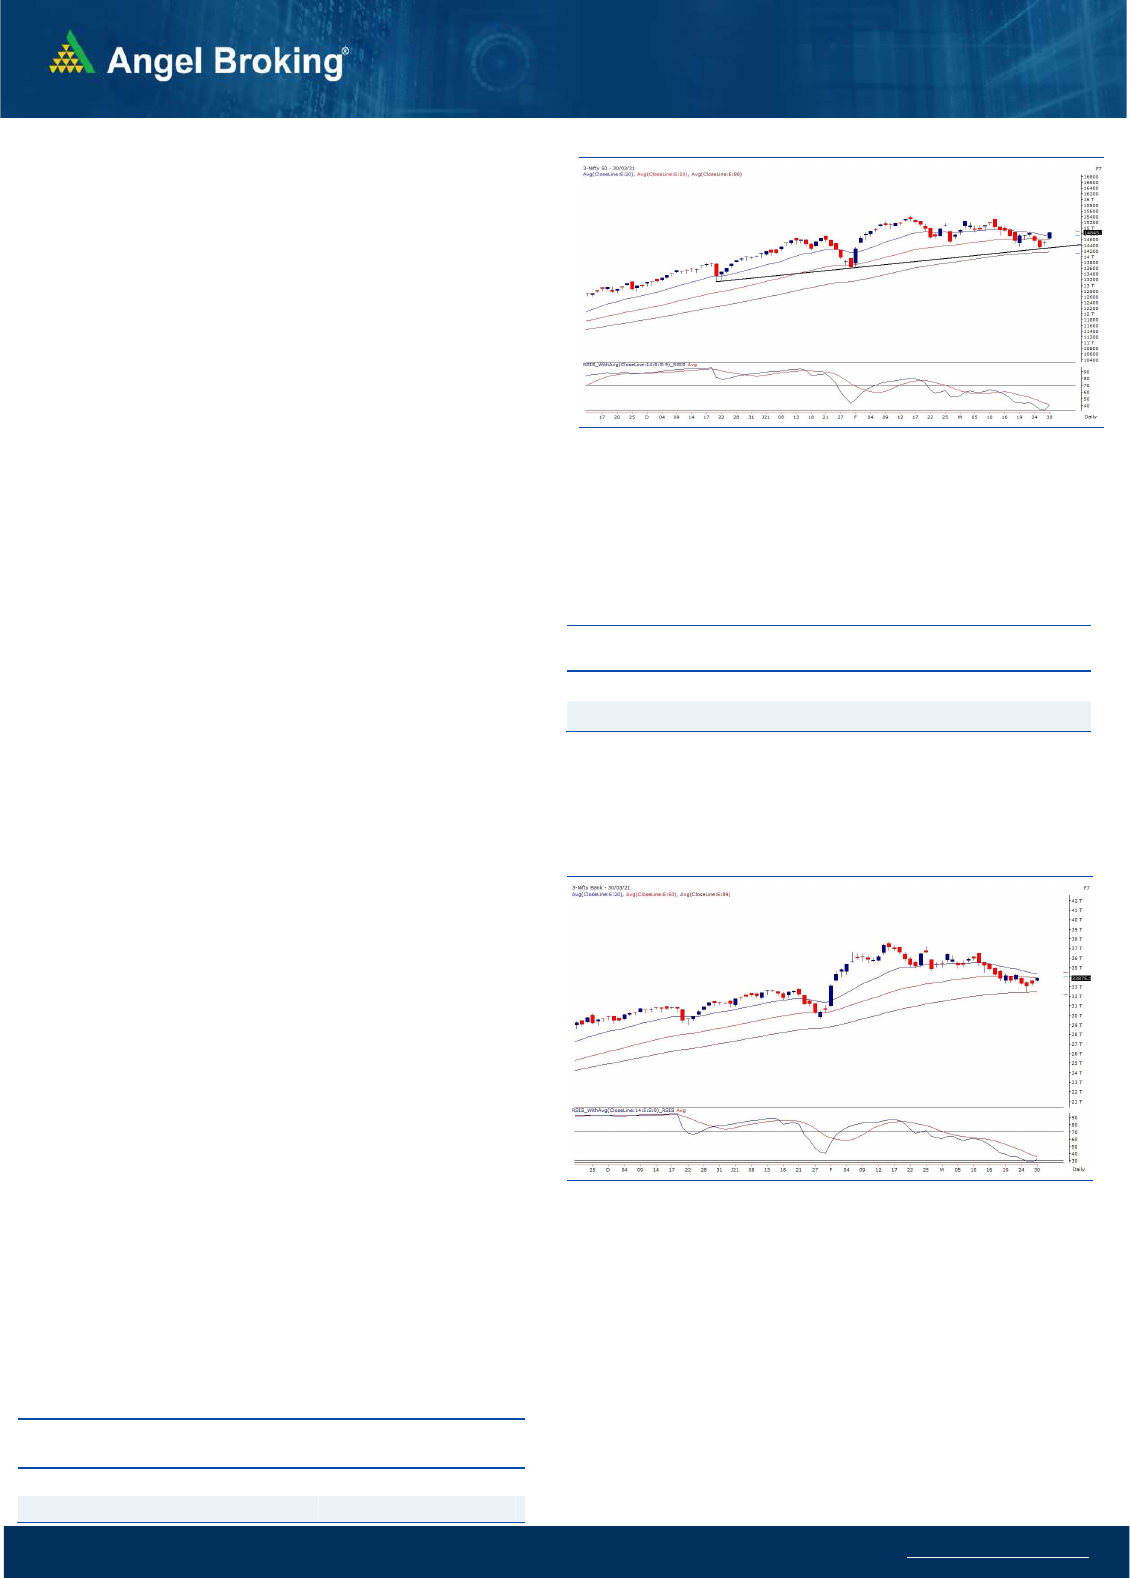
Exhibit 1: Nifty Daily Chart
Nifty
Bank Out
look
-
(
33875)
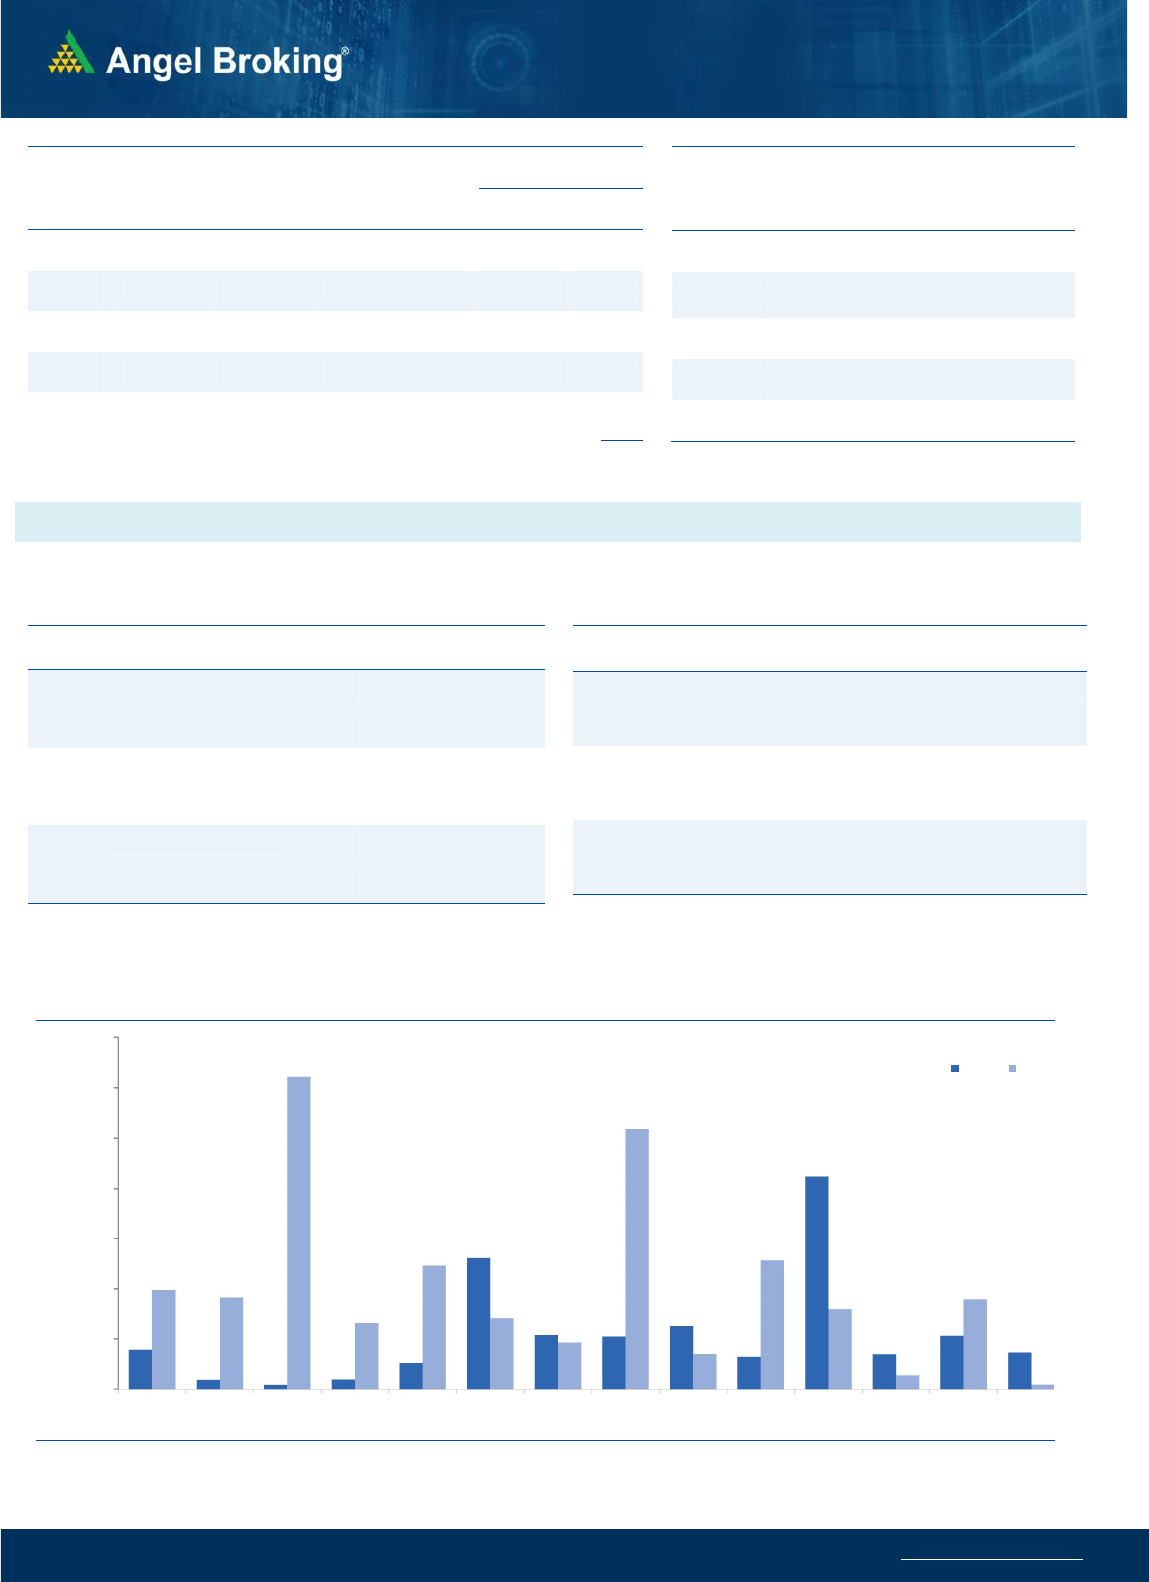
After an extended weekend, our markets opened with a good
bump up on the back of favourable cues from the global bourses.
The banking too had a great start in tandem with benchmark to
surpass the immediate hurdle of 33500. During the remaining
part of the day, we witnessed a range bound action in most of the
banking counters, but the bias remained strongly bullish.
Eventually, the penultimate session of the financial year ended
with slightly less than two percent gains for the banking index.
In last couple of sessions, BANKNIFTY has come off its lows quite
swiftly after precisely testing the key support of ’89-EMA’ on daily
chart. Now it has reached its cluster of resistance and hence, it
would be interesting to see how it behaves here. As far as levels
are concerned, 34000 – 34400 are to be seen as immediate
hurdles; whereas yesterday’s lower range of 33600 – 33400
should act as intraday support. The real momentum would only
be seen outside this range and hence, traders should focus on
individual stocks till the time index remains in a consolidation
zone.
Key Levels
Support 1 – 33600 Resistance 1 – 34000
Support 2 – 33400 Resistance 2 – 34400
Sensex (50137) / Nifty (14845)
Post the extended weekend, our markets started the session on an
optimistic note with a gap up above 14600 mark. The momentum
continued throughout the day supported by participation from
index heavyweights and Nifty ended the session around 14850,
with gains of over a couple of percent.
The global markets traded with a positive bias which had a positive
impact on our markets at opening. We then witnessed a good
buying interest in the benchmark and some of the index
heavyweights which propelled the market higher. If we look at the
chart, we had seen a pullback from a ‘Rising Trendline’ support in
Nifty during last week. A follow up buying yesterday with a broad
market participation is certainly an encouraging sign and hints at a
probability of resumption of the broader uptrend. However, we are
now at an important juncture in the index at 14875-14900 and
15050 which are resistances on short term charts. The index needs
to surpass these with an authority which would then build a greater
confidence going ahead. Hence, taking one step at a time and
avoiding aggressive bets would be the advice for traders at these
levels. A lot of sector/stock specific momentum could clearly be
seen and hence, capitalizing on such ideas would be a better
approach to ride this momentum. As far as index levels are
concerned, 14700 would be seen as an immediate support while
14900 and 15050 are the resistances to watch out for.
Exhibit 2: Nifty Bank Daily Chart
A lot of sector specific movement was seen yesterday wherein the
IT, Pharma, Metals and FMCG pack saw good buying interest along
with the heavyweights HDFC twins. Traders are advised to look for
such thematic opportunities and trade with proper risk
management.
Key Levels
Support 1 – 14750 Resistance 1 – 14900
Support 2 – 14700 Resistance2 – 15050

www.angelbroking.com
Technical & Derivatives Report
March 31, 2021
Nifty Vs OI
13800
14000
14200
14400
14600
14800
15000
15200
15400
,0
20,000
40,000
60,000
80,000
100,000
120,000
140,000
160,000
3/9 3/12 3/17 3/19 3/23 3/25
(`000)
Openinterest Nifty
View
We had a cheerful start for the week tad above
14600 post Friday’s strong upmove
. As the day
progressed, we witnessed follow-up buying any dips
was being bought and hence we concluded the day on
a strong note tad above 14800 mark with the gains over
two percent.
FIIs were net buyers in the cash segment to the tune
of Rs. 769 crores.
Nifty has started the April series with a low open
interest base and has added some long positions on
Friday. But surprisingly, despite yesterday’s strong
rally we hardly saw any fresh build-up. The Banking
index underperformed the benchmark but added
decent amount of longs. As we have been
mentioning, the BankNifty had huge short rollovers
and these positions are still intact in the system. In
options front, we saw good amount of writing in
14500-14800 put strikes; suggesting the immediate
support shiting higher to 14700-14800 now. On the
other side, we saw some build-up in OTM call strikes;
but the quantum wasn’t significant. The open interest
concentration in 15000 call hints resistance is now
placed around 15000-15050.
C
o
mme
n
t
s
The Nifty futures open interest remains unchanged.
Bank Nifty futures open interest has increased by 5.95%
as market closed at 14845.10 levels.
The Nifty April future closed with a premium of point
64.45 against a premium of 101.20 point in last trading
session. The May series closed at a premium of 107.35
point.
The INDIA VIX remains unchanged at 20.65.
At the same time, the PCR-OI of Nifty increased from
1.14 to 1.32.
Few of the liquid counters where we have seen high cost
of carry are NAUKRI, IDEA, PFC, BANKBARODA and
HDFCAMC.
OI Gainers
SCRIP OI
OI
CHG. (%)
PRICE
PRICE
CHG. (%)
GAIL 48190000 91.47 132.35 0.64
NAUKRI 1427250 48.79 4158.65 -6.40
TATACONSUM 15792300 42.48 628.90 -0.23
MINDTREE 1959200 34.56 2130.05 6.76
TVSMOTOR 3540600 32.13 575.20 -0.65
PFC 38427600 23.59 111.10 -2.78
POWERGRID 17520000 23.14 221.35 3.48
RECLTD 18300000 22.44 128.55 -2.38
OI Losers
SCRIP OI
OI
CHG. (%)
PRICE
PRICE
CHG. (%)
IBULHSGFIN 30166100 0.38 196.05 -1.10
BALKRISIND 1731200 0.46 1658.05 0.34
SUNTV 12063000 0.47 463.85 2.11
DRREDDY 3271000 0.50 4518.20 2.46
AUROPHARMA 8616400 0.69 870.40 2.21
ADANIPORTS 59345000 1.11 710.50 1.17
MRF 42060 1.13 83186.20 1.19
SUNPHARMA 41907600 1.13 597.70 1.74
Put-Call Ratio
SCRIP PCR-OI PCR-VOL
NIFTY 1.32 0.83
BANKNIFTY 0.95 0.81
RELIANCE 0.60 0.42
ICICIBANK 0.68 0.43
INFY 0.61 0.40
Historical Volatility
SCRIP HV
MINDTREE 54.00
NAUKRI 57.93
UPL 57.26
HDFCBANK 38.98
HINDUNILVR 33.43
www.angelbroking.com
Technical & Derivatives Report
March 31, 2021
Note: Above mentioned Bullish or Bearish Spreads in Nifty (April Series) are given as an information and not as a recommendation.
Nifty Spot =
14845.10
FII Statistics for March 26, 2021
Detail Buy
Net Contracts
Open Interest
Sell
Value
(in Cr.)
Change
INDEX
FUTURES
6398.84
4519.05
1879.79
111491
11505.81
4.36
INDEX
OPTIONS
272377.69
272936.75
(559.06) 724605
74085.24
24.53
STOCK
FUTURES
12195.50
11477.33
718.17
1054276
89168.34
1.19
STOCK
OPTIONS
9798.68
10156.10
(357.42) 86598
7209.82
53.13
Total 300770.71
299089.23
1681.48
1976970
181969.21
10.62
Turnover on March 30, 2021
Instrum
ent
No. of
Contracts
Turnover
( in Cr. )
Change
(%)
Index Futures
3,95,991 38897.89 10.09
Index Options
2,69,30,036 26,15,278.51 33.78
Stock Futures
6,21,243 56467.49 1.15
Stock Options
9,35,864 86814.69 -12.19
Total 2,88,83,134 27,97,458.58 30.42
Bull-Call Spreads
Action Strike Price Risk Reward BEP
Buy 14800 408.00
59.00 41.00 14859.00
Sell 14900 349.00
Buy 14800 408.00
112.15 87.85 14912.15
Sell 15000 295.85
Buy 14900 349.00
53.15 46.85 14953.15
Sell 15000 295.85
Bear-Put Spreads
Action Strike Price Risk Reward BEP
Buy 14800 292.90
40.45 59.55 14759.55
Sell 14700 252.45
Buy 14800 292.90
73.50 126.50 14726.50
Sell 14600 219.40
Buy 14700 252.45
33.05 66.95 14666.95
Sell 14600 219.40
Nifty Put-Call Analysis
,0
500,000
1000,000
1500,000
2000,000
2500,000
3000,000
3500,000
14000 14100 14200 14300 14400 14500 14600 14700 14800 14900 15000 15100 15200 15300
Call Put
Note
-
FIIs data for 30
-
03
-
2021 is yet to be pulished by NSE

www.angelbroking.com
Technical & Derivatives Report
March 31, 2021
Da
ily
Pivot Level
s for
Nifty Constituents
Scrips
S2
S1
PIVOT
R1
R2
ADANIPORTS
688
699
709
720
729
ASIANPAINT 2,499 2,539
2,561
2,601
2,623
AXISBANK
678
686
700
709
722
BAJAJ-AUTO 3,548 3,607
3,641
3,701
3,734
BAJFINANCE 5,091 5,142
5,201
5,252
5,311
BAJAJFINSV 9,324 9,413
9,529
9,618
9,734
BPCL
416
424
429
436
441
BHARTIARTL
510
516
522
528
534
BRITANNIA 3,469 3,542
3,584
3,657
3,699
CIPLA
780
796
806
822
832
COALINDIA
128
131
133
135
137
DIVISLAB 3,435 3,510
3,555
3,629
3,675
DRREDDY 4,383 4,450
4,489
4,557
4,595
EICHERMOT 2,526 2,583
2,618
2,675
2,711
GAIL
127
130
133
136
140
GRASIM 1,374 1,398
1,420
1,444
1,466
HCLTECH
951
973
987
1,010
1,023
HDFCBANK 1,478 1,516
1,539
1,577
1,600
HDFCLIFE
667
677
685
696
704
HDFC 2,531 2,568
2,593
2,630
2,654
HEROMOTOCO 2,893 2,928
2,952
2,988
3,012
HINDALCO
320
323
328
331
336
HINDUNILVR 2,296 2,347
2,377
2,428
2,458
ICICIBANK
578
585
589
596
600
IOC
89
90
91
92
93
INDUSINDBK
941
951
965
975
988
INFY 1,310 1,348
1,374
1,411
1,438
ITC
209
212
213
216
218
JSW STEEL
445
456
463
474
481
KOTAKBANK 1,759 1,770
1,786
1,797
1,813
LT 1,383 1,403
1,416
1,436
1,448
M&M
772
783
795
806
817
MARUTI 6,687 6,770
6,822
6,905
6,957
NESTLEIND 16,366
16,765
17,010
17,409
17,653
NTPC
103
105
107
109
111
ONGC
100
102
104
106
108
POWERGRID
212
217
220
225
228
RELIANCE 1,966 1,998
2,023
2,055
2,081
SBILIFE
861
866
874
879
887
SHREECEM 27,767
28,431
28,965
29,629
30,164
SBIN
352
357
360
365
368
SUNPHARMA
583
590
595
602
606
TCS 3,008 3,083
3,136
3,211
3,264
TATAMOTORS
288
293
297
301
306
TATASTEEL
764
782
796
814
828
TECHM
981
999
1,009
1,027
1,038
TITAN 1,489 1,520
1,542
1,573
1,595
ULTRACEMCO 6,673 6,729
6,802
6,858
6,931
UPL
574
601
618
645
662
WIPRO
399
409
415
424
430

www.angelbroking.com
Technical & Derivatives Report
March 31, 2021
*
Research Team Tel: 022 – 39357600 (Extn. 6844) Website: www.angelbroking.com
For Technical Queries E-mail: technicalresearch-cso@angelbroking.com
For Derivatives Queries E-mail: derivatives.desk@angelbroking.com
DISCLAIMER
Angel Broking Limited (hereinafter referred to as “Angel”) is a registered Member of National Stock Exchange of India Limited,
Bombay Stock Exchange Limited and Metropolitan Stock Exchange Limited. It is also registered as a Depository Participant with CDSL
and Portfolio Manager and Investment Adviser with SEBI. It also has registration with AMFI as a Mutual Fund Distributor. Angel
Broking Limited is a registered entity with SEBI for Research Analyst in terms of SEBI (Research Analyst) Regulations, 2014 vide
registration number INH000000164. Angel or its associates has not been debarred/ suspended by SEBI or any other regulatory
authority for accessing /dealing in securities Market. Angel or its associates/analyst has not received any compensation / managed
or co-managed public offering of securities of the company covered by Analyst during the past twelve months.
This document is solely for the personal information of the recipient, and must not be singularly used as the basis of any investment
decision. Nothing in this document should be construed as investment or financial advice. Each recipient of this document should
make such investigations as they deem necessary to arrive at an independent evaluation of an investment in the securities of the
companies referred to in this document (including the merits and risks involved), and should consult their own advisors to determine
the merits and risks of such an investment.
Reports based on technical and derivative analysis center on studying charts of a stock's price movement, outstanding positions and
trading volume, as opposed to focusing on a company's fundamentals and, as such, may not match with a report on a company's
fundamentals. Investors are advised to refer the Fundamental and Technical Research Reports available on our website to evaluate
the contrary view, if any.
The information in this document has been printed on the basis of publicly available information, internal data and other reliable
sources believed to be true, but we do not represent that it is accurate or complete and it should not be relied on as such, as this
document is for general guidance only. Angel Broking Limited or any of its affiliates/ group companies shall not be in any way
responsible for any loss or damage that may arise to any person from any inadvertent error in the information contained in this
report. Angel Broking Limited has not independently verified all the information contained within this document. Accordingly, we
cannot testify, nor make any representation or warranty, express or implied, to the accuracy, contents or data contained within this
document. While Angel Broking Limited endeavors to update on a reasonable basis the information discussed in this material, there
may be regulatory, compliance, or other reasons that prevent us from doing so.
This document is being supplied to you solely for your information, and its contents, information or data may not be reproduced,
redistributed or passed on, directly or indirectly.
Technical and Derivatives Team:
Sameet Chavan Chief Analyst - Technical & Derivatives sameet.chavan@angelbroking.com
Ruchit Jain Senior Analyst - Technical & Derivatives ruchit.jain@angelbroking.com
Rajesh Bhosale Technical Analyst rajesh.bhosle@angelbroking.com
Sneha Seth Derivatives Analyst sneha.seth@angelbroking.com
