www.angelbroking.com
Technical & Derivatives Report
July 30, 2020
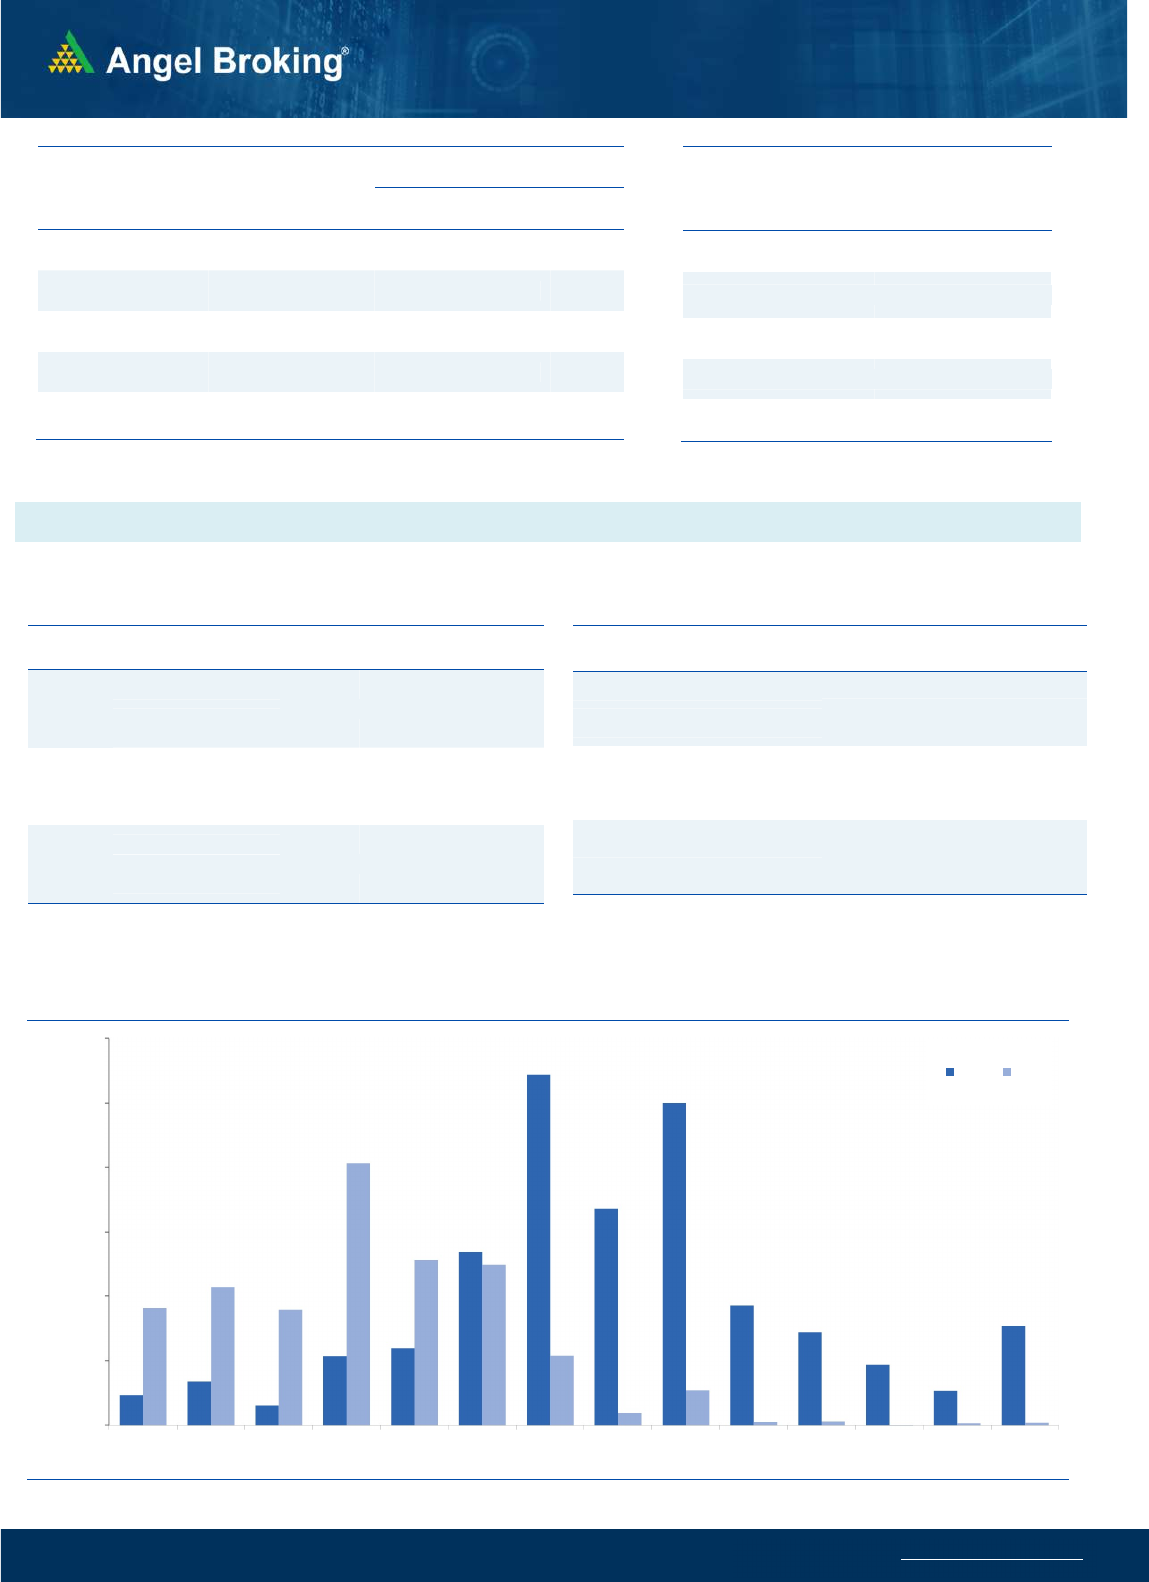
Nifty Bank Outlook - (22077)
Bank Nifty opened on a flat note and showed some
positive momentum to rally towards 22350. However, it gave up
the gains in the later part of the day and ended the session
marginally negative.
The index continues to trade in a Rising Channel and it has
pulled back higher from the support end in Tuesday's session.
Hence, till the Tuesday's low of 21600 is intact, we remain hopeful
of some pullback move within the channel. Thus traders are
advised to look for stock specific opportunities within this space.
The intraday supports are placed around 21870 and 21600
whereas resistances are seen around 22355 and 22550.
Key Levels
Support 1 – 21870 Resistance 1 – 22355
Support 2 – 21600 Resistance 2 – 22550
Exhibit 1: Nifty Daily Chart
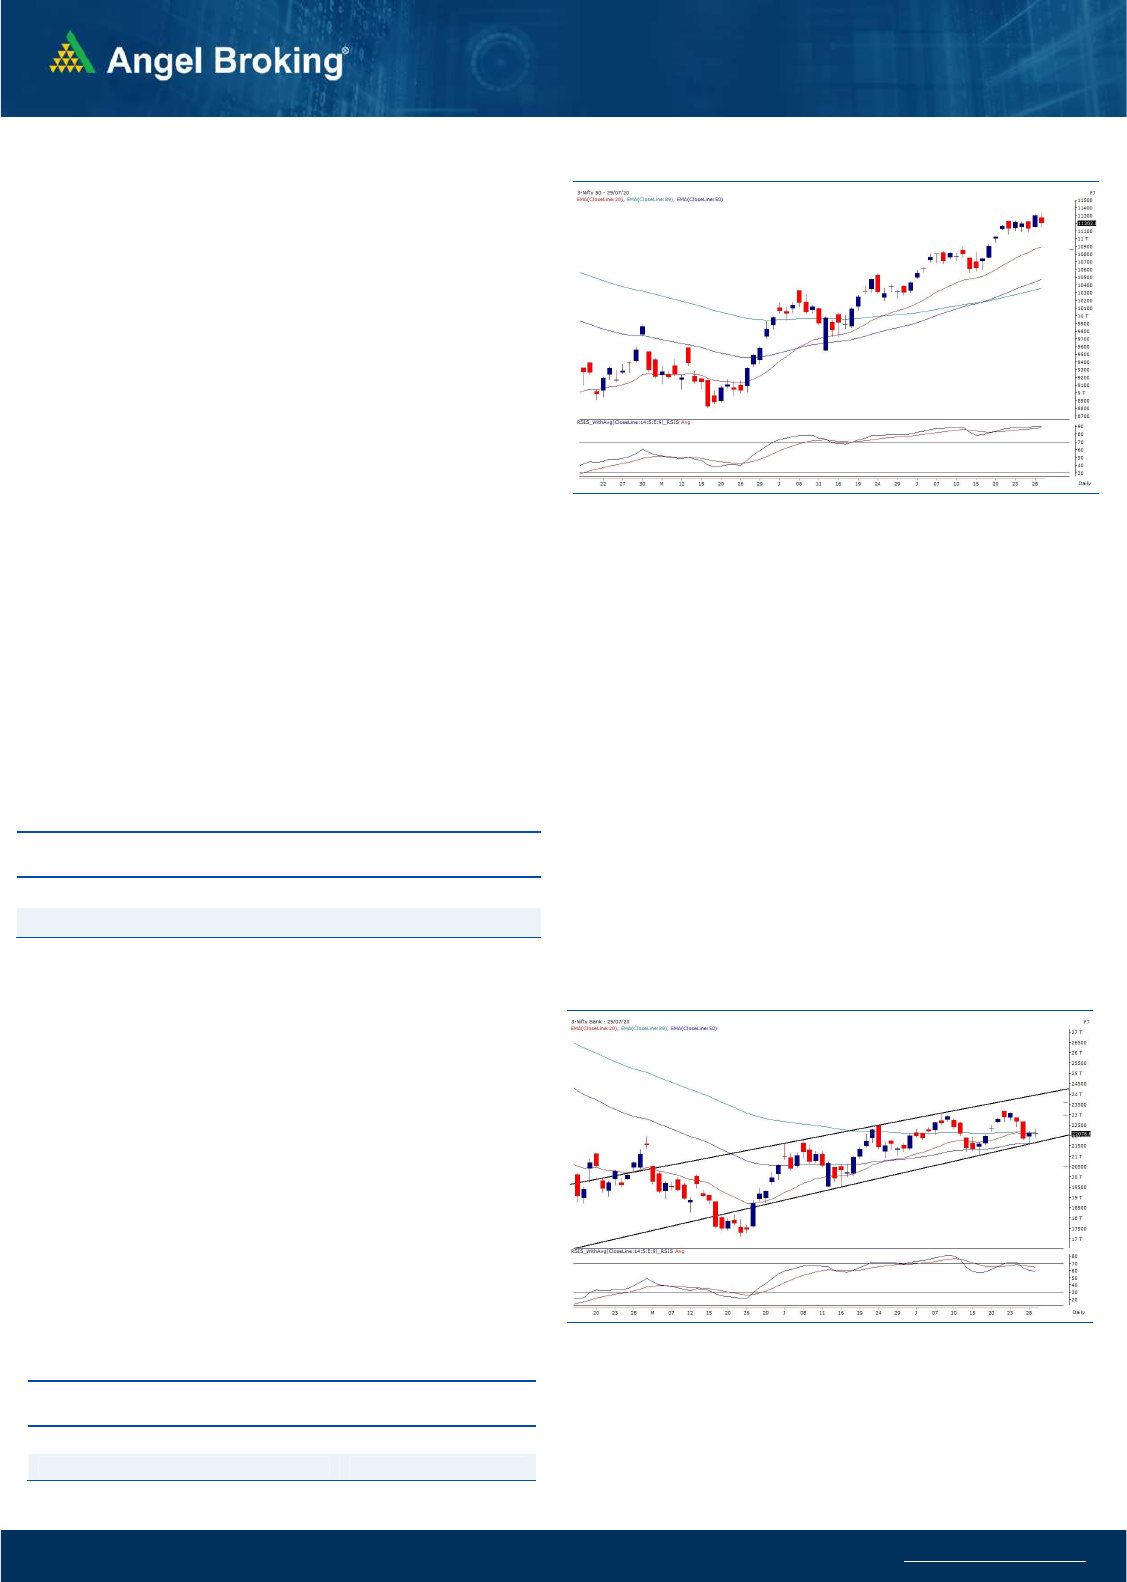
Sensex (38071) / Nifty (11203)
Tuesday's tail end surge was followed by a flat start yesterday. As
expected, in the initial trades, we witnessed a strong optimism to
head towards the 11350 mark. Subsequently, the index
consolidated with a hint of mild profit booking throughout the first
half. However, post the mid-session, the selling aggravated in some
of the heavyweights like Reliance, HDFC Bank, ICICI Bank and
selective IT names. This resulted in a sharp decline to sneak below
the 11200 mark. Due to some modest recovery at the end, the Nifty
ended the session with a cut of nearly 100 points.
Till the first half, things were very much on expected lines and
importantly, the banking space looked a bit firm. However, a strong
bout of profit taking in the latter half poured complete water on
Tuesday's smart move. Practically the 'Bullish Flag' mentioned
yesterday is still intact; but theoretically this price configuration does
not see any pull back move immediately. It is known for it's one way
move post the breakout. Hence, we do not want to give much
weightage to this pattern now. Yesterday, although the key levels
are still unbroken, but the way market dipped, it has shaken the
confidence of the bulls and we need to pay attention to this
behaviour now. Nifty has reached a cluster of resistance and hence
aggressive longs here are strictly avoided.
Key Levels
Support 1 – 11100 Resistance 1 – 11300
Support 2 – 11050 Resistance 2 – 11350
Exhibit 2: Nifty Bank Daily Chart
Going ahead, traders are advised to take one step at a time and
should follow strict stop losses for existing trades. Now, as far as
levels are concerned, for the coming session, 11150 followed by
11100 would be seen as a strong support zone and just to highlight,
a move below 11050 should be treated as a short term trend
reversal. On the flipside, 11300-11350 has become a strong
resistance zone. Only a move beyond these hurdles would extend
the rally in coming days. But for it to happen, banking space needs
to contribute heavily, otherwise, the possibility is very low. The only
encouraging thing in yesterday's session was the outperformance of
the midcap basket. Hence, one should focus on such potential
candidates.

www.angelbroking.com
Technical & Derivatives Report
July 30, 2020
Nifty Vs OI
10200
10400
10600
10800
11000
11200
11400
,0
2,000
4,000
6,000
8,000
10,000
12,000
14,000
16,000
7/10 7/14 7/16 7/20 7/22 7/24 7/28
(`000)
Openinterest Nifty
View
s
Nifty opened marginally lower but rallied from the
opening ticks in the first half an hour of trade. However,
it cooled off from the high of 11340 and corrected for
rest of the session to end tad above 11200.
FIIs were net sellers in the cash market segment to the
tune of Rs. 353 crores. In index futures, they sold worth
819 crores with rise in open interest by 23%, which
means mixed positions formed with more of shorts
.
Although Bank Nifty showed a relative outperformance,
it too gave up its intraday gains towards the end. Some
open interest addition was seen in both indices ahead
of the monthly expiry. FII's were net sellers in cash
segment while they formed mixed positions in index
futures. As the index failed to sustain above 11300,
writers added positions there thus forming resistance
for the expiry day. On the flip side, open interest
unwinding was seen in put options as the index
corrected. We may see some range bound activity on
the expiry day and hence, traders are advised to trade
according to intraday momentum.
C
o
mme
n
t
s
The Nifty futures open interest has increased by 6.97%
Bank Nifty futures open interest has increased by 5.34%
as market closed at 11202.85 levels.
The Nifty July future closed with a premium of 19.6 point
against a premium of 5.15 point in last trading session.
The August series closed at a premium of 18.45 point.
The INDIA VIX has increased from 23.64 to 24.11
At the same time, the PCR-OI of Nifty decreased from
1.83 to 1.41.
Few of the liquid counters where we have seen high cost
of carry are IDEA, EQUITAS, PNB, ZEEL and M&MFIN.
OI Gainers
SCRIP OI
OI
CHG. (%)
PRICE
PRICE
CHG. (%)
SAIL 44061000 17.60 35.45 -0.28
COLPAL 3160500 14.10 1447.75 4.00
SRF 778000 13.45 3934.80 4.32
NMDC 40193300 9.43 87.15 2.58
UBL 1304100 9.01 960.90 -0.95
APOLLOHOSP 1387500 7.73 1641.30 2.75
SRTRANSFIN 3074870 7.43 724.60 4.24
CUMMINSIND 2056800 6.26 400.65 -0.59
OI Losers
SCRIP OI
OI
CHG. (%)
PRICE
PRICE
CHG. (%)
JUSTDIAL 910000 -19.65 370.75 -0.21
DABUR 13485000 -16.47 489.60 3.00
CANBK 11235000 -15.49 100.25 -0.94
INDUSINDBK 26532000 -14.49 550.50 3.36
NCC 11781000 -13.02 30.05 -0.17
BATAINDIA 2586100 -12.85 1263.40 1.02
ASHOKLEY 48213000 -12.54 51.20 -0.19
KOTAKBANK 9782400 -11.47 1389.45 0.11
Put-Call Ratio
SCRIP PCR-OI PCR-VOL
NIFTY 1.41 0.95
BANKNIFTY 0.66 0.90
RELIANCE 0.84 0.70
ICICIBANK 0.41 0.29
INFY 1.27 0.72
Historical Volatility
SCRIP HV
DRREDDY 37.78
TATACHEM 44.64
COLPAL 42.93
GMRINFRA 54.41
DABUR 34.17
www.angelbroking.com
Technical & Derivatives Report
July 30, 2020
Note: Above mentioned Bullish or Bearish Spreads in Nifty (July Series) are given as an information and not as a recommendation.
Nifty Spot =
11202.85
FII Statistics for July 29, 2020
Detail Buy Sell Net
Open Interest
Contracts
Value
(in Cr.)
Change
(%)
INDEX
FUTURES
6791.93
7610.94
(819.01) 178649
13734.16
23.38
INDEX
OPTIONS
311578.03
311014.17
563.86
846441
65393.98
2.73
STOCK
FUTURES
31535.72
31828.10
(292.38) 1287335
89974.19
(1.59)
STOCK
OPTIONS
6088.68
6116.02
(27.34) 67201
4631.03
(11.02)
Total 355994.36
356569.23
(574.87) 2379626
173733.36
1.16
Turnover on July 29, 2020
Instrument
No. of
Contracts
Turnover
( in Cr. )
Change
(%)
Index Futures 6,52,483 45070.91 12.81
Index Options 2,94,17,932
19,93,876.20 35.80
Stock Futures 16,36,902 1,16,406.10 -2.54
Stock Options 13,71,283 1,07,583.74 -16.04
Total 3,30,78,600
22,62,936.95 28.88
Bull-Call Spreads
Action Strike Price Risk Reward BEP
Buy 11200 64.80
41.75 58.25 11241.75
Sell 11300 23.05
Buy 11200 64.80
57.30 142.70 11257.30
Sell 11400 7.50
Buy 11300 23.05
15.55 84.45 11315.55
Sell 11400 7.50
Bear-Put Spreads
Action Strike Price Risk Reward BEP
Buy 11200 40.40
25.85 74.15 11174.15
Sell 11100 14.55
Buy 11200 40.40
33.95 166.05 11166.05
Sell 11000 6.45
Buy 11100 14.55
8.10 91.90 11091.90
Sell 11000 6.45
Nifty Put-Call Analysis
,0
1000,000
2000,000
3000,000
4000,000
5000,000
6000,000
10700 10800 10900 11000 11100 11200 11300 11400 11500 11600 11700 11800 11900 12000
Call Put

www.angelbroking.com
Technical & Derivatives Report
July 30, 2020
Daily Pivot Levels for Nifty Constituents
Scrips
S2
S1
PIVOT
R1
R2
ADANIPORTS
306
310
317
321
328
ASIANPAINT 1,700 1,720
1,750
1,770
1,800
AXISBANK
428
434
441
447
453
BAJAJ-AUTO 3,042 3,070
3,110
3,139
3,178
BAJFINANCE 3,195 3,240
3,284
3,329
3,374
BAJAJFINSV 6,216 6,272
6,349
6,405
6,481
BPCL
435
445
456
465
477
BHARTIARTL
556
561
565
570
574
INFRATEL
186
191
195
201
205
BRITANNIA 3,736 3,765
3,809
3,838
3,882
CIPLA
654
667
676
690
699
COALINDIA
128
130
131
133
134
DRREDDY 3,977 4,140
4,238
4,400
4,498
EICHERMOT 20,634
21,017
21,284
21,667
21,933
GAIL
96
97
99
100
101
GRASIM
590
603
613
626
635
HCLTECH
681
688
699
706
717
HDFCBANK 1,037 1,051
1,070
1,084
1,103
HDFC 1,836 1,857
1,888
1,908
1,939
HEROMOTOCO
2,698
2,739
2,810
2,851
2,922
HINDALCO
160
162
165
167
170
HINDUNILVR 2,189 2,210
2,236
2,257
2,283
ICICIBANK
343
347
352
356
362
IOC
91
92
93
94
94
INDUSINDBK
517
534
549
566
582
INFY
936
945
953
962
969
ITC
191
194
196
199
201
JSW STEEL
210
214
217
221
225
KOTAKBANK 1,326 1,358
1,378
1,410
1,430
LT
903
913
927
936
950
M&M
586
596
610
620
634
MARUTI 6,024 6,104
6,200
6,280
6,376
NESTLEIND 16,081
16,339
16,769
17,028
17,458
NTPC
87
87
89
89
90
ONGC
78
79
80
80
81
POWERGRID
178
180
182
184
186
RELIANCE 2,004 2,050
2,117
2,163
2,229
SHREECEM 21,280
21,512
21,856
22,088
22,432
SBIN
183
187
191
195
199
SUNPHARMA
479
486
491
498
503
TCS 2,192 2,234
2,288
2,330
2,384
TATAMOTORS
103
104
106
108
110
TATASTEEL
347
360
369
383
392
TECHM
657
667
681
691
705
TITAN 1,017 1,029
1,048
1,059
1,078
ULTRACEMCO 4,075 4,128
4,208
4,261
4,340
UPL
443
453
458
468
473
VEDANTA
107
109
111
112
115
WIPRO
270
274
276
279
281
ZEEL
138
140
144
146
149

www.angelbroking.com
Technical & Derivatives Report
July 30, 2020
*
Research Team Tel: 022 – 39357600 (Extn. 6844) Website: www.angelbroking.com
For Technical & Derivatives Queries E-mail: technicalrese[email protected]
DISCLAIMER
Angel Broking Limited (hereinafter referred to as “Angel”) is a registered Member of National Stock Exchange of India Limited, Bombay
Stock Exchange Limited and Metropolitan Stock Exchange Limited. It is also registered as a Depository Participant with CDSL and
Portfolio Manager and Investment Adviser with SEBI. It also has registration with AMFI as a Mutual Fund Distributor. Angel Broking
Limited is a registered entity with SEBI for Research Analyst in terms of SEBI (Research Analyst) Regulations, 2014 vide registration
number INH000000164. Angel or its associates has not been debarred/ suspended by SEBI or any other regulatory authority for
accessing /dealing in securities Market. Angel or its associates/analyst has not received any compensation / managed or co-managed
public offering of securities of the company covered by Analyst during the past twelve months.
This document is solely for the personal information of the recipient, and must not be singularly used as the basis of any investment
decision. Nothing in this document should be construed as investment or financial advice. Each recipient of this document should make
such investigations as they deem necessary to arrive at an independent evaluation of an investment in the securities of the companies
referred to in this document (including the merits and risks involved), and should consult their own advisors to determine the merits
and risks of such an investment.
Reports based on technical and derivative analysis center on studying charts of a stock's price movement, outstanding positions and
trading volume, as opposed to focusing on a company's fundamentals and, as such, may not match with a report on a company's
fundamentals. Investors are advised to refer the Fundamental and Technical Research Reports available on our website to evaluate the
contrary view, if any.
The information in this document has been printed on the basis of publicly available information, internal data and other reliable
sources believed to be true, but we do not represent that it is accurate or complete and it should not be relied on as such, as this
document is for general guidance only. Angel Broking Limited or any of its affiliates/ group companies shall not be in any way
responsible for any loss or damage that may arise to any person from any inadvertent error in the information contained in this report.
Angel Broking Limited has not independently verified all the information contained within this document. Accordingly, we cannot
testify, nor make any representation or warranty, express or implied, to the accuracy, contents or data contained within this document.
While Angel Broking Limited endeavors to update on a reasonable basis the information discussed in this material, there may be
regulatory, compliance, or other reasons that prevent us from doing so.
This document is being supplied to you solely for your information, and its contents, information or data may not be reproduced,
redistributed or passed on, directly or indirectly.
Technical and Derivatives Team:
Sameet Chavan Chief Analyst - Technical & Derivatives sameet.chavan@angelbroking.com
Ruchit Jain Senior Analyst - Technical & Derivatives ruchit.jain@angelbroking.com
Rajesh Bhosale Technical Analyst rajesh.bhosle@angelbroking.com
Sneha Seth Derivatives Analyst sneha.seth@angelbroking.com
