www.angelbroking.com
Technical & Derivatives Report
July 29, 2020
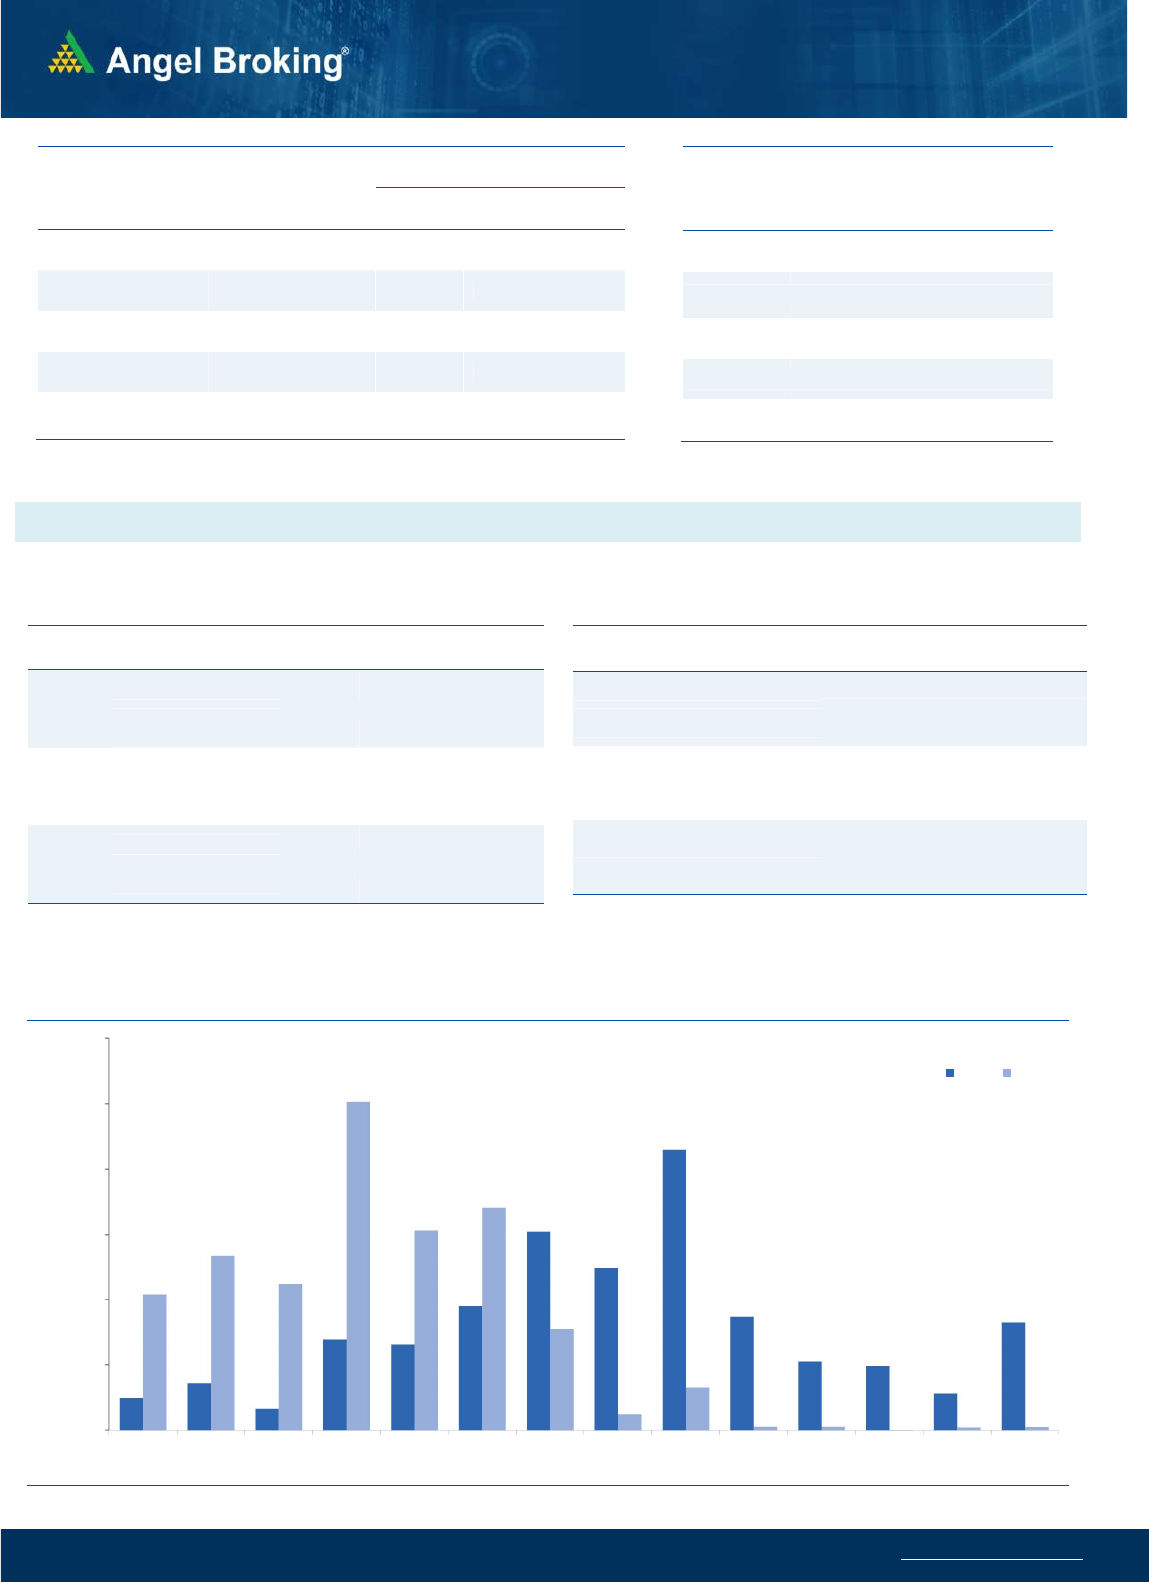
Nifty Bank Outlook - (22105)
Post opening on a positive note, Bank Nifty corrected in the first
hour of trade and traded with negative bias to register a low tad
above 21600. It then gradually recovered and rallied in the later
part of the day to end with gains of over a percent on yesterday's
close.
As mentioned in our previous report, the Bank nifty is seen trading
within a 'Rising Çhannel' and it recovered from the support end of
the pattern in yesterday's session, which is a positive sign. As far
as this support at 21500-21600 is intact, we expect the index to
again head towards the recent swing high. Thus, traders are
advised to look for buying opportunities within this space from a
near term perspective and trade with a positive bias. The intraday
supports for the index are placed around 21850 followed by
21600-21500 range; whereas resistances are seen around 22350
and 22600.
Key Levels
Support 1 – 21850 Resistance 1 – 22350
Support 2 – 21500 Resistance 2 – 22600
Exhibit 1: Nifty Daily Chart
Se
nsex
(
38493)
/ Nifty
(
11301
)
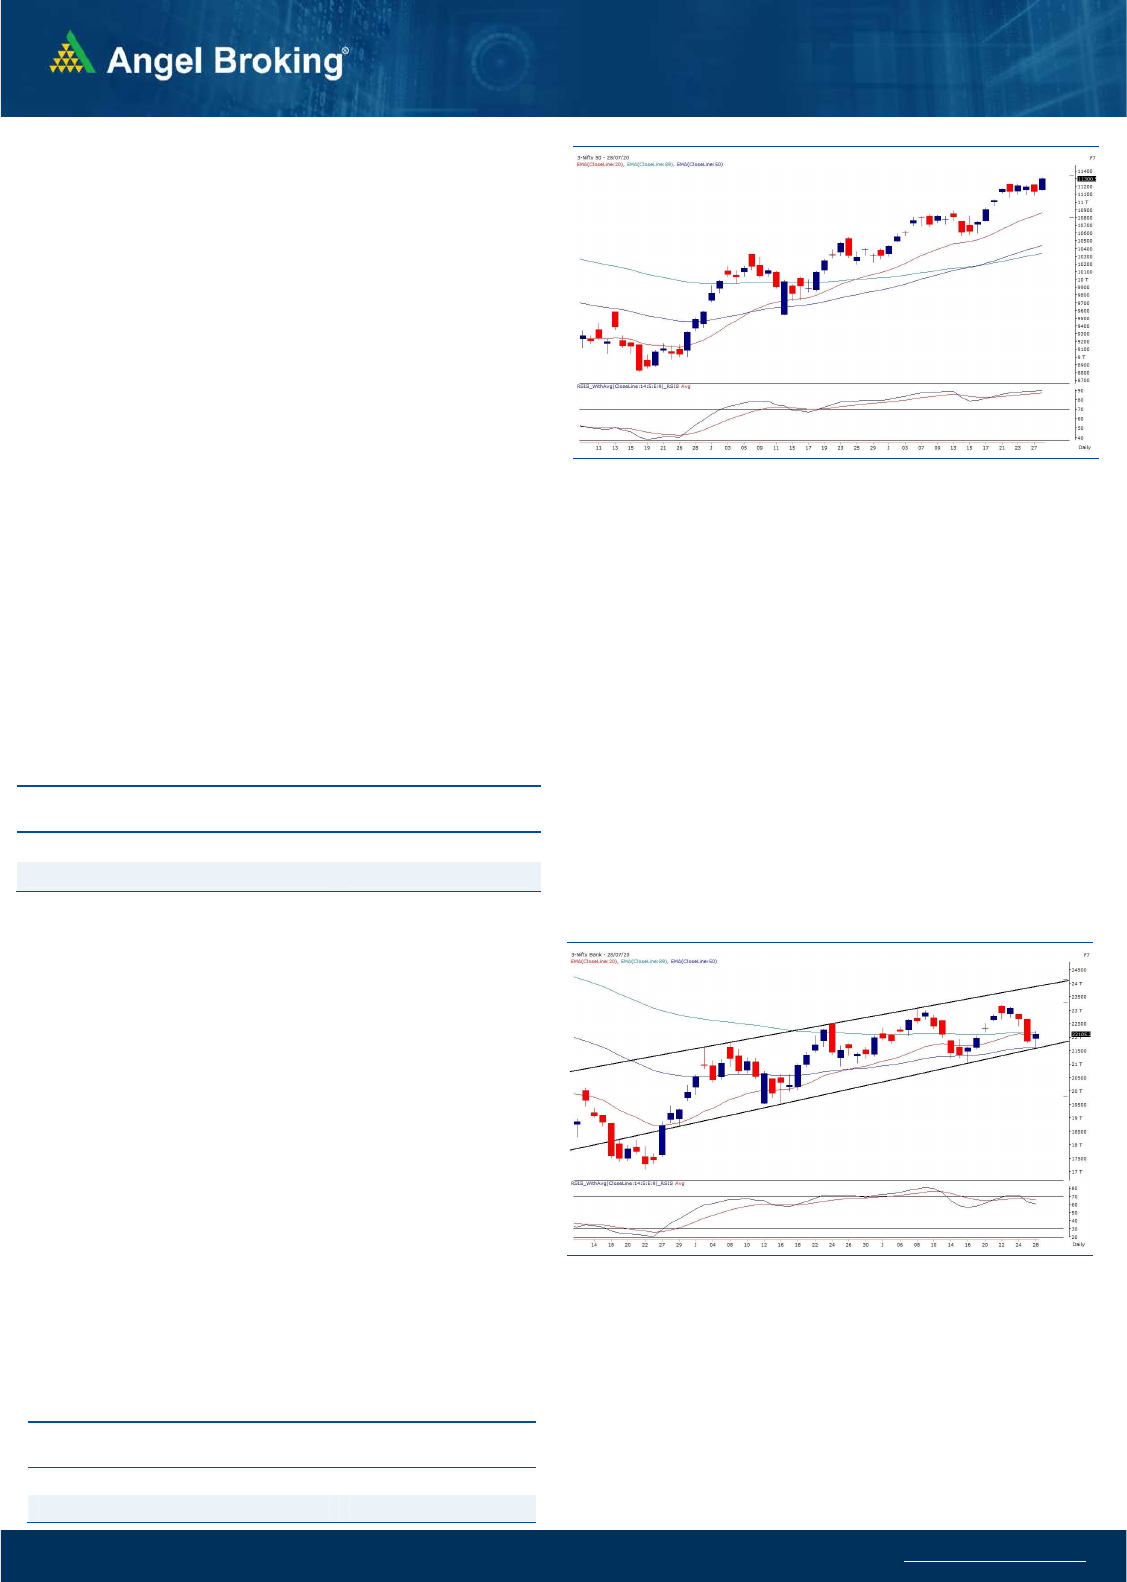
Yesterday too our markets opened higher as indicated by the SGX
Nifty; but unlike Monday, the lead was there to stay this time. After
a positive start, markets extended gains in the initial hour; but all of
a sudden, the banking index once again took a nosedive, resulted in
erasing of some gains in benchmark. However, post the midsession,
the entire market just took off and the smart recovery in banking
space added fuel to the spectacular rally to eventually reclaim the
11300 mark for the first time in last four months.
Yesterday, we had mentioned about Nifty showing the sheer
outperformance and banking being the weakest link. The similar
trend was followed yesterday too, but this time, the Bank Nifty
showed some encouraging signs. As far as Nifty is concerned, we
finally witnessed a breakout beyond 11200-11250, which confirmed
a ‘Bullish Flag’ pattern on intraday time frame. The way charts are
shaped up, we expect the extension towards 11350-11400 in
coming trading session. If banks manage to participate in the similar
way, a move beyond 11400 also cannot be ruled out.
Traders are advised to stay positive and a decline towards 11250-
11200 should now be treated as a buying opportunity. Mostly we
see Bank Nifty influencing the move in Nifty but yesterday it
appeared as if the strength in Nifty pulled the Bank Nifty higher.
Key Levels
Support 1 – 11250 Resistance 1 – 11350
Support 2 – 11200 Resistance 2 – 11400
Exhibit 2: Nifty Bank Daily Chart

www.angelbroking.com
Technical & Derivatives Report
July 29, 2020
Nifty Vs OI
10200
10400
10600
10800
11000
11200
11400
,0
2,000
4,000
6,000
8,000
10,000
12,000
14,000
16,000
7/107/137/147/157/167/177/207/217/227/237/247/277/28
(`000)
Openinterest Nifty
View
s
The Nifty index surpassed the recent consolidation high
to end at 11300 and the Bank Nifty too recovered from
the lows and ended above 22100.
FIIs were net buyers in the cash market segment to the
tune of Rs. 246 crores. In index futures, they bought
worth 993 crores with increase in open interest
indicating longs created in yesterday’s upmove
.
Nifty witnessed formation of some long positions
whereas short covering was seen in the banking index.
FII's formed long positions in the index futures segment.
In options segment, call writers of 11200 strike ran to
cover their positions as the index surpassed its recent
hurdle whereas fresh writing was seen in 11200-11150
put options, thus shifting the support higher for the
expiry. The above data indicates probability of some
further momentum as we approach the expiry day and
hence, traders are advised to use intraday dips to buy
at-the-money call option.
C
o
mme
n
t
s
The Nifty futures open interest has increased by 1.81%
Bank Nifty futures open interest has decreased by 7.12%
as market closed at 11300.55 levels.
The Nifty July future closed with a premium of 5.15 point
against a discount of 9.35 point in last trading session.
The August series closed at a premium of 4.4 point.
The INDIA VIX has decreased from 25.01 to 23.64
At the same time, the PCR-OI of Nifty increased from 1.49
to 1.83.
Few of the liquid counters where we have seen high cost
of carry are INDUSINDBK, GMRINFRA, IBULHSGFIN,
CANBK AND BHEL.
OI Gainers
SCRIP OI
OI
CHG. (%)
PRICE
PRICE
CHG. (%)
NIITTECH 569625 28.95 1767.35 -0.84
UBL 1196300 21.90 970.10 -1.33
GODREJPROP 429000 21.10 879.80 1.14
TATAPOWER 66906000 20.61 49.15 -0.61
APOLLOHOSP 1288000 16.83 1599.25 5.14
ASHOKLEY 55125000 13.66 51.15 4.15
RAMCOCEM 1707650 12.87 714.50 4.43
ICICIBANK 137667750 10.07 352.10 -1.64
OI Losers
SCRIP OI
OI
CHG. (%)
PRICE
PRICE
CHG. (%)
CANBK 13295000 -18.76 100.40 4.44
NCC 13545000 -17.20 30.00 0.84
SAIL 37468000 -15.69 35.55 4.39
BHEL 42693000 -14.07 37.45 3.58
GMRINFRA 110610000 -12.65 23.45 9.72
BAJFINANCE 7067000 -11.69 3239.60 2.60
ADANIENT 16596000 -11.04 173.55 5.36
UJJIVAN 3537600 -10.27 237.60 4.78
Put-Call Ratio
SCRIP PCR-OI PCR-VOL
NIFTY 1.83 0.92
BANKNIFTY 0.69 0.76
RELIANCE 0.99 0.62
ICICIBANK 0.38 0.35
INFY 1.30 0.61
Historical Volatility
SCRIP HV
GMRINFRA 54.17
ULTRACEMCO 48.73
TCS 42.01
APOLLOHOSP 56.21
MARICO 33.14
www.angelbroking.com
Technical & Derivatives Report
July 29, 2020
Note: Above mentioned Bullish or Bearish Spreads in Nifty (July Series) are given as an information and not as a recommendation.
Nifty Spot =
11300.55
FII Statistics for July 28, 2020
Detail Buy Sell Net
Open Interest
Contracts
Value
(in Cr.)
Change
(%)
INDEX
FUTURES
6213.98
5220.88
993.10
144798
11095.77
13.33
INDEX
OPTIONS
213981.26
214550.11
(568.85) 823919
63965.90
6.06
STOCK
FUTURES
40137.24
39774.42
362.82
1308103
91550.47
(3.06)
STOCK
OPTIONS
5638.79
5690.49
(51.70) 75524
5280.31
(8.90)
Total 265971.27
265235.90
735.37
2352344
171892.45
0.66
Turnover on July 28, 2020
Instrument
No. of
Contracts
Turnover
( in Cr. )
Change
(%)
Index Futures 5,99,921 39954.29 14.74
Index Options 2,18,48,918
14,68,281.83 40.29
Stock Futures 17,12,227 1,19,443.51 15.41
Stock Options 16,83,958 1,28,138.40 -4.41
Total 2,58,45,024
17,55,818.03 33.12
Bull-Call Spreads
Action Strike Price Risk Reward BEP
Buy 11100 106.10
47.45 52.55 11147.45
Sell 11200 58.65
Buy 11100 106.10
77.00 123.00 11177.00
Sell 11300 29.10
Buy 11200 58.65
29.55 70.45 11229.55
Sell 11300 29.10
Bear-Put Spreads
Action Strike Price Risk Reward BEP
Buy 11100 82.90
35.85 64.15 11064.15
Sell 11000 47.05
Buy 11100 82.90
56.20 143.80 11043.80
Sell 10900 26.70
Buy 11000 47.05
20.35 79.65 10979.65
Sell 10900 26.70
Nifty Put-Call Analysis
,0
1000,000
2000,000
3000,000
4000,000
5000,000
6000,000
10700 10800 10900 11000 11100 11200 11300 11400 11500 11600 11700 11800 11900 12000
Call Put

www.angelbroking.com
Technical & Derivatives Report
July 29, 2020
Daily Pivot Levels for Nifty Constituents
Scrips
S2
S1
PIVOT
R1
R2
ADANIPORTS
304
311
316
323
328
ASIANPAINT 1,726 1,743
1,768
1,785
1,809
AXISBANK
418
428
434
443
449
BAJAJ-AUTO 2,977 3,048
3,089
3,160
3,201
BAJFINANCE 3,121 3,181
3,220
3,279
3,319
BAJAJFINSV 6,088 6,215
6,301
6,429
6,515
BPCL
447
454
464
471
481
BHARTIARTL
546
555
565
574
584
INFRATEL
184
187
191
194
198
BRITANNIA 3,723 3,749
3,789
3,815
3,856
CIPLA
636
649
658
671
679
COALINDIA
128
129
130
131
132
DRREDDY 3,966 4,008
4,050
4,093
4,135
EICHERMOT 20,306
20,679
20,924
21,298
21,542
GAIL
96
97
98
99
100
GRASIM
553
575
586
608
619
HCLTECH
688
700
708
720
728
HDFCBANK 1,045 1,066
1,080
1,101
1,115
HDFC 1,820 1,859
1,883
1,921
1,945
HEROMOTOCO
2,707
2,774
2,812
2,879
2,917
HINDALCO
156
160
163
167
170
HINDUNILVR 2,199 2,221
2,233
2,255
2,267
ICICIBANK
333
343
353
362
372
IOC
91
92
94
95
96
INDUSINDBK
505
516
522
534
540
INFY
931
947
957
973
984
ITC
193
194
196
198
200
JSW STEEL
204
210
213
218
221
KOTAKBANK 1,286 1,335
1,368
1,417
1,451
LT
892
903
910
921
928
M&M
575
597
612
635
649
MARUTI 5,922 6,103
6,211
6,392
6,501
NESTLEIND 16,726
16,911
17,193
17,377
17,660
NTPC
86
87
88
89
90
ONGC
78
79
80
81
82
POWERGRID
177
179
181
184
185
RELIANCE 2,131 2,154 2,1
74
2,198
2,217
SHREECEM 20,772
21,344
21,682
22,254
22,592
SBIN
184
187
189
191
193
SUNPHARMA
469
476
480
486
490
TCS 2,177 2,243
2,282
2,348
2,387
TATAMOTORS
100
103
105
108
110
TATASTEEL
350
354
357
361
364
TECHM
649
667
685
702
720
TITAN 1,019 1,036
1,045
1,062
1,072
ULTRACEMCO 3,720 3,928
4,071
4,279
4,421
UPL
437
443
447
453
458
VEDANTA
109
110
111
112
113
WIPRO
266
271
274
278
281
ZEEL
138
141
145
148
151

www.angelbroking.com
Technical & Derivatives Report
July 29, 2020
*
Research Team Tel: 022 – 39357600 (Extn. 6844) Website: www.angelbroking.com
For Technical & Derivatives Queries E-mail: technicalrese[email protected]
DISCLAIMER
Angel Broking Limited (hereinafter referred to as “Angel”) is a registered Member of National Stock Exchange of India Limited, Bombay
Stock Exchange Limited and Metropolitan Stock Exchange Limited. It is also registered as a Depository Participant with CDSL and
Portfolio Manager and Investment Adviser with SEBI. It also has registration with AMFI as a Mutual Fund Distributor. Angel Broking
Limited is a registered entity with SEBI for Research Analyst in terms of SEBI (Research Analyst) Regulations, 2014 vide registration
number INH000000164. Angel or its associates has not been debarred/ suspended by SEBI or any other regulatory authority for
accessing /dealing in securities Market. Angel or its associates/analyst has not received any compensation / managed or co-managed
public offering of securities of the company covered by Analyst during the past twelve months.
This document is solely for the personal information of the recipient, and must not be singularly used as the basis of any investment
decision. Nothing in this document should be construed as investment or financial advice. Each recipient of this document should make
such investigations as they deem necessary to arrive at an independent evaluation of an investment in the securities of the companies
referred to in this document (including the merits and risks involved), and should consult their own advisors to determine the merits
and risks of such an investment.
Reports based on technical and derivative analysis center on studying charts of a stock's price movement, outstanding positions and
trading volume, as opposed to focusing on a company's fundamentals and, as such, may not match with a report on a company's
fundamentals. Investors are advised to refer the Fundamental and Technical Research Reports available on our website to evaluate the
contrary view, if any.
The information in this document has been printed on the basis of publicly available information, internal data and other reliable
sources believed to be true, but we do not represent that it is accurate or complete and it should not be relied on as such, as this
document is for general guidance only. Angel Broking Limited or any of its affiliates/ group companies shall not be in any way
responsible for any loss or damage that may arise to any person from any inadvertent error in the information contained in this report.
Angel Broking Limited has not independently verified all the information contained within this document. Accordingly, we cannot
testify, nor make any representation or warranty, express or implied, to the accuracy, contents or data contained within this document.
While Angel Broking Limited endeavors to update on a reasonable basis the information discussed in this material, there may be
regulatory, compliance, or other reasons that prevent us from doing so.
This document is being supplied to you solely for your information, and its contents, information or data may not be reproduced,
redistributed or passed on, directly or indirectly.
Technical and Derivatives Team:
Sameet Chavan Chief Analyst - Technical & Derivatives sameet.chavan@angelbroking.com
Ruchit Jain Senior Analyst - Technical & Derivatives ruchit.jain@angelbroking.com
Rajesh Bhosale Technical Analyst rajesh.bhosle@angelbroking.com
Sneha Seth Derivatives Analyst sneha.seth@angelbroking.com
