Technical & Derivatives Report
September 28, 2018
Sensex (36324) / Nifty (10978)
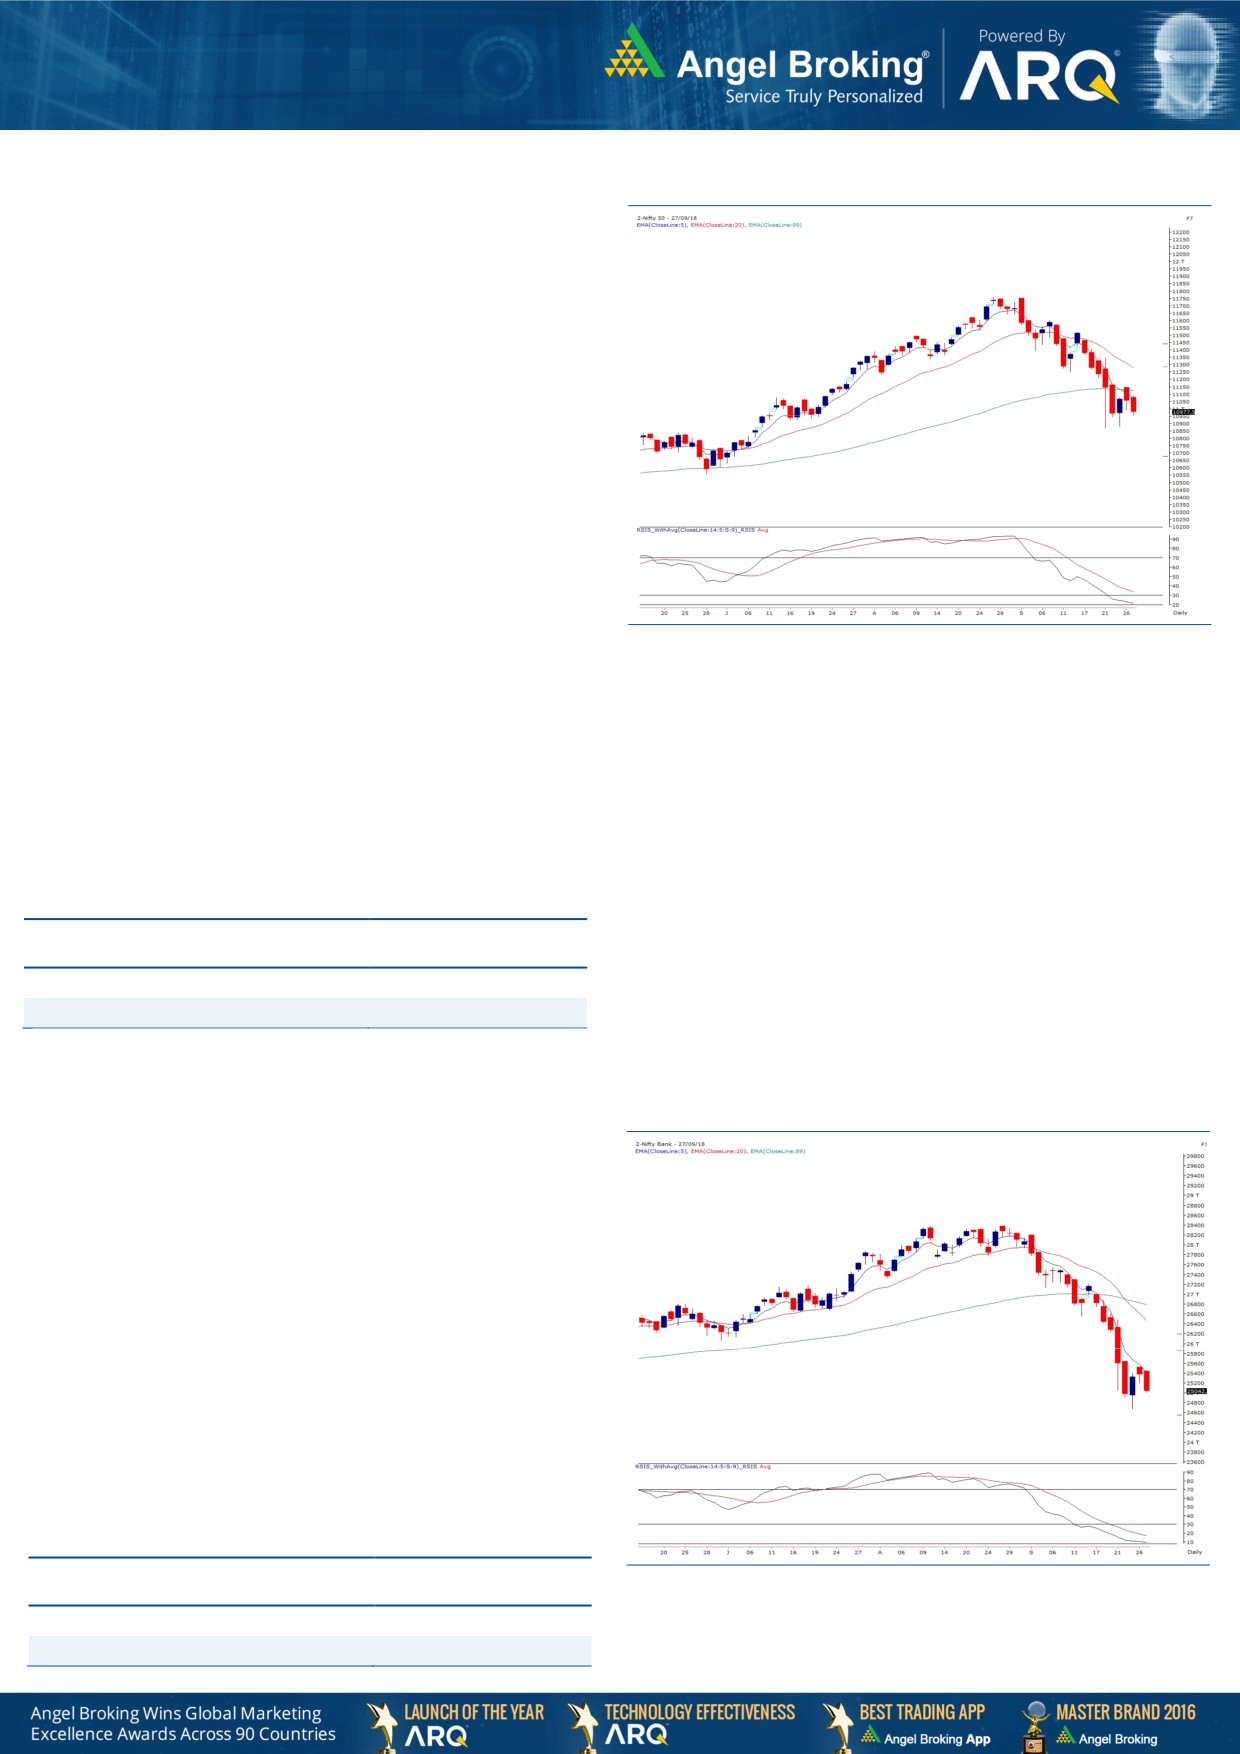
Exhibit 1: Nifty Daily Chart
We opened slightly higher very much in line with the SGX Nifty;
but once again it turned out to be a formality. After some initial
consolidation, the index eventually started correcting and in fact
the momentum accelerated as the day progressed. In the second
half, the index eventually slipped below its important
psychological support of 11000 and then remained stagnant in
the last hour of the day.
There has been no stopping for the recent onslaught started a
week back. Although, index has been consolidating in a range
since last four days, look at the kind of destruction some of the
individual stocks have seen meanwhile; it’s quite intimidating.
Such times are extremely difficult to trade or participate in the
market and hence, our advice is to stay light and follow strict stop
losses for existing positions. As far as index is concerned, 11035
followed by 11090 are likely to be seen as immediate hurdles;
whereas, on the downside, a sustainable move below 10953
would extend the correction towards 10910 - 10882 levels.
Despite this carnage in the broader market, ‘Metal’ stocks
continue to show the outperformance and hence, it’s advisable to
focus on such propositions rather than trying to catch some
falling knives. Also, the ‘OMC’ pack showed some encouraging
signs in the latter half today, which we believe may provide better
trading opportunities going ahead.
Key Levels
Support 1 - 10953
Resistance 1 -
11035
Support 2 - 10882
Resistance 2 -
11090
Nifty Bank Outlook - (25042)
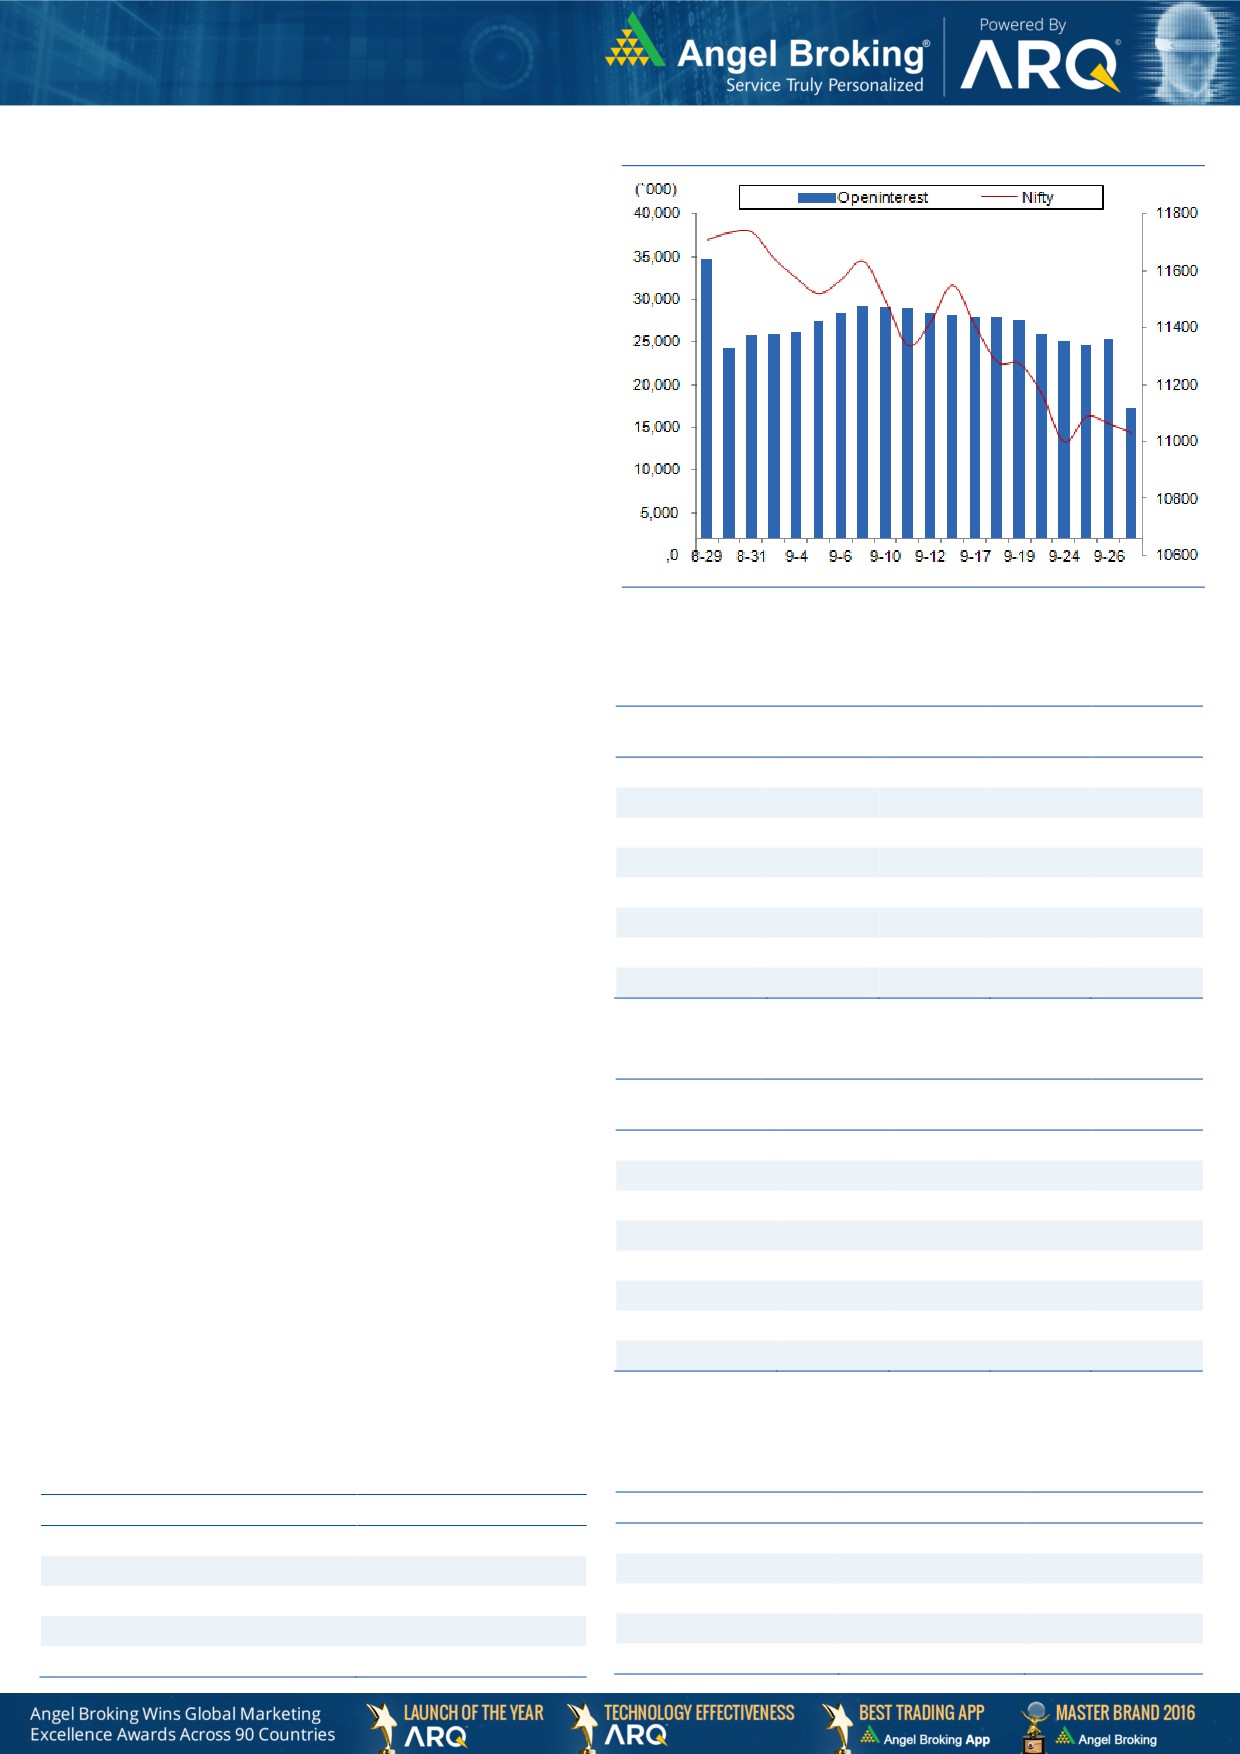
Exhibit 2: Nifty Bank Daily Chart
The Nifty Bank index opened on a flat note in yesterday's session.
However, it seemed just a formality as the index started correcting
right from the word go and remained under pressure throughout
the session. The index eventually ended the day tad above the
25000 mark, registering a loss of more than 300 points.
As mentioned in our previous article, the up move of last couple
of sessions just seemed to be a pullback move owing to the
oversold momentum readings. The index resumed its downtrend
yesterday and formed another large bearish candle. Hence, we
continue with our negative stance on the banking and financial
sector and in line with our recent advice, traders should still avoid
any bottom fishing in this space. The intraday support for the
index is placed in the range of 24760-24670 whereas resistance
is seen in the range of 25450-25525.
Key Levels
Support 1 - 24760
Resistance 1 -
25450
Support 2 - 24670
Resistance 2 - 25525
Technical & Derivatives Report
September 28, 2018
Comments
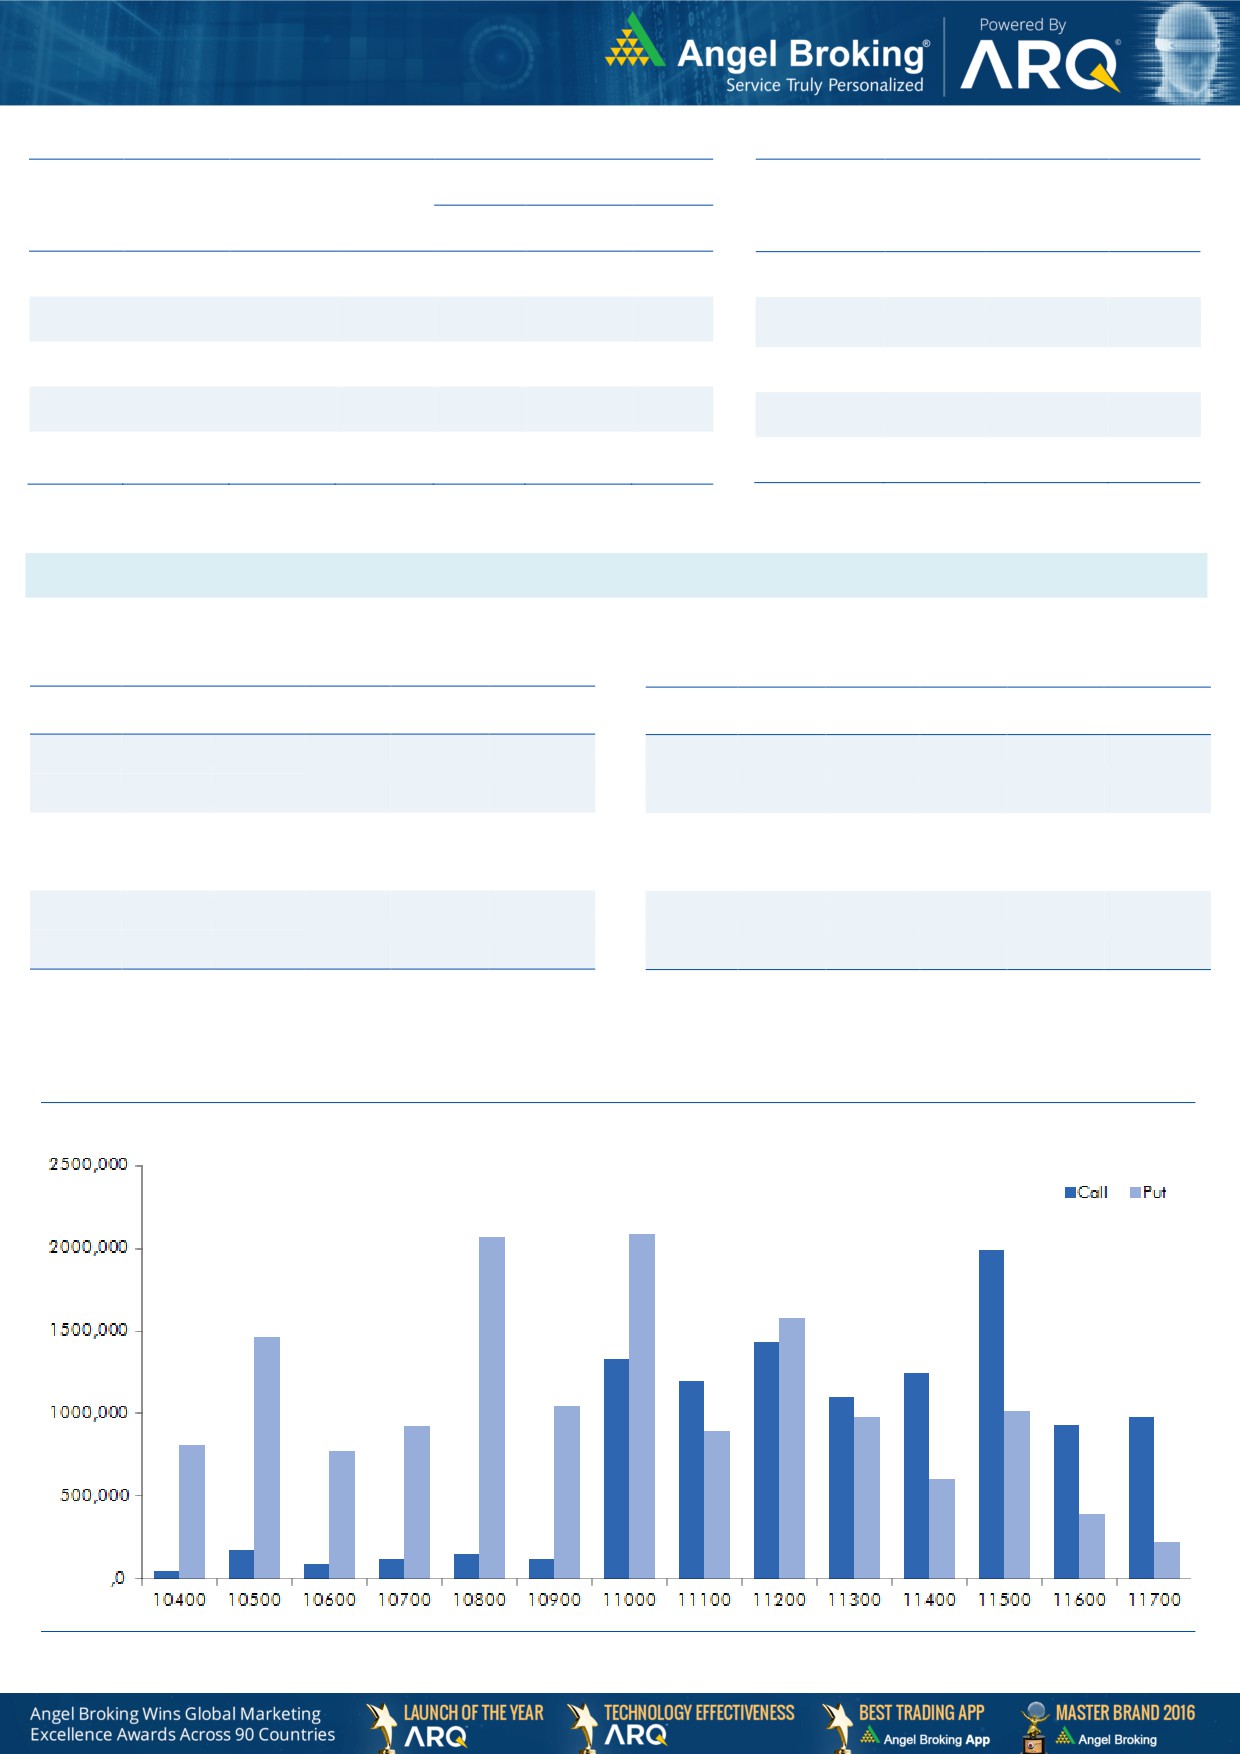
Nifty Vs OI
The Nifty futures open interest has decreased by 32.24%
Bank Nifty futures open interest has decreased by
28.44% as market closed at 10977.55 levels.
The Nifty October future closed with a premium of 52.95
points against a premium of 56.75 points in last trading
session. The November series closed at a premium of
90.75 points.
The INDIA VIX has decreased from 17.08 to 16.92.
At the same time, the PCR-OI of Nifty has increased from
1.09 to 1.35.
Few of the liquid counters where we have seen high cost
of carry are SUZLON, SOUTHBANK, GODREJCP,
INFIBEAM and SRTRANSFIN.
Views
FIIs were net buyers in cash market segment to the tune
of Rs. 552 crores. At the same time, they sold worth
OI Gainers
Rs. 1536 crores in index futures with massive fall in open
OI
PRICE
SCRIP
OI
PRICE
CHG. (%)
CHG. (%)
interest, mainly due to expiry.
NIITTECH
1770000
10.38
1119.30
-4.09
In options front, they sold worth Rs. 383 crores with fall
DCBBANK
5305500
2.43
150.20
-6.02
in open interest. As far as Nifty options activities are
APOLLOTYRE
12978000
1.93
222.05
-2.80
considered, being start of the new series the overall
build-up remained quite scattered between
11000-
11800 call and 10000-11000 put options. Maximum
open interest for October series now stood at 11500
followed by 11200 call and 11000 followed by 10800
put options.
Once again we witnessed selling pressure post positive
opening to conclude September series tad below 11000
OI Losers
mark. Despite being a volatile series, we hardly saw any
OI
PRICE
meaningful open interest activity in index futures; in fact,
SCRIP
OI
PRICE
CHG. (%)
CHG. (%)
OI plunged 30% series on series. Rollover in Nifty is at
HEROMOTOCO
1044000
-42.28
3088.10
-0.01
62.51%, which is on the lower side in terms of both
INFRATEL
4127600
-37.66
267.85
2.60
percentage as well as OI. Now, we are starting October
INFY
25678800
-37.07
724.80
0.95
series with lowest base post September 2017. Due to the
OFSS
340200
-34.07
3983.90
0.14
massive fall in index; the volatility index has also surged
HDFCBANK
12646500
-31.82
1976.15
0.46
above 16.50 and this is certainly not a good indication.
RAMCOCEM
688800
-29.83
650.50
-0.82
Considering the rollover data, we would advise trader
JPASSOCIAT
107168000
-28.98
7.45
0.00
being light in index and adopting stock centric approach
TCS
6689000
-27.86
2188.85
2.14
for the time being.
Historical Volatility
Put-Call Ratio
SCRIP
HV
SCRIP
PCR-OI
PCR-VOL
SREINFRA
116.33
NIFTY
1.35
0.95
VOLTAS
47.91
BANKNIFTY
0.72
0.64
IDBI
56.67
RELIANCE
0.64
0.50
UJJIVAN
64.51
ICICIBANK
0.73
0.57
SOUTHBANK
57.14
INFY
0.61
0.39
Technical & Derivatives Report
September 28, 2018
FII Statistics for September 27, 2018
Turnover on September 27, 2018
Open Interest
No. of
Turnover
Change
Detail
Buy
Sell
Net
Instrument
Value
Change
Contracts
( in Cr. )
(%)
Contracts
(in Cr.)
(%)
INDEX
INDEX
10788.66
12324.24
(1535.58)
205990
16814.01
(37.56)
539509
47571.57
24.34
FUTURES
FUTURES
INDEX
INDEX
184121.46
184504.14
(382.68)
624754
53143.03
(44.89)
17258067
1641397.58
64.62
OPTIONS
OPTIONS
STOCK
28666.30
27886.16
780.14
1153404
79859.74
(11.91)
STOCK
FUTURES
2157195
135892.06
3.15
FUTURES
STOCK
STOCK
5108.55
5150.50
(41.95)
9289
648.35
(93.37)
1022837
70037.35
11.51
OPTIONS
OPTIONS
Total
228684.97
229865.03
(1180.07)
1993437
150465.13
(31.56)
TOTAL
20977608
1894898.56
54.07
Nifty Spot = 10977.55
Bull-Call Spreads
Bear-Put Spreads
Action
Strike
Price
Risk
Reward
BEP
Action
Strike
Price
Risk
Reward
BEP
Buy
11000
265.80
Buy
11000
154.05
61.90
38.10
11061.90
29.60
70.40
10970.40
Sell
11100
203.90
Sell
10900
124.45
Buy
11000
265.80
Buy
11000
154.05
116.50
83.50
11116.50
53.40
146.60
10946.60
Sell
11200
149.30
Sell
10800
100.65
Buy
11100
203.90
Buy
10900
124.45
54.60
45.40
11154.60
23.80
76.20
10876.20
Sell
11200
149.30
Sell
10800
100.65
Note: Above mentioned Bullish or Bearish Spreads in Nifty (October Series) are given as an information and not as a recommendation.
Nifty Put-Call Analysis
Technical & Derivatives Report
September 28, 2018
Daily Pivot Levels for Nifty Constituents
Scrips
S2
S1
PIVOT
R1
R2
ADANIPORTS
322
329
337
343
352
ASIANPAINT
1,255
1,271
1,293
1,309
1,330
AXISBANK
583
592
606
614
628
BAJAJ-AUTO
2,722
2,753
2,789
2,820
2,857
BAJFINANCE
2,109
2,156
2,240
2,288
2,371
BAJAJFINSV
5,773
5,877
6,058
6,162
6,343
BPCL
361
367
371
376
380
BHARTIARTL
350
353
358
362
367
INFRATEL
251
259
265
274
279
CIPLA
643
651
664
672
685
COALINDIA
268
272
275
279
282
DRREDDY
2,472
2,507
2,563
2,598
2,655
EICHERMOT
24,024
24,463
25,040
25,479
26,056
GAIL
366
372
381
386
395
GRASIM
986
1,006
1,036
1,056
1,086
HCLTECH
1,079
1,086
1,095
1,102
1,111
HDFCBANK
1,942
1,959
1,972
1,990
2,003
HDFC
1,699
1,714
1,741
1,756
1,784
HEROMOTOCO
3,042
3,065
3,098
3,121
3,154
HINDALCO
238
241
246
249
254
HINDPETRO
240
244
249
254
258
HINDUNILVR
1,594
1,607
1,616
1,629
1,638
IBULHSGFIN
879
909
952
982
1,025
ICICIBANK
299
303
309
313
320
IOC
150
151
153
154
156
INDUSINDBK
1,653
1,667
1,691
1,706
1,730
INFY
711
718
724
731
738
ITC
287
290
293
296
298
KOTAKBANK
1,115
1,129
1,153
1,167
1,191
LT
1,274
1,292
1,314
1,332
1,355
LUPIN
860
878
891
909
922
M&M
851
864
880
893
909
MARUTI
7,279
7,416
7,647
7,784
8,015
NTPC
165
166
168
170
172
ONGC
171
173
178
180
184
POWERGRID
190
193
194
196
198
RELIANCE
1,226
1,240
1,251
1,265
1,277
SBIN
261
263
266
268
271
SUNPHARMA
615
623
633
642
652
TCS
2,104
2,147
2,178
2,220
2,252
TATAMOTORS
215
220
228
234
242
TATASTEEL
600
606
613
619
627
TECHM
726
736
747
758
769
TITAN
799
810
827
838
855
ULTRACEMCO
3,927
4,024
4,119
4,215
4,310
UPL
664
673
688
698
713
VEDANTA
234
237
242
245
250
WIPRO
313
316
320
323
327
YESBANK
186
195
211
219
236
ZEEL
434
440
447
452
459
Technical & Derivatives Report
September 28, 2018
Research Team Tel: 022 - 39357800
For Technical Queries
For Derivatives Queries
DISCLAIMER
Angel Broking Limited (hereinafter referred to as “Angel”) is a registered Member of National Stock Exchange of India Limited, Bombay
Stock Exchange Limited and Metropolitan Stock Exchange Limited. It is also registered as a Depository Participant with CDSL and
Portfolio Manager and Investment Adviser with SEBI. It also has registration with AMFI as a Mutual Fund Distributor. Angel Broking
Limited is a registered entity with SEBI for Research Analyst in terms of SEBI (Research Analyst) Regulations, 2014 vide registration
number INH000000164. Angel or its associates has not been debarred/ suspended by SEBI or any other regulatory authority for
accessing /dealing in securities Market. Angel or its associates/analyst has not received any compensation / managed or co-managed
public offering of securities of the company cove*ed by Analyst during the past twelve months.
This document is solely for the personal information of the recipient, and must not be singularly used as the basis of any investment
decision. Nothing in this document should be construed as investment or financial advice. Each recipient of this document should
make such investigations as they deem necessary to arrive at an independent evaluation of an investment in the securities of the
companies referred to in this document (including the merits and risks involved), and should consult their own advisors to determine
the merits and risks of such an investment.
Reports based on technical and derivative analysis center on studying charts of a stock's price movement, outstanding positions and
trading volume, as opposed to focusing on a company's fundamentals and, as such, may not match with a report on a company's
fundamentals. Investors are advised to refer the Fundamental and Technical Research Reports available on our website to evaluate the
contrary view, if any.
The information in this document has been printed on the basis of publicly available information, internal data and other reliable
sources believed to be true, but we do not represent that it is accurate or complete and it should not be relied on as such, as this
document is for general guidance only. Angel Broking Limited or any of its affiliates/ group companies shall not be in any way
responsible for any loss or damage that may arise to any person from any inadvertent error in the information contained in this report.
Angel Broking Limited has not independently verified all the information contained within this document. Accordingly, we cannot testify,
nor make any representation or warranty, express or implied, to the accuracy, contents or data contained within this document. While
Angel Broking Limited endeavors to update on a reasonable basis the information discussed in this material, there may be regulatory,
compliance, or other reasons that prevent us from doing so.
This document is being supplied to you solely for your information, and its contents, information or data may not be reproduced,
redistributed or passed on, directly or indirectly.
Neither Angel Broking Limited, nor its directors, employees or affiliates shall be liable for any loss or damage that may arise from or in
connection with the use of this information.