www.angelbroking.com
Technical & Derivatives Report
August 28, 2020
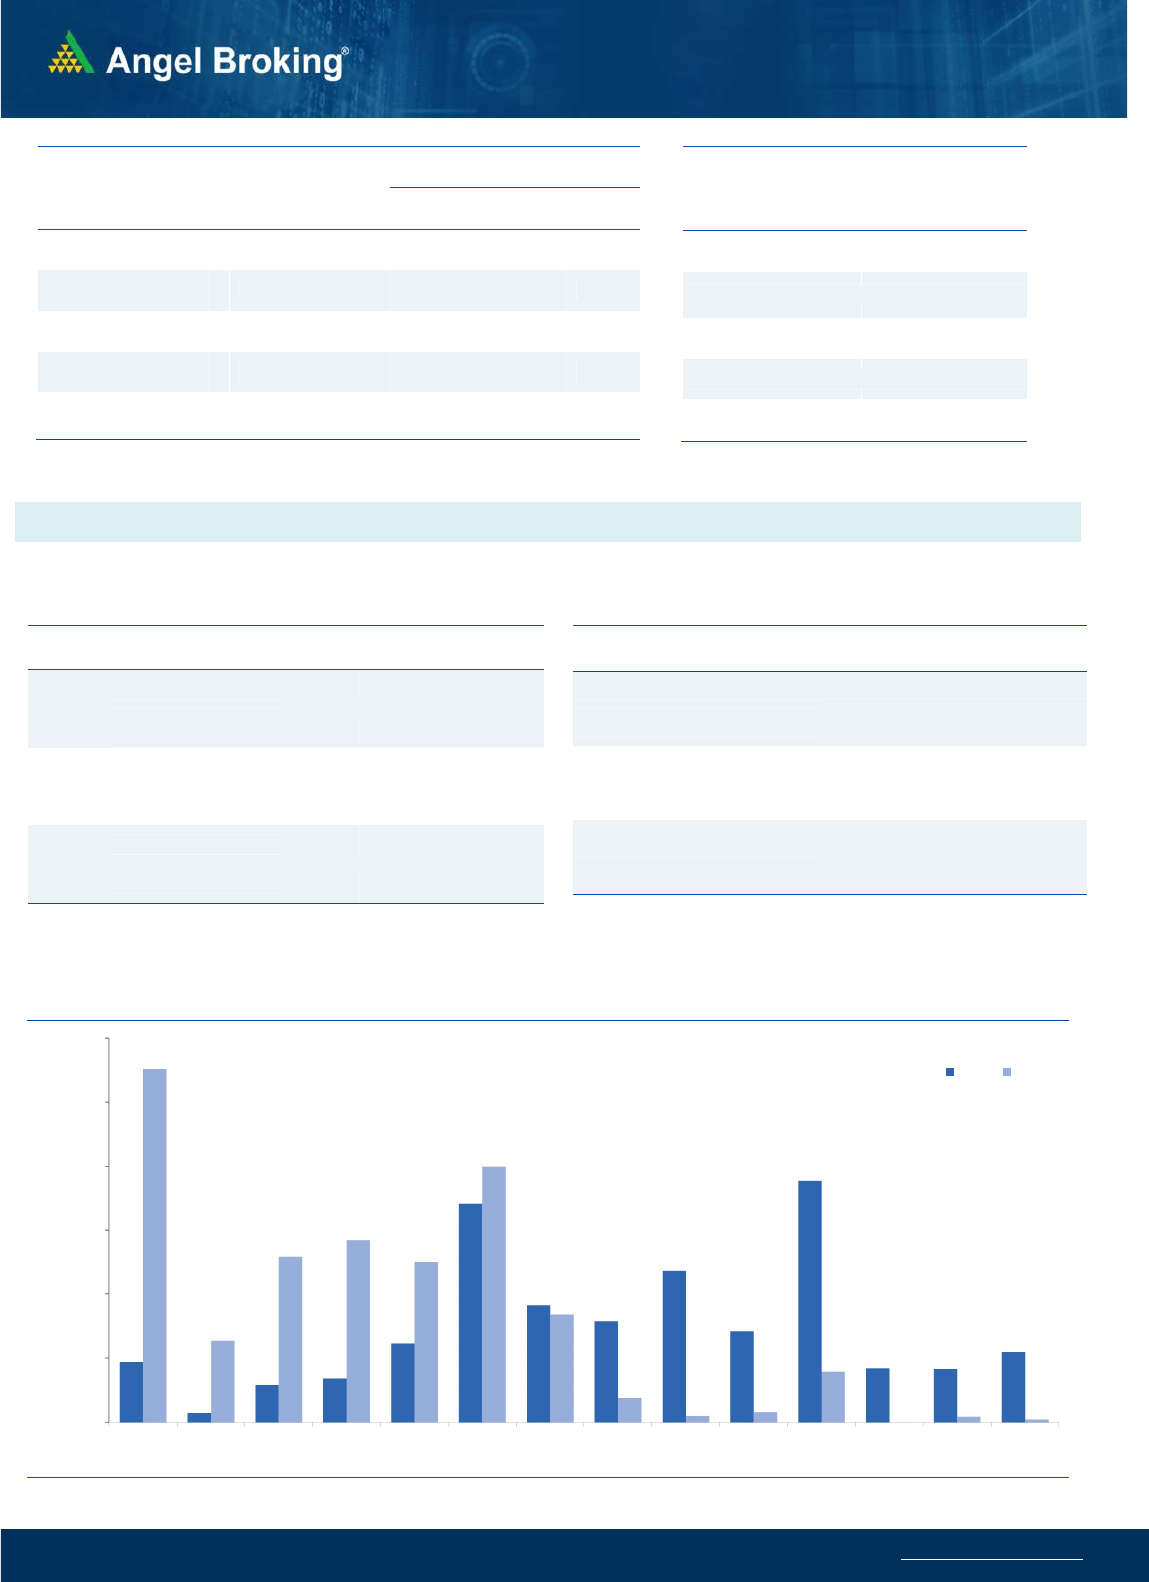
Nifty
Bank Out
look
-
(
23600
)
On the F&O expiry day, Bank Nifty started with a gap up opening
and traded within a very slender range to end with gains of 0.80%
tad at 23600. For the last few sessions, we have been upbeat on
the banking sector and it definitely has outperformed the
benchmark index. On the daily chart, we are witnessing that for
the last two months bank index is trading in a rising channel
pattern and has now inched closer towards the higher end of this
pattern placed around 23800 - 24000 levels. The said levels also
coincides with 127% retracement of the recent swing. Hence one
needs to be watchful around the said levels as the bank index may
see some pause after its recent performance. On the flip side,
previous resistance around 23200 and 23000 can act as support.
Bias remains positive and traders are advised to have stock specific
approach from the basket that are giving outperforming
opportunities.
Key Levels
Support 1 – 23200 Resistance 1 – 23800
Support 2 – 23000 Resistance 2 – 24000
Exhibit 1: Nifty Daily Chart
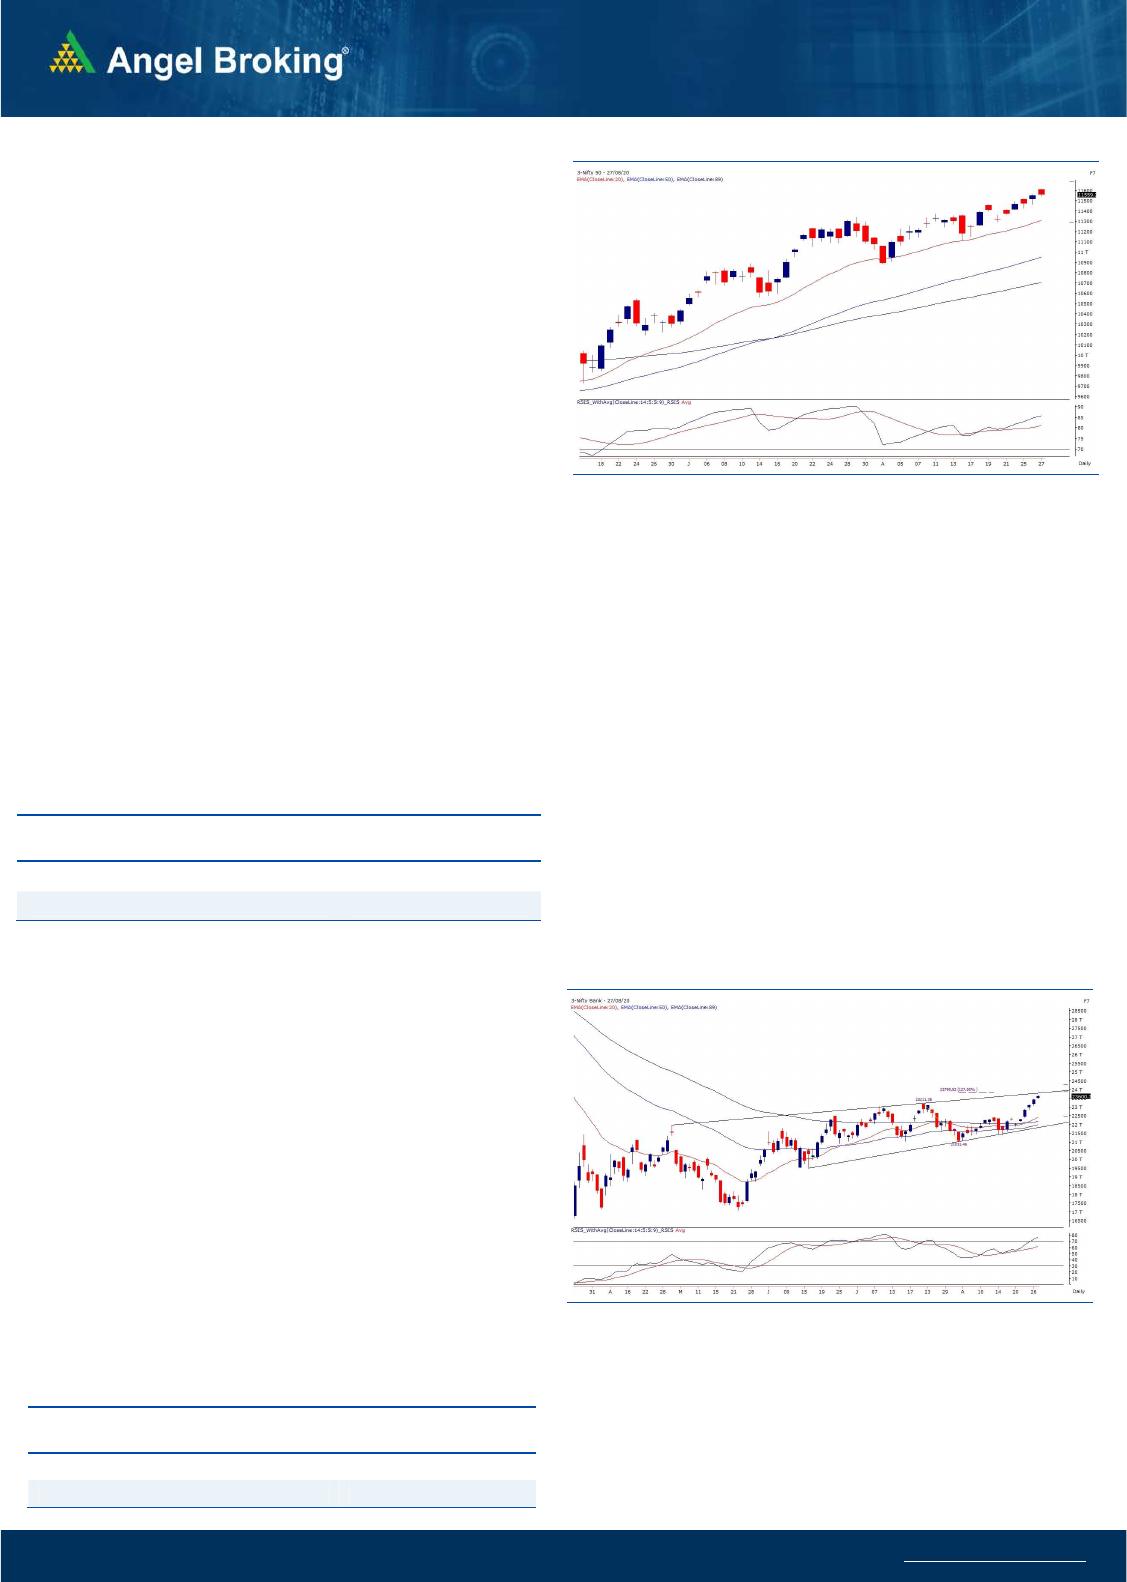
Sensex (39113) / Nifty (11559)
Yesterday morning, global bourses looked a bit sluggish but despite
this, our markets started off with a bump up above the 11600 mark.
At the opening itself, Nifty and Bank Nifty marked their new six-
month highs. But this was followed by a period of complete lull in
the market, thereby making it extremely dull expiry. For the major
part of the day, Nifty kept gyrating in a slender range of 25-30 points
and eventually with a small decline, Nifty ended the day with
negligible gains; but the August expiry panned out quite well above
the 11550 mark.
Due to yesterday's lethargic activity, we do not see any major
development on the chart. As far as the resistances are concerned,
11600-11650 remains to be the levels to watch and on the
downside, 11500 followed by 11440 should be treated as key
supports going forward. The approach pretty much remains the
same; where one should avoid index specific trade for a while (at
least on the long side) and should focus on individual stocks by
following strict stop losses.
Yesterday, mostly the gains were contributed by the banking
conglomerates as we saw sheer outperformance throughout the day
(similar to last few days). In the broader market too, only selective
stocks performed well and hence, one needs to be very fussy going
ahead when it comes to the stock selection.
.Key Levels
Support 1 – 11500 Resistance 1 – 11600
Support 2 – 11440 Resistance 2 – 11650
Exhibit 2: Nifty Bank Daily Chart

www.angelbroking.com
Technical & Derivatives Report
August 28, 2020
Nifty Vs OI
10900
11000
11100
11200
11300
11400
11500
11600
10,000
10,500
11,000
11,500
12,000
12,500
13,000
13,500
14,000
8/10 8/12 8/14 8/18 8/20 8/24 8/26
(`000)
Openinterest Nifty
View
s
Nifty opened on a positive note on the monthly expiry
day, but it traded within a narrow range throughout the
day and ended with marginal gains.
FIIs were net buyers in the cash market segment to the
tune of Rs. 1164 crores. In index futures, they bought
worth 600 crores with decrease in open interest on the
F&O expiry session
.
FII's continued their buying streak in the cash segment
wherein for the third consecutive session they bought
equities worth more than 1000 crores. In index futures
segment, they have squared off much of their short
positions and have rolled longs to the next series. They
are starting the new series with a 'Long Short Ratio' of
about 75 percent. The rollover in Nifty is at 79.92%
versus its 3-month average of 78.82% while in Bank
Nifty it is at 78% which is in line with its average. The
rollover positions indicate long positions rolled in the
new series which is a positive sign. As per the options
data, immediate support is placed around 11500 and
thus we continue with our advice for traders to look for
stocks specific opportunities from a trading
perspective.
C
o
mme
n
t
s
The Nifty futures open interest has decreased by 10.29%
Bank Nifty futures open interest has decreased by 28.10%
as market closed at 11559.25 levels.
The Nifty September future closed with a premium of 20.8
point against a premium of 15.3 point in last trading
session. The October series closed at a premium of 29.95
point.
The INDIA VIX has decreased from 19.30 to 18.89
At the same time, the PCR-OI of Nifty decreased from
1.69 to 1.64.
Few of the liquid counters where we have seen high cost
of carry are SAIL, ASHOKLEY, GMRINFRA, IBULHSGFIN
AND CANBK.
OI Gainers
SCRIP OI
OI
CHG. (%)
PRICE
PRICE
CHG. (%)
PEL 3322000 7.61 1521.70 6.25
ITC 105094400 3.32 194.25 -0.28
SUNPHARMA 32057200 2.97 532.25 1.53
NESTLEIND 423950 2.06 16113.65 -0.49
ESCORTS 2571800 1.61 1156.15 2.63
BAJAJ-AUTO 1703250 0.87 3042.90 -1.49
MINDTREE 1198400 0.54 1149.40 -1.34
TORNTPOWER 2238000 0.40 344.10 -1.66
OI Losers
SCRIP OI
OI
CHG. (%)
PRICE
PRICE
CHG. (%)
ASHOKLEY 17865000 -62.05 72.50 2.44
PNB 23352000 -61.45 35.30 -0.56
BHEL 30702000 -53.75 39.20 -1.98
SAIL 30020000 -49.97 40.70 -1.43
GMRINFRA 65205000 -43.62 25.70 -0.19
CANBK 9265000 -40.38 105.55 -0.33
VEDL 72360200 -39.22 127.85 -0.47
IDEA 338380000 -31.00 8.85 -1.67
Put-Call Ratio
SCRIP PCR-OI PCR-VOL
NIFTY 1.64 1.13
BANKNIFTY 1.15 0.94
RELIANCE 0.62 0.50
ICICIBANK 0.62 0.51
INFY 0.44 0.41
Historical Volatility
SCRIP HV
DLF 66.73
GODREJPROP 61.55
PEL 74.34
JUBLFOOD 53.08
M&M 51.57
www.angelbroking.com
Technical & Derivatives Report
August 28, 2020
Note: Above mentioned Bullish or Bearish Spreads in Nifty (September Series) are given as an information and not as a recommendation.
Nifty Spot =
11559.25
FII Statistics for August 27, 2020
Detail Buy
Sell Net
Open Interest
Contracts
Value
(in Cr.)
Change
(%)
INDEX
FUTURES
7183.58
6583.31
600.27
141010
11630.92
(23.71)
INDEX
OPTIONS
295851.99
294388.53
1463.46
519590
42930.19
(36.79)
STOCK
FUTURES
20535.04
20607.31
(72.27) 1202062
86169.93
(6.04)
STOCK
OPTIONS
2519.05
2318.39
200.66
25763
1696.49
(60.77)
Total 326089.66
323897.54
2192.12
1888425
142427.53
(19.70)
Turnover on August 27, 2020
Instrument
No. of
Contracts
Turnover
( in Cr. )
Change
(%)
Index Futures 4,79,714 34492.81 7.23
Index Options
4,83,13,392
32,90,920.53
105.88
Stock Futures 13,29,576
95993.18 -10.74
Stock Options
11,74,947
87622.12 -19.94
Total 5,12,97,629
35,09,028.64
89.93
Bull-Call Spreads
Action Strike Price Risk Reward BEP
Buy 11600 205.25
51.50 48.50 11651.50
Sell 11700 153.75
Buy 11600 205.25
93.90 106.10 11693.90
Sell 11800 111.35
Buy 11700 153.75
42.40 57.60 11742.40
Sell 11800 111.35
Bear-Put Spreads
Action Strike Price Risk Reward BEP
Buy 11500 186.10
35.65 64.35 11464.35
Sell 11400 150.45
Buy 11500 186.10
64.65 135.35 11435.35
Sell 11300 121.45
Buy 11400 150.45
29.00 71.00 11371.00
Sell 11300 121.45
Nifty Put-Call Analysis
,0
500,000
1000,000
1500,000
2000,000
2500,000
3000,000
11000 11100 11200 11300 11400 11500 11600 11700 11800 11900 12000 12100 12200 12300
Call Put

www.angelbroking.com
Technical & Derivatives Report
August 28, 2020
Daily Pivot Levels for Nifty Constituents
Scrips
S2
S1
PIVOT
R1
R2
ADANIPORTS
345
348
353
355
360
ASIANPAINT 1,948 1,965
1,987
2,004
2,026
AXISBANK
460
467
471
477
481
BAJAJ-AUTO 2,989 3,016
3,052
3,079
3,116
BAJFINANCE 3,560 3,596
3,632
3,668
3,704
BAJAJFINSV 6,424 6,477
6,541
6,595
6,659
BPCL
405
409
414
418
423
BHARTIARTL
502
507
513
517
523
INFRATEL
196
198
200
202
205
BRITANNIA 3,783 3,800
3,827
3,843
3,870
CIPLA
743
749
757
763
771
COALINDIA
138
139
141
143
145
DRREDDY 4,389 4,413
4,441
4,465
4,492
EICHERMOT 2,195 2,216
2,235
2,256
2,275
GAIL
98
99
100
100
101
GRASIM
659
672
680
693
701
HCLTECH
699
704
712
718
726
HDFCBANK 1,092 1,102
1,116
1,126
1,140
HDFC
587
591
596
600
605
HEROMOTOCO
1,806
1,835
1,859
1,888
1,912
HINDALCO 3,077 3,110
3,140
3,172
3,202
HINDUNILVR
191
193
194
196
197
ICICIBANK 2,152 2,162
2,175
2,185
2,198
IOC
383
387
392
397
402
INDUSINDBK
86
87
88
88
89
INFY
551
579
599
626
647
ITC
935
941
951
957
967
JSW STEEL
191
192
196
197
201
KOTAKBANK
281
285
288
292
295
LT 1,392 1,406
1,426
1,440
1,460
M&M
959
967
974
982
988
MARUTI
607
622
631
646
654
NESTLEIND 6,895 6,997
7,062
7,164
7,229
NTPC 15,991
16,052
16,146
16,208
16,302
ONGC
101
102
103
104
105
POWERGRID
79
79
81
81
83
RELIANCE
183
184
186
187
189
SHREECEM 2,075 2,093
2,121
2,139
2,168
SBIN 21,287
21,408
21,580
21,701
21,874
SUNPHARMA
208
212
214
218
220
TCS
519
525
531
538
544
TATAMOTORS 2,214 2,231
2,259
2,277
2,305
TATASTEEL
136
140
143
148
151
TECHM
419
423
427
430
434
TITAN
724
730
738
744
752
ULTRACEMCO 1,116 1,127
1,138
1,148
1,159
UPL 3,972 4,010
4,063
4,101
4,154
VEDANTA
489
493
496
500
504
WIPRO
269
271
273
275
277
ZEEL
199
204
210
216
222

www.angelbroking.com
Technical & Derivatives Report
August 28, 2020
*
Research Team Tel: 022 – 39357600 (Extn. 6844) Website: www.angelbroking.com
For Technical & Derivatives Queries E-mail: technic[email protected]
DISCLAIMER
Angel Broking Limited (hereinafter referred to as “Angel”) is a registered Member of National Stock Exchange of India Limited, Bombay
Stock Exchange Limited and Metropolitan Stock Exchange Limited. It is also registered as a Depository Participant with CDSL and
Portfolio Manager and Investment Adviser with SEBI. It also has registration with AMFI as a Mutual Fund Distributor. Angel Broking
Limited is a registered entity with SEBI for Research Analyst in terms of SEBI (Research Analyst) Regulations, 2014 vide registration
number INH000000164. Angel or its associates has not been debarred/ suspended by SEBI or any other regulatory authority for
accessing /dealing in securities Market. Angel or its associates/analyst has not received any compensation / managed or co-managed
public offering of securities of the company covered by Analyst during the past twelve months.
This document is solely for the personal information of the recipient, and must not be singularly used as the basis of any investment
decision. Nothing in this document should be construed as investment or financial advice. Each recipient of this document should make
such investigations as they deem necessary to arrive at an independent evaluation of an investment in the securities of the companies
referred to in this document (including the merits and risks involved), and should consult their own advisors to determine the merits
and risks of such an investment.
Reports based on technical and derivative analysis center on studying charts of a stock's price movement, outstanding positions and
trading volume, as opposed to focusing on a company's fundamentals and, as such, may not match with a report on a company's
fundamentals. Investors are advised to refer the Fundamental and Technical Research Reports available on our website to evaluate the
contrary view, if any.
The information in this document has been printed on the basis of publicly available information, internal data and other reliable
sources believed to be true, but we do not represent that it is accurate or complete and it should not be relied on as such, as this
document is for general guidance only. Angel Broking Limited or any of its affiliates/ group companies shall not be in any way
responsible for any loss or damage that may arise to any person from any inadvertent error in the information contained in this report.
Angel Broking Limited has not independently verified all the information contained within this document. Accordingly, we cannot
testify, nor make any representation or warranty, express or implied, to the accuracy, contents or data contained within this document.
While Angel Broking Limited endeavors to update on a reasonable basis the information discussed in this material, there may be
regulatory, compliance, or other reasons that prevent us from doing so.
This document is being supplied to you solely for your information, and its contents, information or data may not be reproduced,
redistributed or passed on, directly or indirectly.
Technical and Derivatives Team:
Sameet Chavan Chief Analyst - Technical & Derivatives sameet.chavan@angelbroking.com
Ruchit Jain Senior Analyst - Technical & Derivatives ruchit.jain@angelbroking.com
Rajesh Bhosale Technical Analyst rajesh.bhosle@angelbroking.com
Sneha Seth Derivatives Analyst sneha.seth@angelbroking.com
