www.angelbroking.com
Technical & Derivatives Report
August 27, 2020
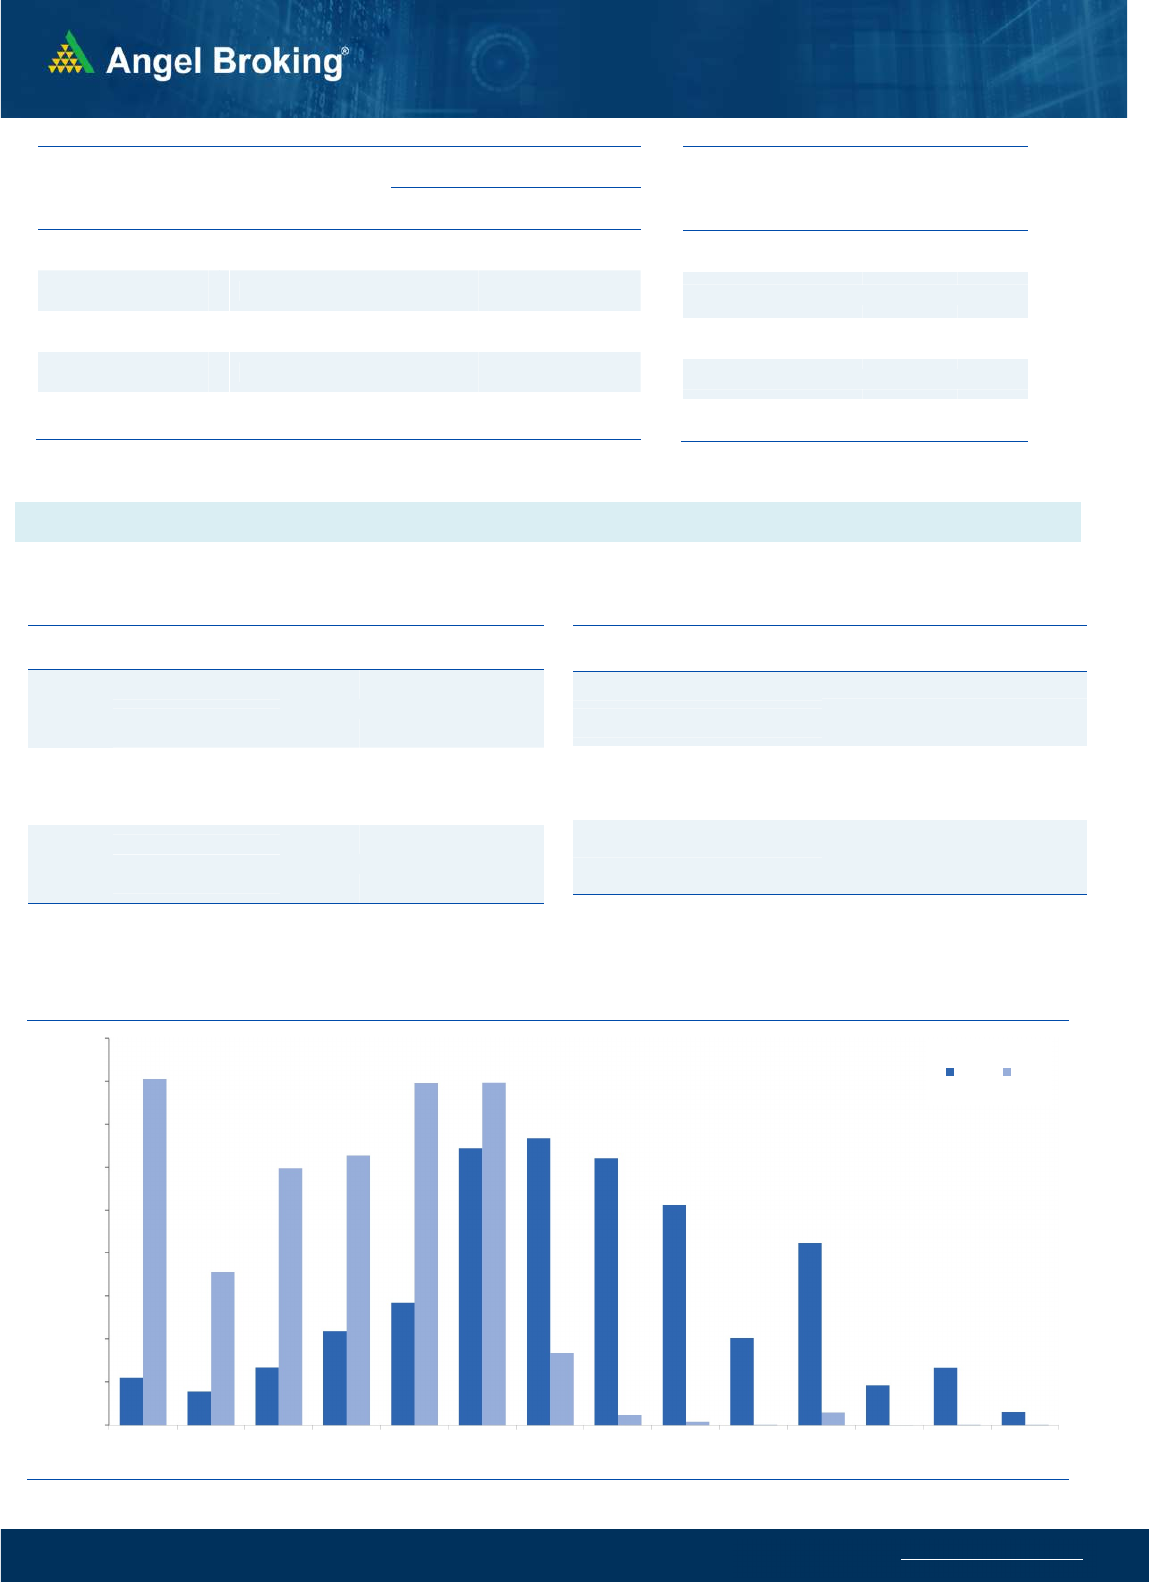
Nifty Bank Outlook - (23414)
Bank Nifty too started on a positive note and the undertone
remained positive throughout the session. During the last hour,
the bank index extended the morning gains to end at 23414 with
1.39%. Even though we sounded skeptical for the benchmark
index during the last few sessions we remained upbeat for the
bank index outperformance. The same has been seen in the last
few sessions. On the daily chart, the bank index has now closed
above previous swing high and the way some of the heavy weight
banking space are placed we expect positive momentum can
continue on the F&O expiry day. Traders are henced advised to
have stock specific appoach from the basket that are likely to give
outperforming opportunites. As far as levels are concerned
previous resistance around 23200 and 23000 can act as support
whereas on the higher side the rising channel (as seen in chart)
higher range at 23800 - 24000 can act as immediate resistance.
Key Levels
Support 1 – 23200 Resistance 1 – 23800
Support 2 – 23000 Resistance 2 – 24000
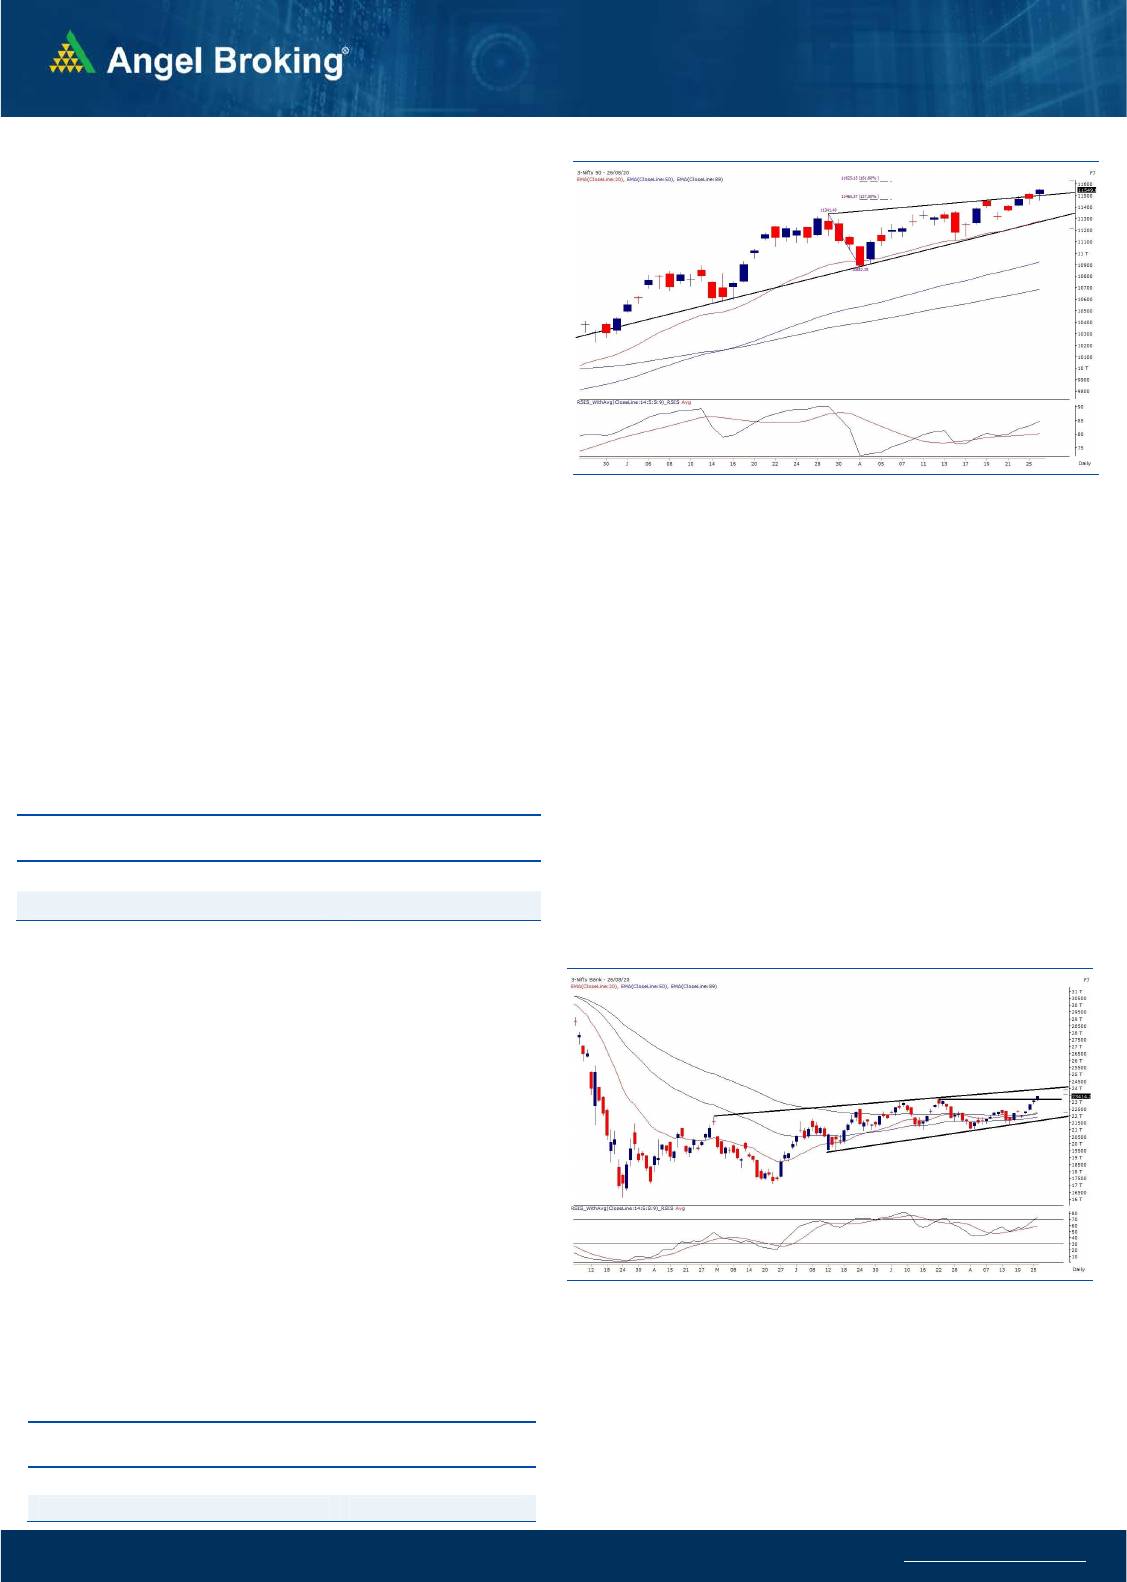
Exhibit 1: Nifty Daily Chart
Sensex (39074) / Nifty (11550)
Despite sluggish global cues, our markets started the day marginally
higher above the 11500 mark. Subsequently, index remained in a
slender range for the major part of the day. However, all of a sudden,
strong buying momentum triggered at the stroke of the penultimate
hour in some of the banking heavyweights, resulting in a spike of
50-60 points in Nifty to post the highest close beyond 11500 in the
last six months.
Clearly, the market is in a beast mode at present and is in no mood
to correct. Since the last few days, we have not been
participating actively in index on the long side. Although it has
strongly maintained its positive posture, the real momentum is
clearly lacking. But yes this cannot be the excuse of letting this move
go. There are times in the market, when things do not go as per the
expectation and this is exactly the same. But we do not want to get
carried away by this, because it's not giving us any comfort and
sometimes there is absolutely no harm in avoiding extended moves.
For the coming session, 11575-11625 would be seen as immediate
upside levels and it coincides with one of the clusters of resistances.
On the downside, intraday support is placed at 11500 - 11440 and
with reference to previous commentary, if any weakness has to
trigger, the Nifty should break and sustain below 11440.
.Key Levels
Support 1 – 11500 Resistance 1 – 11575
Support 2 – 11440 Resistance 2 – 11625
Exhibit 2: Nifty Bank Daily Chart
The banking continues to be in the driving seat and one after
another, banking and financial stocks are giving some decent moves.
Apart from this, recently, we actively participated in Mid Caps and
although, the aggression has reduced a bit, we are still
following stock specific midcaps. Traders can continue with this
approach but need to manage risk properly and booking timely
profits is also advocated.

www.angelbroking.com
Technical & Derivatives Report
August 27
, 2020
Nifty Vs OI
10900
11000
11100
11200
11300
11400
11500
11600
10,000
10,500
11,000
11,500
12,000
12,500
13,000
13,500
14,000
8/108/118/128/138/148/178/188/198/208/218/248/258/26
(`000)
Openinterest Nifty
View
s
Nifty started on a marginal positive note and traded in
a range for the major part. However, in the last hour
strong upomve was seen as Nifty ended with gains of
0.67% at 11550.
FIIs were net buyers in the cash market segment to the
tune of Rs. 1581 crores. In index futures, they bought
worth 360 crores with increase in open interest
indicating formation of mixed positions
.
In yesterday's session, Nifty consolidated around the
11500 mark for most part of the session wherein we
saw open interest addition during the first half in 11500
call and 11400 put. However, in the last hour of trade,
Nifty surpassed the 11500 mark due to which, the call
writers unwound some of their positions and the index
ended around 11550 mark. Infact, in the last hour
upmove, 11500 put options witnessed good amount of
open interest addition, thus making it support now for
the expiry day. On the flipside, 11600 is seen as the
immediate resistance today. FII's bought good amount
of equities in cash segment for the second consecutive
session whereas they formed mixed positions in index
futures. It is advisable for traders to continue to trade
with a stock specific approach.
C
o
mme
n
t
s
The Nifty futures open interest has increased by 14.82%
Bank Nifty futures open interest has increased by 4.71%
as market closed at 11549.60 levels.
The Nifty August future closed with a discount of 1.4
point against a discount of 0.6 point in last trading
session. The September series closed at a premium of
15.3 point.
The INDIA VIX has decreased from 19.32 to 19.30
At the same time, the PCR-OI of Nifty increased from 1.52
to 1.69.
Few of the liquid counters where we have seen high cost
of carry are LICHSGFIN, PNB, IDEA, MARICO AND
MANAPPURAM.
OI Gainers
SCRIP OI
OI
CHG. (%)
PRICE
PRICE
CHG. (%)
RBLBANK 23613200 28.99 200.40 5.89
SRTRANSFIN 4855093 23.98 726.35 4.46
IBULHSGFIN 20928100 15.11 217.75 5.44
BANKBARODA 58843200 11.76 48.45 -0.61
L&TFH 41446000 10.74 71.70 5.50
TVSMOTOR 6326600 9.26 467.50 4.37
NMDC 36642300 8.77 96.20 1.85
MGL 1345200 7.07 1015.10 -2.13
OI Losers
SCRIP OI
OI
CHG. (%)
PRICE
PRICE
CHG. (%)
EQUITAS 6133200 -40.75 55.15 -0.90
UJJIVAN 734800 -38.60 255.25 1.19
CENTURYTEX 1054200 -25.52 340.15 2.55
VOLTAS 2224000 -23.91 648.80 -1.22
APOLLOTYRE 15935000 -13.75 132.00 3.94
PNB 60578000 -11.84 35.40 0.56
MINDTREE 1192000 -11.41 1171.80 2.50
JUBLFOOD 2918500 -9.74 2077.05 -1.15
Put-Call Ratio
SCRIP PCR-OI PCR-VOL
NIFTY 1.69 1.01
BANKNIFTY 1.37 0.86
RELIANCE 0.71 0.47
ICICIBANK 0.77 0.47
INFY 0.52 0.50
Historical Volatility
SCRIP HV
HEROMOTOCO 52.48
TATAMOTORS 73.16
ADANIENT 69.26
TVSMOTOR 51.66
TATAPOWER 53.62
www.angelbroking.com
Technical & Derivatives Report
August 27
, 2020
Note: Above mentioned Bullish or Bearish Spreads in Nifty (August Series) are given as an information and not as a recommendation.
Nifty Spot =
11549.60
FII Statistics for August 26, 2020
Detail Buy
Sell Net
Open Interest
Contracts
Value
(in Cr.)
Change
(%)
INDEX
FUTURES
6623.64
6263.24
360.40
184827
14542.13
29.50
INDEX
OPTIONS
205617.83
205857.35
(239.52) 822060
66443.86
9.46
STOCK
FUTURES
27327.83
28105.77
(777.94) 1279271
91241.36
0.02
STOCK
OPTIONS
5289.83
5184.77
105.06
65674
4530.88
(15.47)
Total 244859.13
245411.13
(552.00) 2351832
176758.23
4.50
Turnover on August 26, 2020
Instrument
No. of
Contracts
Turnover
( in Cr. )
Change
(%)
Index Futures 4,51,863 32166.41 -3.28
Index Options
2,31,12,971
15,98,435.56
8.40
Stock Futures 14,73,018
1,07,539.40 -11.36
Stock Options
13,83,983
1,09,440.82 -10.56
Total 2,64,21,835
18,47,582.19
5.48
Bull-Call Spreads
Action Strike Price Risk Reward BEP
Buy 11600 18.50
15.95 84.05 11615.95
Sell 11700 2.55
Buy 11600 18.50
17.50 182.50 11617.50
Sell 11800 1.00
Buy 11700 2.55
1.55 98.45 11701.55
Sell 11800 1.00
Bear-Put Spreads
Action Strike Price Risk Reward BEP
Buy 11500 24.15
14.90 85.10 11485.10
Sell 11400 9.25
Buy 11500 24.15
19.10 180.90 11480.90
Sell 11300 5.05
Buy 11400 9.25
4.20 95.80 11395.80
Sell 11300 5.05
Nifty Put-Call Analysis
,0
500,000
1000,000
1500,000
2000,000
2500,000
3000,000
3500,000
4000,000
4500,000
11000 11100 11200 11300 11400 11500 11600 11700 11800 11900 12000 12100 12200 12300
Call Put

www.angelbroking.com
Technical & Derivatives Report
August 27
, 2020
Daily Pivot Levels for Nifty Constituents
Scrips
S2
S1
PIVOT
R1
R2
ADANIPORTS
335
345
356
365
376
ASIANPAINT 1,925 1,948
1,979
2,002
2,032
AXISBANK
443
453
459
469
475
BAJAJ-AUTO 3,030 3,056
3,097
3,123
3,164
BAJFINANCE 3,585 3,615
3,661
3,691
3,737
BAJAJFINSV 6,416 6,490
6,595
6,669
6,774
BPCL
405
407
412
414
418
BHARTIARTL
502
508
518
525
535
INFRATEL
194
197
200
204
207
BRITANNIA 3,770 3,8
00
3,829
3,858
3,887
CIPLA
739
743
749
753
759
COALINDIA
138
140
142
144
146
DRREDDY 4,376 4,406
4,429
4,458
4,482
EICHERMOT 2,204 2,227
2,257
2,280
2,310
GAIL
98
99
100
101
102
GRASIM
648
658
668
678
688
HCLTECH
688
701
709
721
730
HDFCBANK 1,098 1,108
1,120
1,130
1,142
HDFC
580
586
595
600
609
HEROMOTOCO
1,785
1,800
1,819
1,835
1,853
HINDALCO 3,026 3,093
3,137
3,205
3,249
HINDUNILVR
190
192
193
195
197
ICICIBANK 2,150 2,167
2,176
2,193
2,202
IOC
381
3
85
388
393
396
INDUSINDBK
87
87
88
89
89
INFY
526
547
559
580
593
ITC
932
941
948
957
964
JSW STEEL
192
194
195
196
198
KOTAKBANK
282
284
285
288
289
LT 1,389 1,413
1,427
1,451
1,466
M&M
951
960
974
983
997
MARUTI
601
607
616
622
631
NESTLEIND 6,860 6,934
7,046
7,120
7,232
NTPC 16,058
16,124
16,236
16,302
16,414
ONGC
100
101
103
104
106
POWERGRID
80
81
81
82
83
RELIANCE
181
183
186
189
192
SHREECEM 2,010 2,074
2,111
2,175
2,212
SBIN 21,371
21,541
21,770
21,940
22,169
SUNPHARMA
205
207
209
211
213
TCS
518
522
526
529
534
TATAMOTORS 2,200 2,227
2,243
2,270
2,287
TATASTEEL
124
131
135
142
146
TECHM
419
422
425
428
431
TITAN
720
726
734
740
748
ULTRACEMCO 1,114 1,124
1,137
1,147
1,160
UPL 3,999 4,039
4,110
4,151
4,222
VEDANTA
485
489
493
497
501
WIPRO
265
268
272
275
278
ZEEL
192
202
208
217
223

www.angelbroking.com
Technical & Derivatives Report
August 27
, 2020
*
Research Team Tel: 022 – 39357600 (Extn. 6844) Website: www.angelbroking.com
For Technical & Derivatives Queries E-mail: technicalresearch-cso@angelbroking.com
DISCLAIMER
Angel Broking Limited (hereinafter referred to as “Angel”) is a registered Member of National Stock Exchange of India Limited, Bombay
Stock Exchange Limited and Metropolitan Stock Exchange Limited. It is also registered as a Depository Participant with CDSL and
Portfolio Manager and Investment Adviser with SEBI. It also has registration with AMFI as a Mutual Fund Distributor. Angel Broking
Limited is a registered entity with SEBI for Research Analyst in terms of SEBI (Research Analyst) Regulations, 2014 vide registration
number INH000000164. Angel or its associates has not been debarred/ suspended by SEBI or any other regulatory authority for
accessing /dealing in securities Market. Angel or its associates/analyst has not received any compensation / managed or co-managed
public offering of securities of the company covered by Analyst during the past twelve months.
This document is solely for the personal information of the recipient, and must not be singularly used as the basis of any investment
decision. Nothing in this document should be construed as investment or financial advice. Each recipient of this document should make
such investigations as they deem necessary to arrive at an independent evaluation of an investment in the securities of the companies
referred to in this document (including the merits and risks involved), and should consult their own advisors to determine the merits
and risks of such an investment.
Reports based on technical and derivative analysis center on studying charts of a stock's price movement, outstanding positions and
trading volume, as opposed to focusing on a company's fundamentals and, as such, may not match with a report on a company's
fundamentals. Investors are advised to refer the Fundamental and Technical Research Reports available on our website to evaluate the
contrary view, if any.
The information in this document has been printed on the basis of publicly available information, internal data and other reliable
sources believed to be true, but we do not represent that it is accurate or complete and it should not be relied on as such, as this
document is for general guidance only. Angel Broking Limited or any of its affiliates/ group companies shall not be in any way
responsible for any loss or damage that may arise to any person from any inadvertent error in the information contained in this report.
Angel Broking Limited has not independently verified all the information contained within this document. Accordingly, we cannot
testify, nor make any representation or warranty, express or implied, to the accuracy, contents or data contained within this document.
While Angel Broking Limited endeavors to update on a reasonable basis the information discussed in this material, there may be
regulatory, compliance, or other reasons that prevent us from doing so.
This document is being supplied to you solely for your information, and its contents, information or data may not be reproduced,
redistributed or passed on, directly or indirectly.
Technical and Derivatives Team:
Sameet Chavan Chief Analyst - Technical & Derivatives sameet.chavan@angelbroking.com
Ruchit Jain Senior Analyst - Technical & Derivatives ruchit.jain@angelbroking.com
Rajesh Bhosale Technical Analyst rajesh.bhosle@angelbroking.com
Sneha Seth Derivatives Analyst sneha.seth@angelbroking.com
