
www.angelbroking.com
Technical & Derivatives Report
August 26, 2020
Nifty
Bank Out
look
-
(
23092
)
Following the breakout momentum from the previous session, the
bank index witnessed a gap up opening in yesterday's session, and
after witnessing swings within a range ended with gains of 1.13%
at 23092. In our yesterday's outlook, we had mentioned that the
bank index is likely to outperform and this is exactly what we saw
in yesterday's session. On the daily chart, the bank index has now
approached its previous swing high at 23211 that can be taken as
a make or break point. If prices manage to sustain or close above
23200 - 23250 zone then we may see outperformance of banking
stocks that can be taken as a catch-up move to its recent
underperformance. However, if it fails to break then it may lead
to correction in broader markets. As far as support levels are
concerned, immediate support is placed around 22830 followed
by 22500.
Key Levels
Support 1 – 22830 Resistance 1 – 23250
Support 2 – 22500 Resistance 2 – 23480
Exhibit 1: Nifty Daily Chart
Sensex (38844) / Nifty (11472)
Global markets are clearly enjoying their dream run and the winning
streak continued previous night and yesterday morning aswell. As a
result, despite SGX Nifty indicating a sluggish start, our markets
opened higher above the 11500 mark. However, Nifty failed to
extend the optimism as we saw couple of sharp swings of profit
booking from day’s high. Fortunately, we managed to defend key
levels and with the help of a gradual recovery towards the fag end,
the Nifty ended session with negligible gains.
Although we have been sounding a bit cautious since last week or
so, market didn’t look tired at any point; but yesterday for the first
day, we witnessed some fatigue in Nifty at higher levels. Technically
speaking, we observed a ‘Bearish Wolfe Wave’ on hourly chart and
precisely from the Potential Reversal Zone of this pattern, we
witnessed some profit booking in the market. Till now, we were only
making our assumptions but now we can see a defined level on
chart, which can trigger some weakness in Nifty. This level is at
11420, which is yesterday’s low as well. Going ahead, a sustainable
move below this point should be considered as an exit opportunity
for existing longs and aggressive traders can opt to short as well.
Below this, 11350-11300 are the next levels to watch out for. On the
upside, 11500-11525 remains to be an immediate hurdle and in
case if it extends further, we will still avoid participating in it.
.Key Levels
Support 1 – 11420 Resistance 1 – 11500
Support 2 – 11300 Resistance 2 – 11525
Exhibit 2: Nifty Bank Daily Chart
The banking space has gained some strength in last 3-4 days and it
is clearly not letting the market fall. Yesterday too, it managed to
hold strong and has now reached it’s recent crucial high around
23200-23250. Now going ahead, it would be interesting to see
whether BankNifty still holds Nifty higher or a failure to surpass
23250 triggers some correction. Apart from this, some profit taking
was seen in the broader market and hence, one needs to be watchful
there as well.
www.angelbroking.com
Technical & Derivatives Report
August 26, 2020
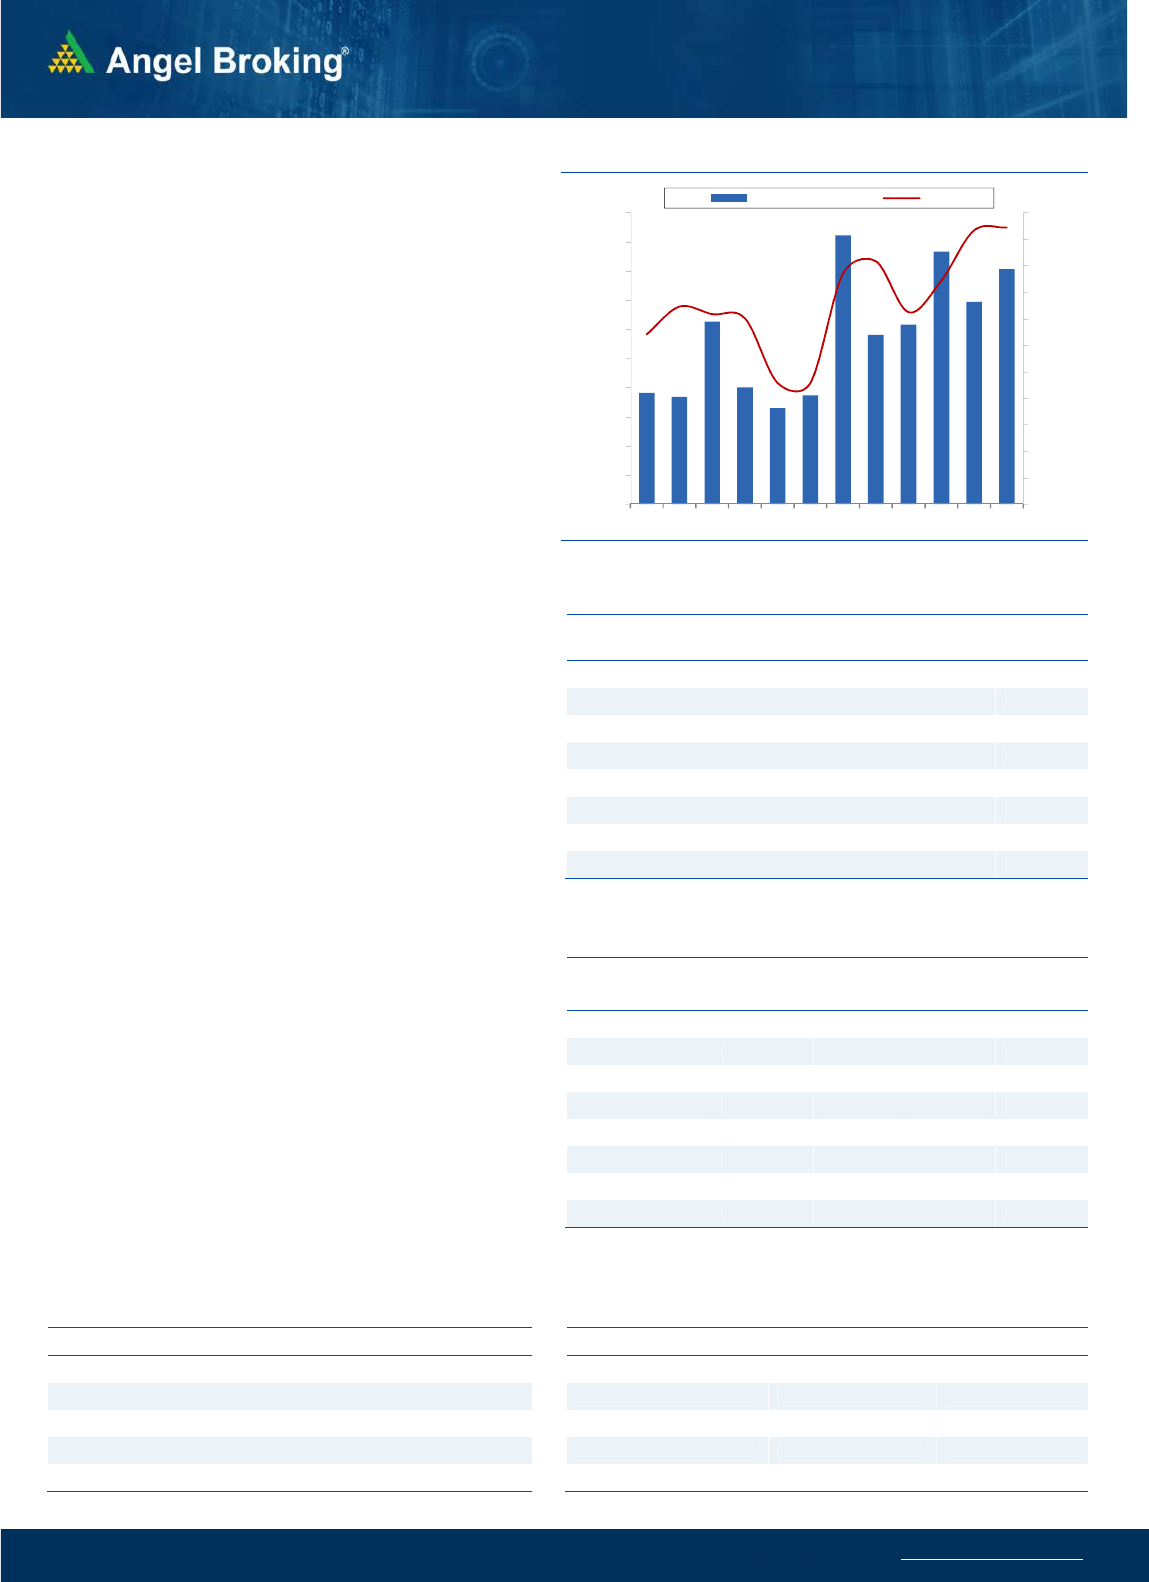
Nifty Vs OI
10950
11000
11050
11100
11150
11200
11250
11300
11350
11400
11450
11500
11,000
11,100
11,200
11,300
11,400
11,500
11,600
11,700
11,800
11,900
12,000
8/10 8/11 8/12 8/13 8/14 8/17 8/18 8/19 8/20 8/21 8/24 8/25
(`000)
Openinterest Nifty
View
s
Nifty started on a positive note yesterday and
surpassed the 11500 mark. However, we witnessed
some pullback during the day and the index ended with
negligible gains.
FIIs were net buyers in the cash market segment to the
tune of Rs. 1481 crores. In index futures, they sold worth
144 crores with increase in open interest indicating
formation of mixed positions
.
While marginal open interest addition was seen in the
Nifty, the banking index saw formation of long positions
which led to the relative outperformance. FII's were net
buyers in the cash segment whereas they formed mixed
positions yesterday in the index futures. In options
segment, inspite of the index surpassing the 11500
mark, the call writers kept their positions intact and
infact good amount of build up is seen in that strike.
This indicates that 11500 is a hurdle and may not be
crossed in this monthly expiry. On the flipside, 11400 is
the immediate support followed by 11300 mark. Since
the index is trading around the resistance, traders
should avoid long bets in the Nifty at current levels and
rather focus on stock specific moves with opportunities
on both the sides of the trade.
C
o
mme
n
t
s
The Nifty futures open interest has increased by 0.97%
Bank Nifty futures open interest has increased by 11.15%
as market closed at 11472.25 levels.
The Nifty August future closed with a discount of 0.6
point against a premium of 7.7 point in last trading
session. The September series closed at a premium of
10.55 point.
The INDIA VIX has increased from 19.23 to 19.32
At the same time, the PCR-OI of Nifty decreased from
1.63 to 1.52.
Few of the liquid counters where we have seen high cost
of carry are SAIL, PNB, TORNTPOWER, TATACHEM AND
GMRINFRA.
OI Gainers
SCRIP OI
OI
CHG. (%)
PRICE
PRICE
CHG. (%)
IBULHSGFIN 18181500 26.81 206.30 2.00
CANBK 17000000 26.11 106.70 2.54
M&MFIN 21469896 22.60 137.35 3.80
CHOLAFIN 6925000 15.75 242.15 4.53
HAVELLS 6327000 15.60 663.05 3.24
PVR 1858362 10.64 1322.20 0.95
INDIGO 3234500 9.57 1166.15 0.54
LICHSGFIN 13988000 8.96 299.00 8.40
OI Losers
SCRIP OI
OI
CHG. (%)
PRICE
PRICE
CHG. (%)
CENTURYTEX 1415400 -23.58 331.80 -1.13
ADANIENT 15072000 -20.36 307.60 20.64
BATAINDIA 1858450 -18.60 1306.80 -1.65
VOLTAS 2923000 -18.24 654.90 -0.92
UJJIVAN 1196800 -18.20 252.10 1.00
RAMCOCEM 1343850 -13.18 730.65 1.36
TVSMOTOR 5790400 -12.76 445.55 -0.75
EICHERMOT 2886800 -11.03 2217.25 1.76
Put-Call Ratio
SCRIP PCR-OI PCR-VOL
NIFTY 1.52 1.01
BANKNIFTY 1.35 0.75
RELIANCE 0.60 0.47
ICICIBANK 0.72 0.43
INFY 0.54 0.64
Historical Volatility
SCRIP HV
ADANIENT 68.70
MFSL 80.14
LICHSGFIN 63.39
HAVELLS 44.55
TATACHEM 43.83
www.angelbroking.com
Technical & Derivatives Report
August 26, 2020
Note: Above mentioned Bullish or Bearish Spreads in Nifty (August Series) are given as an information and not as a recommendation.
Nifty Spot =
11472.25
FII Statistics for August 25, 2020
Detail Buy
Sell Net
Open Interest
Contracts
Value
(in Cr.)
Change
(%)
INDEX
FUTURES
6509.51
6653.87
(144.36) 142719
10937.87
10.05
INDEX
OPTIONS
202660.52
202152.29
508.23
751027
59720.07
5.80
STOCK
FUTURES
41097.03
41424.56
(327.53) 1279012
90996.33
(1.27)
STOCK
OPTIONS
5670.23
5525.66
144.57
77697
5491.20
(10.34)
Total 255937.29
255756.38
180.91
2250455
167145.47
1.30
Turnover on August 25, 2020
Instrument
No. of
Contracts
Turnover
( in Cr. )
Change
(%)
Index Futures 4,87,095 33256.72 34.24
Index Options
2,15,89,292
14,74,594.93
36.96
Stock Futures 17,04,306
1,21,322.66 17.25
Stock Options
16,51,944
1,22,357.56 -3.29
Total 2,54,32,637
17,51,531.87
31.56
Bull-Call Spreads
Action Strike Price Risk Reward BEP
Buy 11500 42.10
30.00 70.00 11530.00
Sell 11600 12.10
Buy 11500 42.10
38.85 161.15 11538.85
Sell 11700 3.25
Buy 11600 12.10
8.85 91.15 11608.85
Sell 11700 3.25
Bear-Put Spreads
Action Strike Price Risk Reward BEP
Buy 11500 70.85
39.75 60.25 11460.25
Sell 11400 31.10
Buy 11500 70.85
56.30 143.70 11443.70
Sell 11300 14.55
Buy 11400 31.10
16.55 83.45 11383.45
Sell 11300 14.55
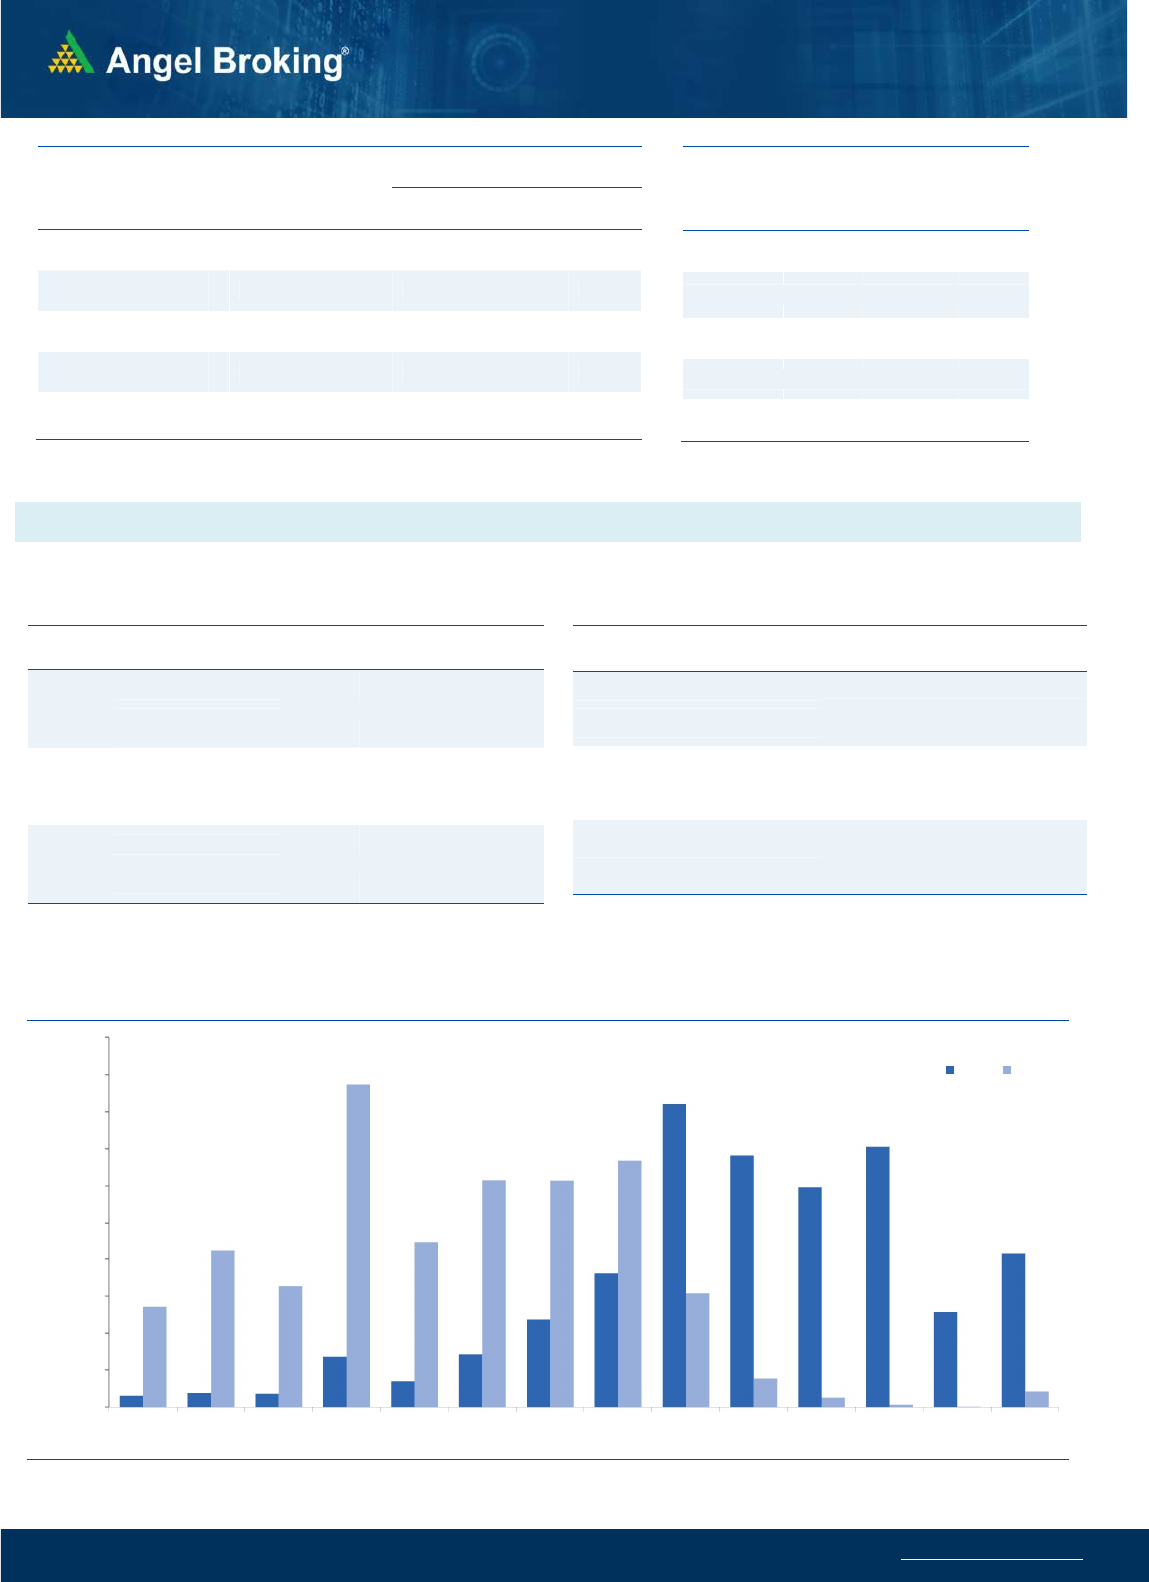
Nifty Put-Call Analysis
,0
500,000
1000,000
1500,000
2000,000
2500,000
3000,000
3500,000
4000,000
4500,000
5000,000
10700 10800 10900 11000 11100 11200 11300 11400 11500 11600 11700 11800 11900 12000
Call Put

www.angelbroking.com
Technical & Derivatives Report
August 26, 2020
Daily Pivot Levels for Nifty Constituents
Scrips
S2
S1
PIVOT
R1
R2
ADANIPORTS
335
341
346
352
357
ASIANPAINT 1,941 1,971
1,994
2,024
2,047
AXISBANK
442
447
452
4
56
461
BAJAJ-AUTO 2,956 2,983
3,019
3,045
3,081
BAJFINANCE 3,454 3,549
3,604
3,699
3,754
BAJAJFINSV 6,354 6,428
6,475
6,549
6,596
BPCL
402
408
414
419
425
BHARTIARTL
520
525
530
534
540
INFRATEL
194
196
198
201
203
BRITANNIA 3,846 3,871
3,901
3,926
3,956
CIPLA
738
743
750
755
763
COALINDIA
138
139
140
141
142
DRREDDY 4,374 4,401
4,447
4,473
4,519
EICHERMOT 2,149 2,183
2,216
2,251
2,284
GAIL
97
98
101
102
105
GRASIM
654
664
672
682
689
HCLTECH
686
694
703
7
11
719
HDFCBANK 1,097 1,108
1,118
1,129
1,138
HDFC
588
594
599
605
609
HEROMOTOCO
1,798
1,814
1,833
1,849
1,868
HINDALCO 2,898 2,934
2,994
3,029
3,089
HINDUNILVR
186
189
193
195
199
ICICIBANK 2,161 2,170
2,184
2,193
2,207
IOC 377
382
386
390
394
INDUSINDBK
87
88
88
89
90
INFY
522
529
538
545
554
ITC
925
932
940
947
955
JSW STEEL
193
194
196
197
199
KOTAKBANK
277
281
284
288
291
LT 1,371 1,385
1,395
1,410
1,420
M&M
964
972
986
994
1,008
MARUTI
597
60
3
608
614
619
NESTLEIND 7,020 7,065
7,120
7,165
7,220
NTPC 16,131
16,209
16,344
16,422
16,557
ONGC
101
102
105
106
109
POWERGRID
79
80
81
82
83
RELIANCE
181
183
185
187
189
SHREECEM 2,057 2,070
2,090
2,103
2,124
SBIN 21,162
21,487
2
1,974
22,298
22,786
SUNPHARMA
201
204
206
210
212
TCS
516
521
528
532
540
TATAMOTORS 2,226 2,234
2,242
2,251
2,259
TATASTEEL
118
123
126
130
133
TECHM
415
419
426
431
437
TITAN
705
722
731
748
757
ULTRACEMCO 1,117 1,127
1,133
1,1
43
1,149
UPL 4,114 4,143
4,171
4,200
4,228
VEDANTA
484
488
494
498
505
WIPRO
266
268
271
273
277
ZEEL
194
197
201
204
207

www.angelbroking.com
Technical & Derivatives Report
August 26, 2020
*
Research Team Tel: 022 – 39357600 (Extn. 6844) Website: www.angelbroking.com
For Technical & Derivatives Queries E-mail: technicalresearc[email protected]
DISCLAIMER
Angel Broking Limited (hereinafter referred to as “Angel”) is a registered Member of National Stock Exchange of India Limited, Bombay
Stock Exchange Limited and Metropolitan Stock Exchange Limited. It is also registered as a Depository Participant with CDSL and
Portfolio Manager and Investment Adviser with SEBI. It also has registration with AMFI as a Mutual Fund Distributor. Angel Broking
Limited is a registered entity with SEBI for Research Analyst in terms of SEBI (Research Analyst) Regulations, 2014 vide registration
number INH000000164. Angel or its associates has not been debarred/ suspended by SEBI or any other regulatory authority for
accessing /dealing in securities Market. Angel or its associates/analyst has not received any compensation / managed or co-managed
public offering of securities of the company covered by Analyst during the past twelve months.
This document is solely for the personal information of the recipient, and must not be singularly used as the basis of any investment
decision. Nothing in this document should be construed as investment or financial advice. Each recipient of this document should make
such investigations as they deem necessary to arrive at an independent evaluation of an investment in the securities of the companies
referred to in this document (including the merits and risks involved), and should consult their own advisors to determine the merits
and risks of such an investment.
Reports based on technical and derivative analysis center on studying charts of a stock's price movement, outstanding positions and
trading volume, as opposed to focusing on a company's fundamentals and, as such, may not match with a report on a company's
fundamentals. Investors are advised to refer the Fundamental and Technical Research Reports available on our website to evaluate the
contrary view, if any.
The information in this document has been printed on the basis of publicly available information, internal data and other reliable
sources believed to be true, but we do not represent that it is accurate or complete and it should not be relied on as such, as this
document is for general guidance only. Angel Broking Limited or any of its affiliates/ group companies shall not be in any way
responsible for any loss or damage that may arise to any person from any inadvertent error in the information contained in this report.
Angel Broking Limited has not independently verified all the information contained within this document. Accordingly, we cannot
testify, nor make any representation or warranty, express or implied, to the accuracy, contents or data contained within this document.
While Angel Broking Limited endeavors to update on a reasonable basis the information discussed in this material, there may be
regulatory, compliance, or other reasons that prevent us from doing so.
This document is being supplied to you solely for your information, and its contents, information or data may not be reproduced,
redistributed or passed on, directly or indirectly.
Technical and Derivatives Team:
Sameet Chavan Chief Analyst - Technical & Derivatives sameet.chavan@angelbroking.com
Ruchit Jain Senior Analyst - Technical & Derivatives ruchit.jain@angelbroking.com
Rajesh Bhosale Technical Analyst rajesh.bhosle@angelbroking.com
Sneha Seth Derivatives Analyst sneha.seth@angelbroking.com
