www.angelbroking.com
Technical & Derivatives Report
August 25, 2020
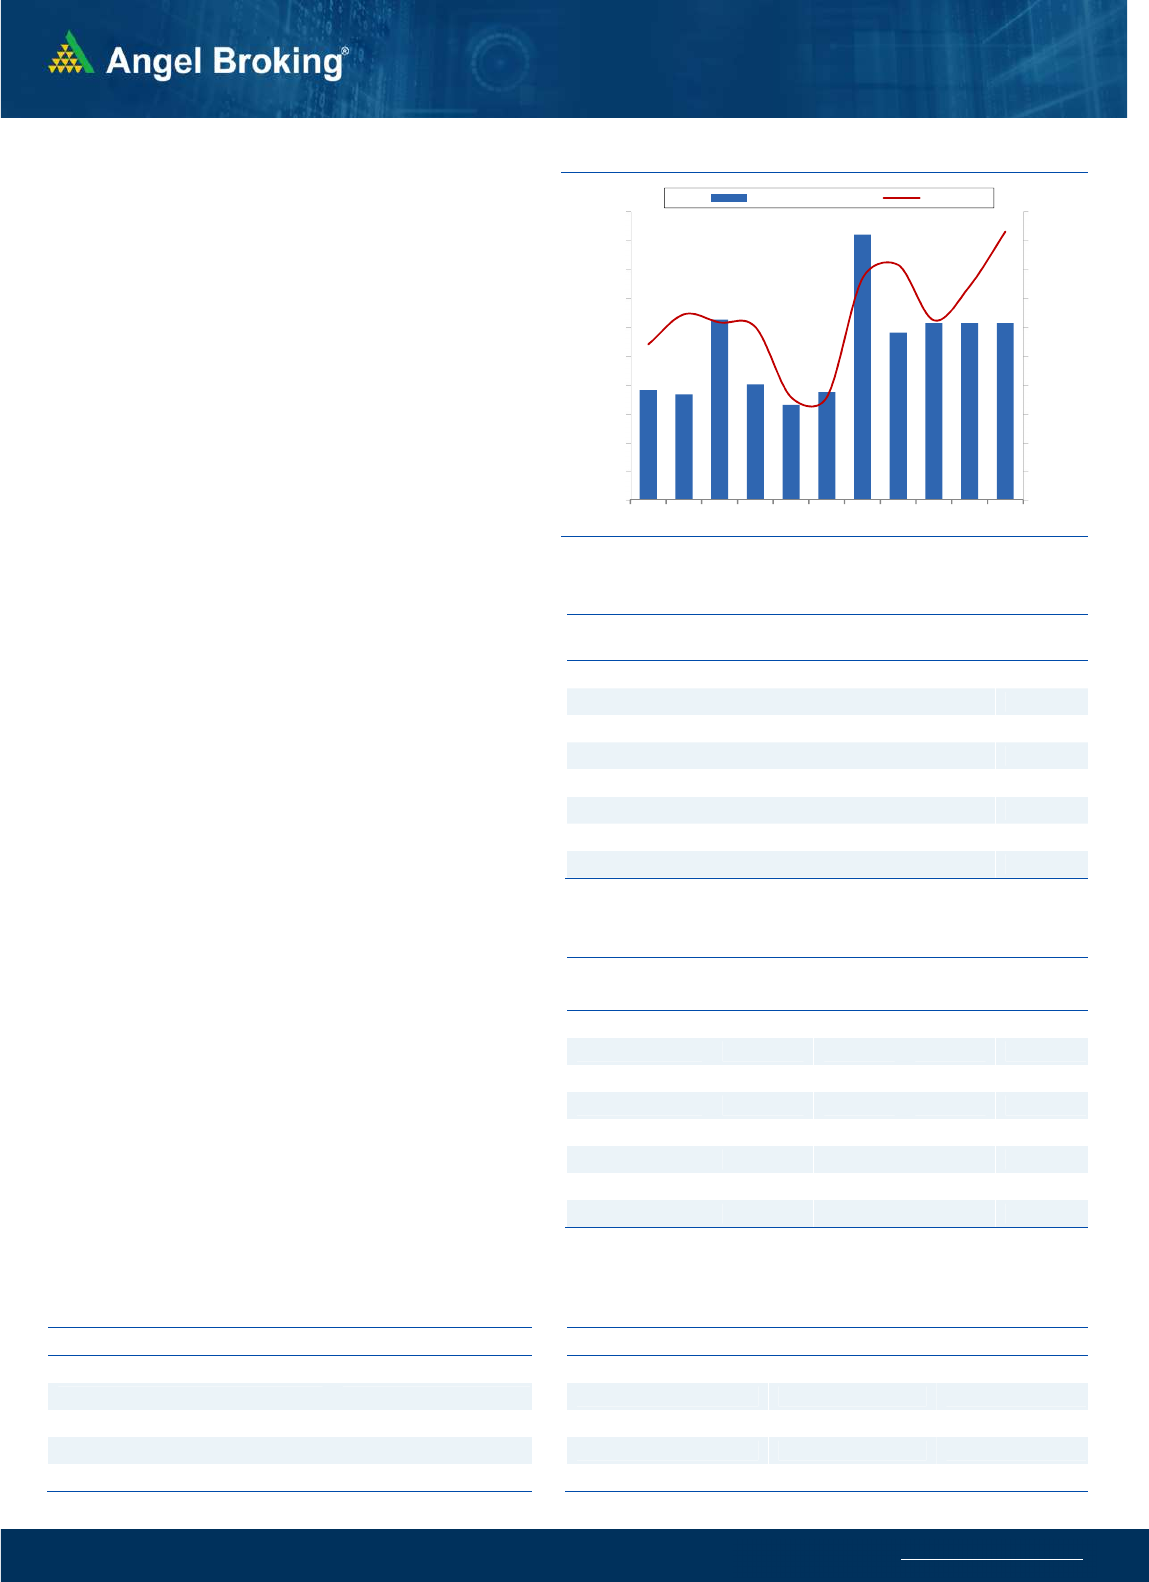
Nifty Bank Outlook - (22833)
Bank Nifty too started with a gap up opening and with positive
momentum throughout the session ended with gains of 2.39% at
22833. On the daily chart, the bank index has finally broken above
22500 levels which was previously acting as stiff resistance for the
last one month. The said breakout is supported with a gap that
can be termed as a breakaway gap. Yesterday, Bank Index
outperformed the benchmark index and the way some of the
banking stocks are placed it seems we may continue to see
outperformance in the bank index for the next few sessions that
can be taken as a catch-up rally to its recent underperformance.
In such scenario, previous resistance around 22500 can act as
support followed by gap support at 22344. On the flip side,
immediate resistance is seen around 23000 and 23200 levels.
Key Levels
Support 1 – 22500 Resistance 1 – 23000
Support 2 – 22344 Resistance 2 – 23200
Exhibit 1: Nifty Daily Chart
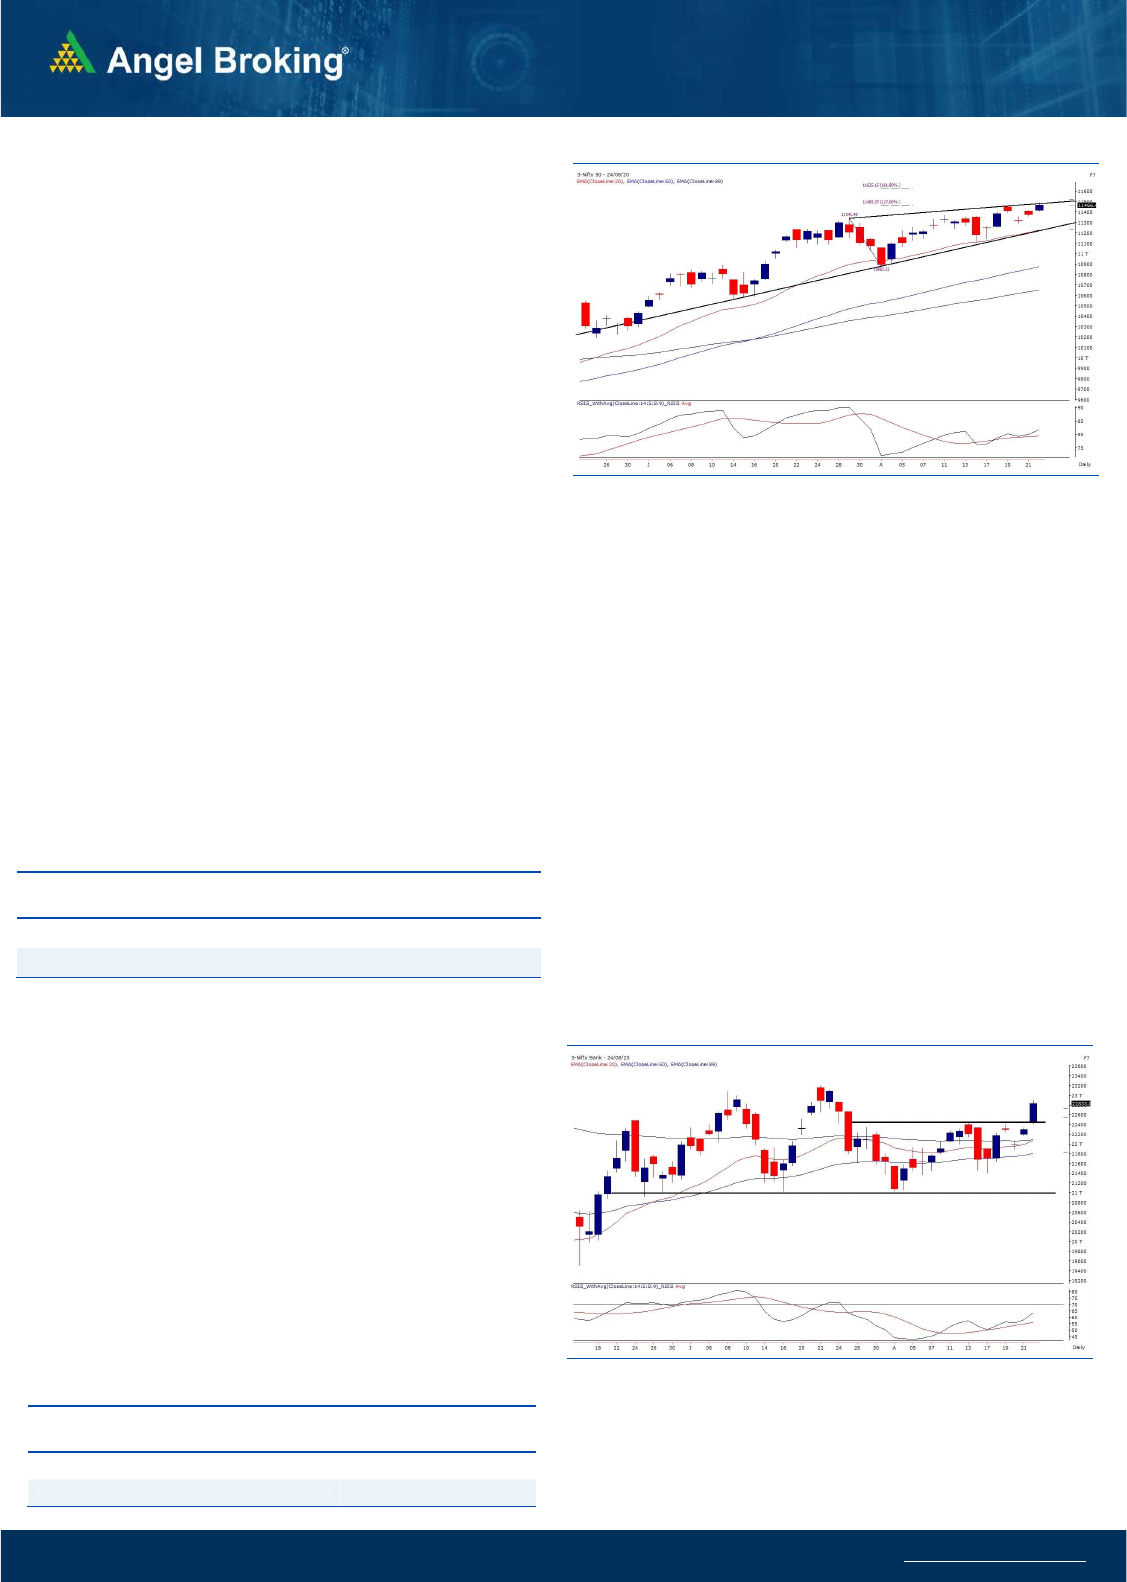
Sensex (38799) / Nifty (11466)
Markets across the globe were quite cheerful yesterday morning and
hence, we too started off higher above the 11400 mark. As the day
progressed, the positive momentum reinforced after a brief pause;
courtesy to smart surge in banking conglomerates. Eventually, the
benchmark continued it’s march towards 11500, marking highest
level since March fiasco.
Since last a week or so, we are sounding a bit cautious on the market.
But it seems that market is in no mood to give any sort of correction.
Actually, on the domestic front, there is no negative news flow which
is considered as positive and most importantly, major global
markets are clearly unstoppable, which is driving our markets higher.
Although we have actively participated in the recent midcap rally,
we still continue to be a watchful and would advise taking some
money off the table. Because when markets are giving such gravity
defying moves, nobody knows when and what’s going to trigger a
correction. And whenever it happens, it just comes as a surprise.
With a broader view, we remain extremely sanguine but do not want
to become complacent here and hence would advise against
aggressive longs in the market.
As far as levels are concerned, 11450-11500 is an extended zone
for us but with the flow, if it extends further, then we continue to
advise booking profits in case if Nifty heads towards 11550-11625.
Key Levels
Support 1 – 11410 Resistance 1 – 11550
Support 2 – 11360 Resistance 2 – 11625
Exhibit 2: Nifty Bank Daily Chart
www.angelbroking.com
Technical & Derivatives Report
August 25, 2020
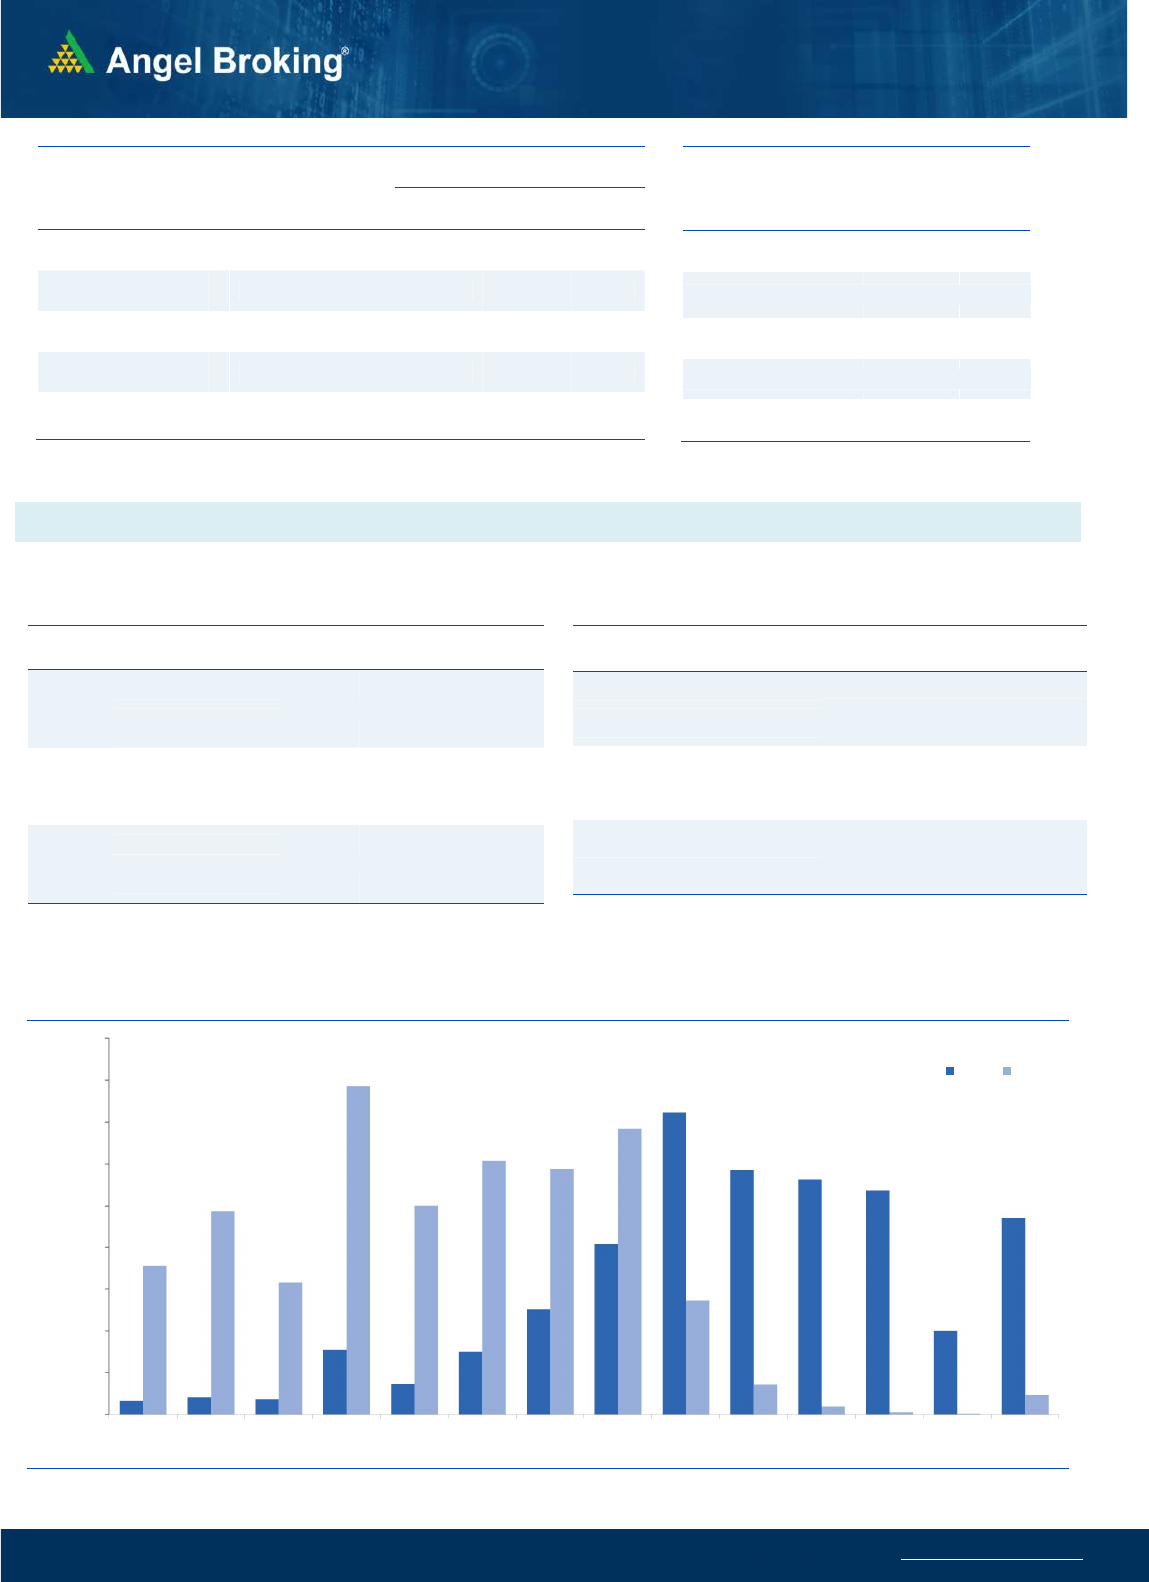
Nifty Vs OI
11000
11050
11100
11150
11200
11250
11300
11350
11400
11450
11500
11,000
11,100
11,200
11,300
11,400
11,500
11,600
11,700
11,800
11,900
12,000
8/10 8/11 8/12 8/13 8/14 8/17 8/18 8/19 8/20 8/21 8/24
(`000)
Openinterest Nifty
View
s
The indices opened on a positive note and traded with
a positive bias to end the day with gains of over eight-
tenths of a percent.
FIIs were net buyers in the cash market segment to the
tune of Rs. 219 crores. In index futures, they bought
worth 786 crores with no relevant change in open
interest, indicating a combination of long formation and
short covering
.
Nifty witnessed some unwinding of positions whereas
Bank Nifty added fresh longs, which led to
its outperformance. FII's formed longs in index futures
and covered some of the short positions; their 'Long
Short' Ratio stands over 64 percent. In options segment,
11400 call saw unwinding of positions as the market
rallied and 11400 put added new open interest. The
immediate support for the index is now around 11400
as per the data, whereas resistance is seen around
11500. If the index surpasses the 11500 mark and the
call writers run for cover, then it could lead to some
more momentum on the upside before the expiry.
C
o
mme
n
t
s
The Nifty futures open interest has decreased by 1.46%
Bank Nifty futures open interest has increased by 4.34%
as market closed at 11466.45 levels.
The Nifty August future closed with a premium of 7.7
point against a premium of 5.6 point in last trading
session. The September series closed at a premium of
16.35 point.
The INDIA VIX has decreased from 19.94 to 19.23
At the same time, the PCR-OI of Nifty increased from 1.54
to 1.63.
Few of the liquid counters where we have seen high cost
of carry are CANBK, RBLBANK, PNB, GMRINFRA, AND
MFSL.
OI Gainers
SCRIP OI
OI
CHG. (%)
PRICE
PRICE
CHG. (%)
IDEA 519120000 55.73 9.10 6.43
VOLTAS 3575000 32.65 661.65 0.54
TATACHEM 6490000 27.35 324.10 3.06
VEDL 129282400 24.11 128.80 -1.42
JINDALSTEL 21825000 21.69 225.80 0.56
JUBLFOOD 3313500 19.25 2123.85 7.54
ASHOKLEY 54585000 18.94 68.40 -1.15
FEDERALBNK 117835500 16.53 56.70 1.43
OI Losers
SCRIP OI
OI
CHG. (%)
PRICE
PRICE
CHG. (%)
MUTHOOTFIN 3092250 -17.64 1212.05 2.52
PNB 73584000 -15.85 35.30 -0.56
RBLBANK 16975400 -14.99 184.45 0.30
AMARAJABAT 1223000 -14.12 744.25 1.64
UJJIVAN 1463000 -10.98 249.65 -0.85
CENTURYTEX 1852200 -10.97 335.90 -1.44
TITAN 7145250 -10.41 1126.65 -0.96
BHEL 76314000 -9.98 40.90 0.24
Put-Call Ratio
SCRIP PCR-OI PCR-VOL
NIFTY 1.63 0.94
BANKNIFTY 1.27 0.75
RELIANCE 0.59 0.46
ICICIBANK 0.60 0.42
INFY 0.55 0.51
Historical Volatility
SCRIP HV
JUBLFOOD 53.12
ADANIENT 63.46
GMRINFRA 54.68
HDFCBANK 42.90
KOTAKBANK 54.23
www.angelbroking.com
Technical & Derivatives Report
August 25, 2020
Note: Above mentioned Bullish or Bearish Spreads in Nifty (August Series) are given as an information and not as a recommendation.
Nifty Spot =
11466.45
FII Statistics for August 24, 2020
Detail Buy
Sell Net
Open Interest
Contracts
Value
(in Cr.)
Change
(%)
INDEX
FUTURES
3731.75
2945.61
786.14
129687
10173.95
(0.02)
INDEX
OPTIONS
125392.76
124932.51
460.25
709822
56942.34
7.04
STOCK
FUTURES
33233.94
32805.51
428.43
1295431
92008.58
0.60
STOCK
OPTIONS
7488.02
7362.36
125.66
86661
6169.65
(10.03)
Total 169846.47
168045.99
1800.48
2221601
165294.52
2.05
Turnover on August 24, 2020
Instrument
No. of
Contracts
Turnover
( in Cr. )
Change
(%)
Index Futures 3,63,778 24774.26 26.64
Index Options
1,57,66,090
10,76,627.36
57.37
Stock Futures 14,20,800
1,03,472.43 45.78
Stock Options
16,53,569
1,26,516.77 14.17
Total 1,92,04,237
13,31,390.82
50.36
Bull-Call Spreads
Action Strike Price Risk Reward BEP
Buy 11500 58.15
37.05 62.95 11537.05
Sell 11600 21.10
Buy 11500 58.15
52.45 147.55 11552.45
Sell 11700 5.70
Buy 11600 21.10
15.40 84.60 11615.40
Sell 11700 5.70
Bear-Put Spreads
Action Strike Price Risk Reward BEP
Buy 11400 43.70
20.15 79.85 11379.85
Sell 11300 23.55
Buy 11400 43.70
30.10 169.90 11369.90
Sell 11200 13.60
Buy 11300 23.55
9.95 90.05 11290.05
Sell 11200 13.60
Nifty Put-Call Analysis
,0
500,000
1000,000
1500,000
2000,000
2500,000
3000,000
3500,000
4000,000
4500,000
10700 10800 10900 11000 11100 11200 11300 11400 11500 11600 11700 11800 11900 12000
Call Put

www.angelbroking.com
Technical & Derivatives Report
August 25, 2020
Daily Pivot Levels for Nifty Constituents
Scrips
S2
S1
PIVOT
R1
R2
ADANIPORTS
338
343
353
359
369
ASIANPAINT 1,910 1,936
1,966
1,992
2,022
AXISBANK
439
442
446
449
453
BAJAJ-AUTO 2,985 3,012
3,054
3,081
3,123
BAJFINANCE 3,355 3,424
3,469
3,538
3,583
BAJAJFINSV 6,223 6,311
6,383
6,472
6,544
BPCL
404
407
412
415
419
BHARTIARTL
498
513
523
537
547
INFRATEL
190
195
198
203
206
BRITANNIA 3,878 3,893
3,910
3,925
3,941
CIPLA
740
746
756
762
773
COALINDIA
137
139
140
141
143
DRREDDY 4,386 4,429
4,468
4,511
4,550
EICHERMOT 2,003 2,090
2,238
2,325
2,474
GAIL
100
101
102
103
104
GRASIM
650
661
677
688
704
HCLTECH
690
698
703
711
716
HDFCBANK 1,071 1,094
1,109
1,131
1,146
HDFC
592
595
600
604
609
HEROMOTOCO
1,792
1,811
1,830
1,849
1,868
HINDALCO 2,956 2,986
3,031
3,060
3,105
HINDUNILVR
189
191
195
197
200
ICICIBANK 2,179 2,187
2,199
2,207
2,220
IOC
371
376
378
383
386
INDUSINDBK
87
88
89
89
90
INFY
507
518
527
538
546
ITC
933
940
946
953
959
JSW STEEL
195
196
197
198
200
KOTAKBANK
281
283
285
288
290
LT 1,321 1,354
1,375
1,408
1,430
M&M
983
987
994
999
1,006
MARUTI
592
597
606
611
621
NESTLEIND 6,901 6,992
7,046
7,137
7,191
NTPC 16,222
16,351
16,529
16,657
16,836
ONGC
101
103
106
108
110
POWERGRID
80
81
81
82
82
RELIANCE
181
183
187
189
193
SHREECEM 2,056 2,076
2,090
2,110
2,124
SBIN 21,916
22,064
22,303
22,451
22,690
SUNPHARMA
197
199
201
203
205
TCS
523
528
533
539
544
TATAMOTORS 2,216 2,232
2,246
2,262
2,276
TATASTEEL
119
120
122
123
124
TECHM
422
426
432
435
441
TITAN
710
716
726
732
741
ULTRACEMCO 1,110 1,118
1,132
1,141
1,155
UPL 4,141 4,165
4,195
4,219
4,249
VEDANTA
491
494
499
503
508
WIPRO
270
272
273
274
276
ZEEL
189
195
200
206
210

www.angelbroking.com
Technical & Derivatives Report
August 25, 2020
*
Research Team Tel: 022 – 39357600 (Extn. 6844) Website: www.angelbroking.com
For Technical & Derivatives Queries E-mail: technicalresearch-cso@angelbroking.com
DISCLAIMER
Angel Broking Limited (hereinafter referred to as “Angel”) is a registered Member of National Stock Exchange of India Limited, Bombay
Stock Exchange Limited and Metropolitan Stock Exchange Limited. It is also registered as a Depository Participant with CDSL and
Portfolio Manager and Investment Adviser with SEBI. It also has registration with AMFI as a Mutual Fund Distributor. Angel Broking
Limited is a registered entity with SEBI for Research Analyst in terms of SEBI (Research Analyst) Regulations, 2014 vide registration
number INH000000164. Angel or its associates has not been debarred/ suspended by SEBI or any other regulatory authority for
accessing /dealing in securities Market. Angel or its associates/analyst has not received any compensation / managed or co-managed
public offering of securities of the company covered by Analyst during the past twelve months.
This document is solely for the personal information of the recipient, and must not be singularly used as the basis of any investment
decision. Nothing in this document should be construed as investment or financial advice. Each recipient of this document should make
such investigations as they deem necessary to arrive at an independent evaluation of an investment in the securities of the companies
referred to in this document (including the merits and risks involved), and should consult their own advisors to determine the merits
and risks of such an investment.
Reports based on technical and derivative analysis center on studying charts of a stock's price movement, outstanding positions and
trading volume, as opposed to focusing on a company's fundamentals and, as such, may not match with a report on a company's
fundamentals. Investors are advised to refer the Fundamental and Technical Research Reports available on our website to evaluate the
contrary view, if any.
The information in this document has been printed on the basis of publicly available information, internal data and other reliable
sources believed to be true, but we do not represent that it is accurate or complete and it should not be relied on as such, as this
document is for general guidance only. Angel Broking Limited or any of its affiliates/ group companies shall not be in any way
responsible for any loss or damage that may arise to any person from any inadvertent error in the information contained in this report.
Angel Broking Limited has not independently verified all the information contained within this document. Accordingly, we cannot
testify, nor make any representation or warranty, express or implied, to the accuracy, contents or data contained within this document.
While Angel Broking Limited endeavors to update on a reasonable basis the information discussed in this material, there may be
regulatory, compliance, or other reasons that prevent us from doing so.
This document is being supplied to you solely for your information, and its contents, information or data may not be reproduced,
redistributed or passed on, directly or indirectly.
Technical and Derivatives Team:
Sameet Chavan Chief Analyst - Technical & Derivatives sameet.chavan@angelbroking.com
Ruchit Jain Senior Analyst - Technical & Derivatives ruchit.jain@angelbroking.com
Rajesh Bhosale Technical Analyst rajesh.bhosle@angelbroking.com
Sneha Seth Derivatives Analyst sneha.seth@angelbroking.com
