www.angelbroking.com
Technical & Derivatives Report
June 25, 2020
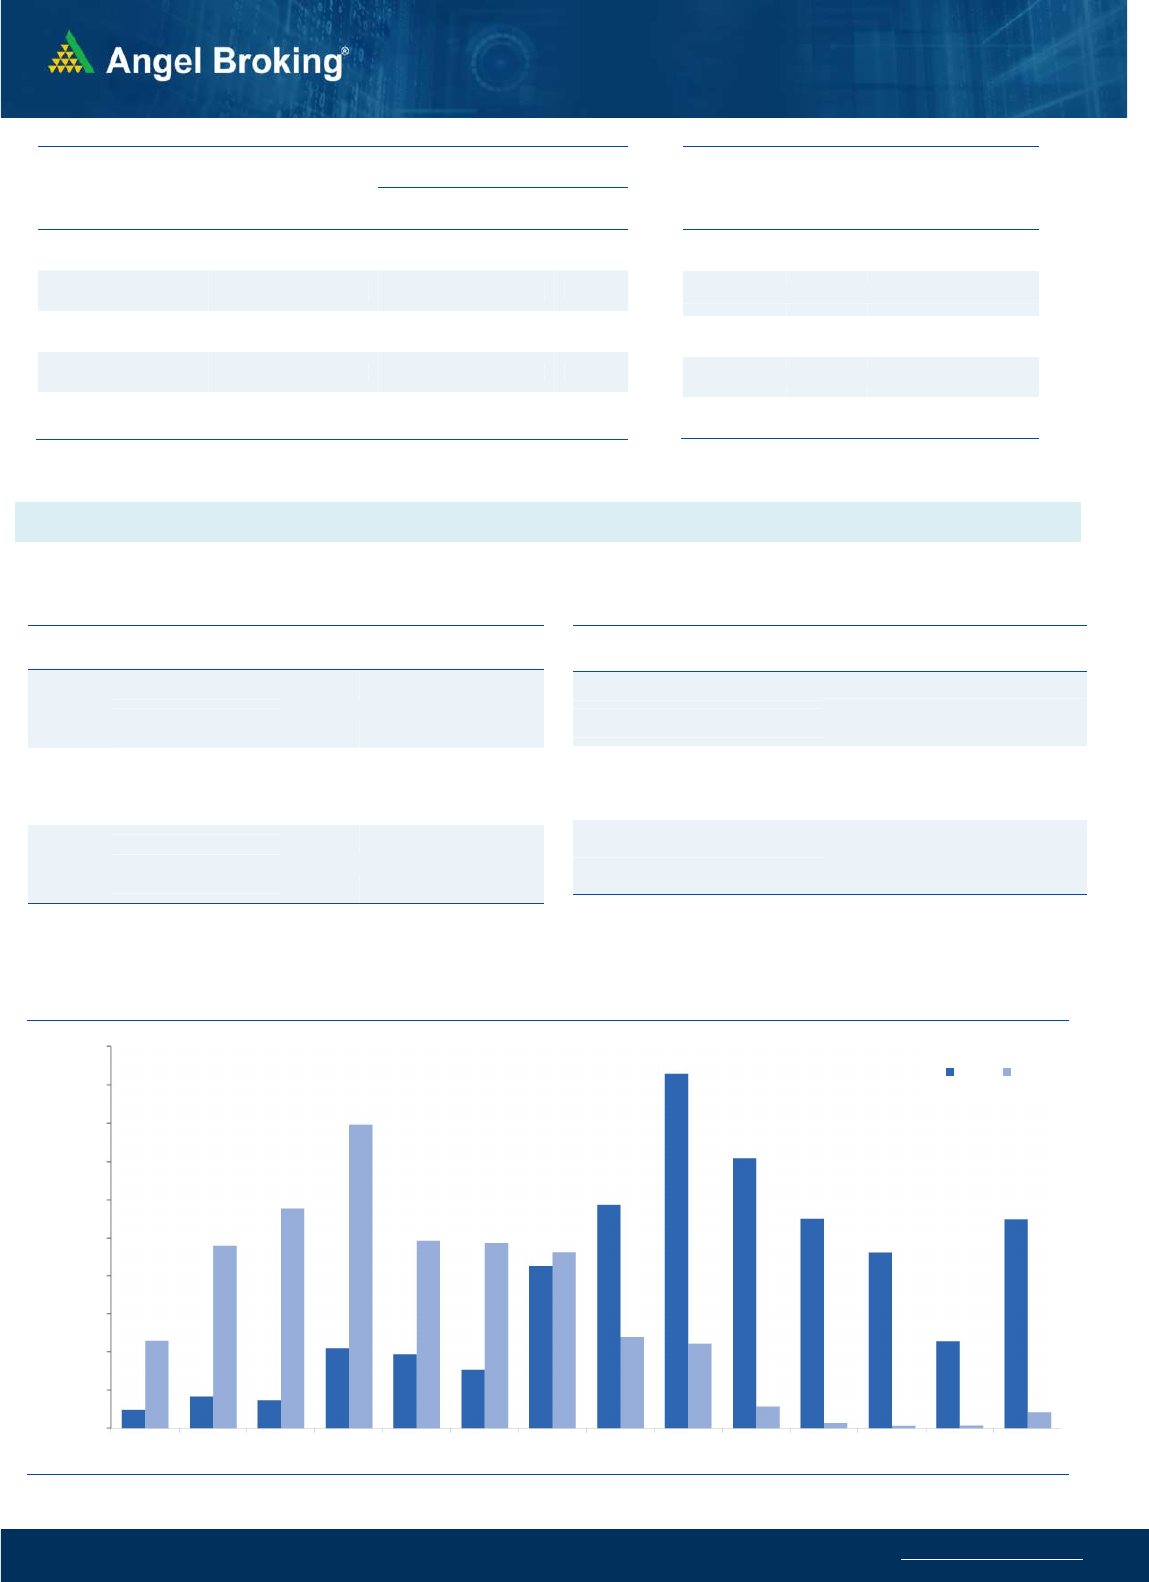
Nifty Bank Outlook - (21427)
Our markets started the session on a higher note, owing to
favourable global cues. After the initial up move, the banking
index slipped into a consolidation mode and saw some moderate
swings in a band of 300 points for some time. However post the
mid session, global markets started tumbling and tracking this, our
markets too nosedived considerably in last couple of hours.
Eventually the Bank Nifty ended the session nearly 1000 points
lower than it’s morning high.
The recent rally has been relentless and after reaching a cluster of
resistance, only a small reason needed to take some money off the
table. This was evident and is clearly what we witnessed yesterday.
With yesterday’s move, the daily chart does not look too
encouraging but at the same time, we are in two minds whether
to give importance to ‘Line Chart’ Cup and Handle formation or
yesterday’s bearish candle at a resistance zone. In our sense, to
get the clear picture, we need to assess things for next couple of
sessions. As of now, we remain hopeful as long as 21200-21000
is being held and on the higher side, the up move will get resumed
after seeing a close beyond the 22000 mark again.
Key Levels
Support 1 – 21200 Resistance 1 – 22000
Support 2 – 21000 Resistance 2 – 22200
Exhibit 1: Nifty Daily Chart
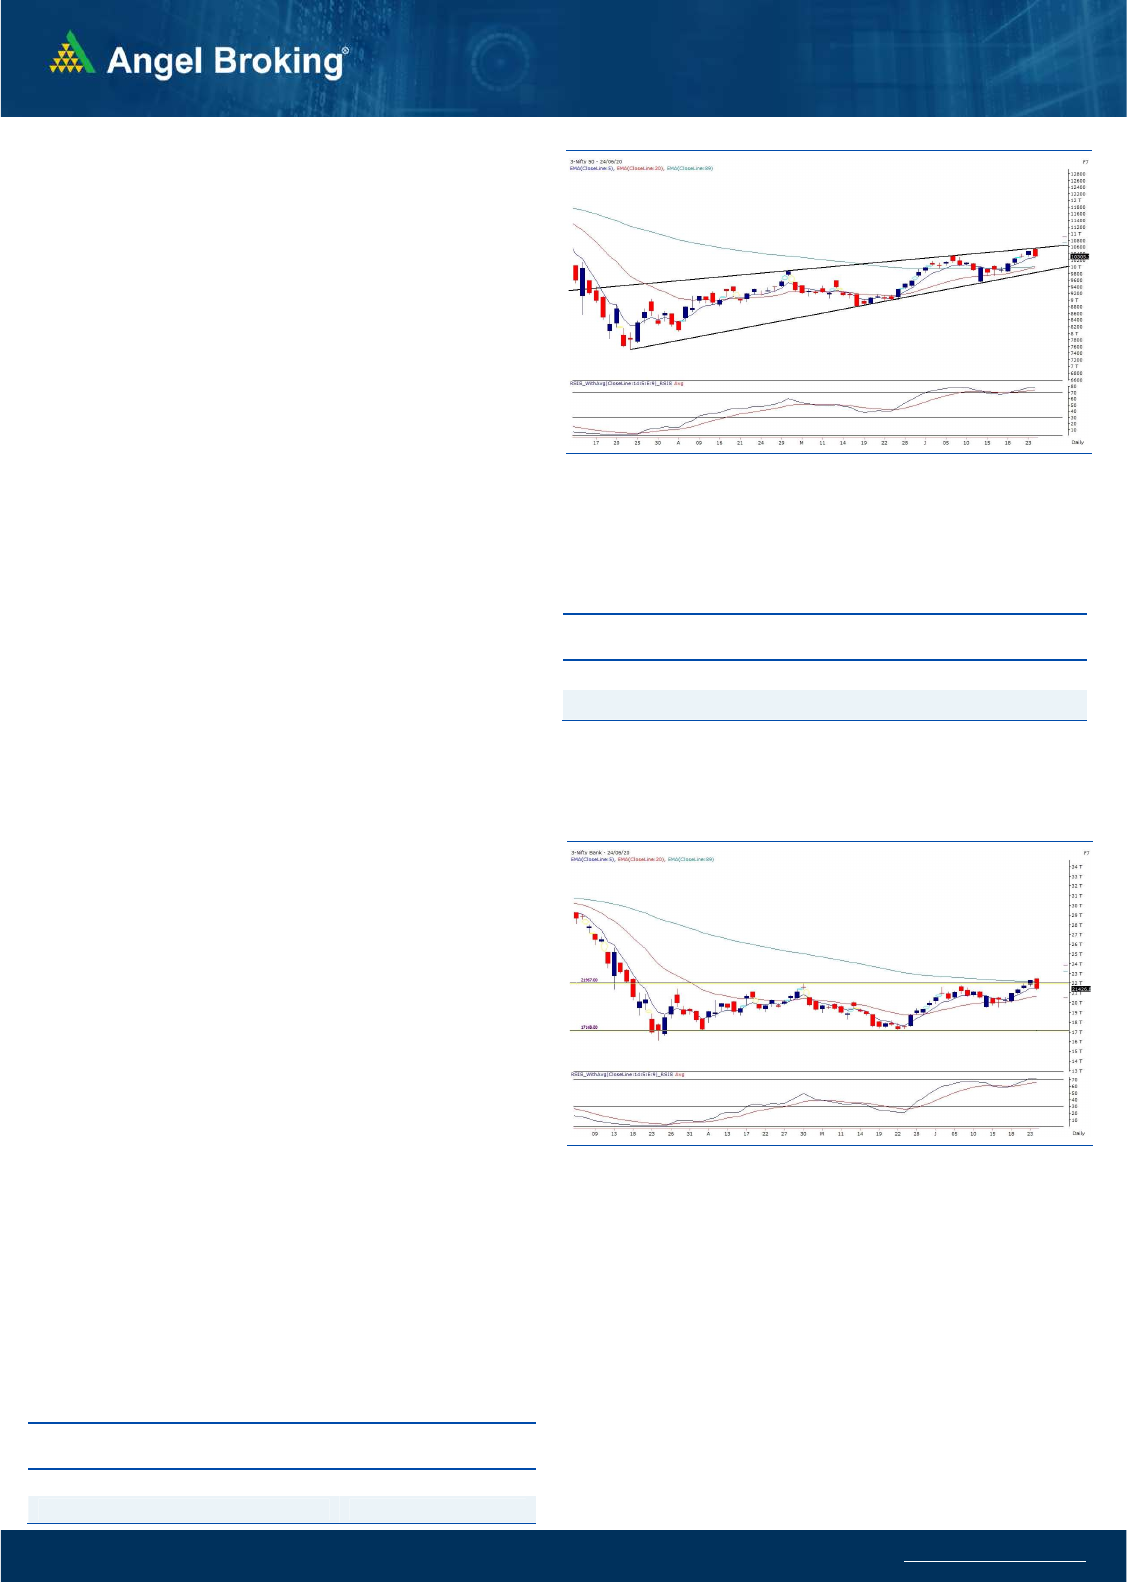
Sensex (34869) / Nifty (10305)
The index started trading on a positive note yesterday, however,
after consolidating in a range for first hour of the trade, it
corrected upto 10450 mark. We saw a pullback again towards the
opening level but the Nifty then witnessed a selling pressure for
rest of the session and ended with a cut of about one and a half
percent around 10300.
Post opening on a positive note, Nifty approached the level of
10550 which was the trendline resistance of the ‘Rising Wedge’
pattern on the daily chart. Also, as mentioned in our yesterday’s
outlook, this also coincided with the resistance end of a ‘Wolfe
Wave’ pattern on the daily chart of Nifty. The index precisely
corrected from this resistance yesterday and it ended with a deep
cut and has formed a ‘Bearish Engulfing’ pattern. This pattern, at
the above mentioned resistance point is a cautious signs for the
bulls. Some of the other sectoral indices too have formed a similar
candlestick pattern on their respective charts. The next couple of
sessions would be crucial to see how the market reacts hereon.
Exhibit 2: Nifty Bank Daily Chart
Hence, traders should prefer to stay light on positions for time being
and keep a wait and watch approach. The immediate supports for
Nifty are placed around 10200 followed by 10100 whereas
resistances are seen around 10480 and 10550.
Key Levels
Support 1 – 10200 Resistance 1 – 10480
Support 2 – 10100 Resistance 2 – 10550

www.angelbroking.com
Technical & Derivatives Report
June 25, 2020
Nifty Vs OI
9400
9600
9800
10000
10200
10400
10600
,0
2,000
4,000
6,000
8,000
10,000
12,000
14,000
16,000
6/9 6/10 6/11 6/12 6/15 6/16 6/17 6/18 6/19 6/22 6/23 6/24
(`000)
Openinterest Nifty
Vie
w
s
After a positive opening, Nifty witnessed choppy
moves during the morning session. However, post the
mid-session, Nifty witnessed sell-off to end with cuts
of 1.58% tad above 9300 levels.
FIIs were net buyers in the cash market segment to the
tune of Rs. 1767 crores. In index futures, they sold
worth 1051 crores with a decrease in open interest
indicating long unwinding and formation of short
positions
.
Nifty opened on a positive note but it witnessed selling
pressure with formation of short positions. FII's were net
buyers in cash segment but they were sellers in the
index futures segment. In index options, 10500 call
option had attracted writers in last few sessions. Inspite
of index surpassing the same, the writers kept their
positions intact and infact as the index then corrected,
10400 and 10500 call options witnessed open interest
addition. Hence, 10400 would be seen as immediate
resistance for today. On the flipside, 10200 and 10100
put options have decent open interest outstanding
whereas 10000 put option has highest open interest.
There could be higher volatility on the expiry day and
hence traders are advised to trade cautiously.
C
o
mme
n
t
s
The Nifty futures open interest has increased by 5.14%
Bank Nifty futures open interest has decreased by 8.70%
as market closed at 10305.30 levels.
The Nifty June future closed with a discount of 9.65 point
against a discount of 3.3 point in last trading session. The
July series closed at a discount of 24.55 point.
The INDIA VIX has increased from 29.34 to 29.58
At the same time, the PCR-OI of Nifty decreased from
1.63 to 1.29.
Few of the liquid counters where we have seen high cost
of carry are CENTURYTEX, JUSTDIAL, IDEA, POWERGRID
AND TATAPOWER.
OI Gainers
SCRIP OI
OI
CHG. (%)
PRICE
PRICE
CHG. (%)
ESCORTS 2646600 29.49 987.75 2.15
ONGC 81744300 17.67 83.10 -3.28
GAIL 35027232 8.85 101.40 2.26
EXIDEIND 12030700 7.07 149.55 -3.33
BERGEPAINT 4449500 6.36 540.80 5.05
AMARAJABAT 1640800 5.86 655.60 -1.16
RELIANCE 35235365 4.45 1727.85 0.26
NIITTECH 614250 4.33 1387.90 1.40
OI Losers
SCRIP OI
OI
CHG. (%)
PRICE
PRICE
CHG. (%)
UJJIVAN 3110100 -30.52 210.45 -4.73
ADANIPOWER 20030000 -24.87 37.75 -0.39
BEL 16601200 -22.09 82.50 -1.08
RAMCOCEM 1106900 -19.50 618.40 -4.39
FEDERALBNK 62377500 -17.67 53.25 -5.84
SRF 551000 -17.17 3601.40 -3.68
MINDTREE 1525600 -16.87 924.35 -0.57
IDEA 257320000 -16.47 9.80 -4.83
Put-Call Ratio
SCRIP PCR-OI PCR-VOL
NIFTY 1.29 0.95
BANKNIFTY 0.68 0.87
RELIANCE 0.80 0.45
ICICIBANK 0.61 0.60
INFY 0.75 0.75
Historical Volatility
SCRIP HV
PAGEIND 51.34
NAUKRI 61.03
POWERGRID 39.45
ICICIBANK 66.22
IBULHSGFIN 128.88
www.angelbroking.com
Technical & Derivatives Report
June 25, 2020
Note: Above mentioned Bullish or Bearish Spreads in Nifty (June Series) are given as an information and not as a recommendation.
Nifty Spot =
10305.30
FII Statistics for June 24, 2020
Detail Buy Sell Net
Open Interest
Contracts
Value
(in Cr.)
Change
(%)
INDEX
FUTURES
7459.20
8510.19
(1050.99) 136527
9405.67
(1.48)
INDEX
OPTIONS
400524.47
400590.03
(65.56) 907466
63433.36
4.52
STOCK
FUTURES
38843.34
38383.05
460.29
1383497
86345.81
(6.05)
STOCK
OPTIONS
5210.68
5077.32
133.36
65363
3613.14
(24.94)
Total 452037.69
452560.59
(522.90) 2492853
162797.98
(2.87)
Turnover on June 24, 2020
Instrument
No. of
Contracts
Turnover
( in Cr. )
Change
(%)
Index Futures 9,04,865 53552.67 39.10
Index Options 3,41,20,570
19,91,348.70
75.81
Stock Futures 21,13,244 1,25,160.01 3.14
Stock Options 13,84,986 85486.87 -5.24
Total 3,85,23,665
22,55,548.25
63.13
Bull-Call Spreads
Action Strike Price Risk Reward BEP
Buy 10300 57.55
33.25 66.75 10333.25
Sell 10400 24.30
Buy 10300 57.55
46.05 153.95 10346.05
Sell 10500 11.50
Buy 10400 24.30
12.80 87.20 10412.80
Sell 10500 11.50
Bear-Put Spreads
Action Strike Price Risk Reward BEP
Buy 10300 60.75
33.80 66.20 10266.20
Sell 10200 26.95
Buy 10300 60.75
46.55 153.45 10253.45
Sell 10100 14.20
Buy 10200 26.95
12.75 87.25 10187.25
Sell 10100 14.20
Nifty Put-Call Analysis
,0
500,000
1000,000
1500,000
2000,000
2500,000
3000,000
3500,000
4000,000
4500,000
5000,000
9700 9800 9900 10000 10100 10200 10300 10400 10500 10600 10700 10800 10900 11000
Call Put

www.angelbroking.com
Technical & Derivatives Report
June 25, 2020
Daily Pivot Levels for Nifty Constituents
Scrips
S2
S1
PIVOT
R1
R2
ADANIPORTS
343
348
354
358
364
ASIANPAINT 1,619 1,683
1,748
1,813
1,878
AXISBANK
405
415
432
441
458
BAJAJ-AUTO 2,693 2,755
2,868
2,930
3,042
BAJFINANCE 2,776 2,855
2,990
3,069
3,204
BAJAJFINSV 5,686 5,866
6,160
6,341
6,635
BPCL
363
371
383
390
402
BHARTIARTL
538
548
565
575
592
INFRATEL
223
228
233
238
243
BRITANNIA 3,399 3,423
3,464
3,488
3,529
CIPLA
607
619
641
653
675
COALINDIA
137
139
143
145
149
DRREDDY 3,961 4,002
4,069
4,110
4,178
EICHERMOT 17,619
18,028
18,259
18,668
18,899
GAIL
96
98
101
104
107
GRASIM
580
597
615
632
650
HCLTECH
539
549
565
575
590
HDFCBANK 1,013 1,023
1,040
1,050
1,067
HDFC 1,738 1,768
1,818
1,848
1,899
HEROMOTOCO
2,388
2,441
2,493
2,546
2,598
HINDALCO
144
148
154
158
164
HINDUNILVR 2,092 2,111
2,144
2,163
2,196
ICICIBANK
323
335
358
370
393
IOC
83
85
88
90
92
INDUSINDBK
442
462
496
516
550
INFY
699
707
717
724
734
ITC
182
187
191
196
199
JSW STEEL
183
188
198
204
213
KOTAKBANK 1,299 1,321
1,360
1,382
1,421
LT
928
942
966
980
1,004
M&M
503
509
519
524
534
MARUTI 5,600 5,678
5,808
5,886
6,016
NESTLEIND 16,355
16,531
16,696
16,872
17,037
NTPC
92
95
99
102
106
ONGC
80
82
84
86
88
POWERGRID
170
174
181
186
193
RELIANCE 1,676 1,702
1,737
1,763
1,798
SHREECEM 21,917
22,242
22,655
22,980
23,393
SBIN
177
181
188
192
199
SUNPHARMA
467
476
490
498
512
TCS 2,013 2,028
2,046
2,060
2,079
TATAMOTORS
100
102
107
109
113
TATASTEEL
316
321
330
335
343
TECHM
549
555
560
567
572
TITAN
959
974
1,000
1,014
1,041
ULTRACEMCO 3,672 3,747
3,881
3,956
4,091
UPL
423
434
452
463
481
VEDANTA
104
107
110
113
116
WIPRO
213
216
220
222
226
ZEEL
164
169
177
182
190

www.angelbroking.com
Technical & Derivatives Report
June 25, 2020
*
Research Team Tel: 022 – 39357600 (Extn. 6844) Website: www.angelbroking.com
For Technical & Derivatives Queries E-mail: technicalresearch-cso@angelbroking.com
DISCLAIMER
Angel Broking Limited (hereinafter referred to as “Angel”) is a registered Member of National Stock Exchange of India Limited, Bombay
Stock Exchange Limited and Metropolitan Stock Exchange Limited. It is also registered as a Depository Participant with CDSL and
Portfolio Manager and Investment Adviser with SEBI. It also has registration with AMFI as a Mutual Fund Distributor. Angel Broking
Limited is a registered entity with SEBI for Research Analyst in terms of SEBI (Research Analyst) Regulations, 2014 vide registration
number INH000000164. Angel or its associates has not been debarred/ suspended by SEBI or any other regulatory authority for
accessing /dealing in securities Market. Angel or its associates/analyst has not received any compensation / managed or co-managed
public offering of securities of the company covered by Analyst during the past twelve months.
This document is solely for the personal information of the recipient, and must not be singularly used as the basis of any investment
decision. Nothing in this document should be construed as investment or financial advice. Each recipient of this document should make
such investigations as they deem necessary to arrive at an independent evaluation of an investment in the securities of the companies
referred to in this document (including the merits and risks involved), and should consult their own advisors to determine the merits
and risks of such an investment.
Reports based on technical and derivative analysis center on studying charts of a stock's price movement, outstanding positions and
trading volume, as opposed to focusing on a company's fundamentals and, as such, may not match with a report on a company's
fundamentals. Investors are advised to refer the Fundamental and Technical Research Reports available on our website to evaluate the
contrary view, if any.
The information in this document has been printed on the basis of publicly available information, internal data and other reliable
sources believed to be true, but we do not represent that it is accurate or complete and it should not be relied on as such, as this
document is for general guidance only. Angel Broking Limited or any of its affiliates/ group companies shall not be in any way
responsible for any loss or damage that may arise to any person from any inadvertent error in the information contained in this report.
Angel Broking Limited has not independently verified all the information contained within this document. Accordingly, we cannot
testify, nor make any representation or warranty, express or implied, to the accuracy, contents or data contained within this document.
While Angel Broking Limited endeavors to update on a reasonable basis the information discussed in this material, there may be
regulatory, compliance, or other reasons that prevent us from doing so.
This document is being supplied to you solely for your information, and its contents, information or data may not be reproduced,
redistributed or passed on, directly or indirectly.
Technical and Derivatives Team:
Sameet Chavan Chief Analyst - Technical & Derivatives sameet.chavan@angelbroking.com
Ruchit Jain Senior Analyst - Technical & Derivatives ruchit.jain@angelbroking.com
Rajesh Bhosale Technical Analyst rajesh.bhosle@angelbroking.com
Sneha Seth Derivatives Analyst sneha.seth@angelbroking.com
