www.angelbroking.com
January 25, 2021
Technical & Derivatives Report
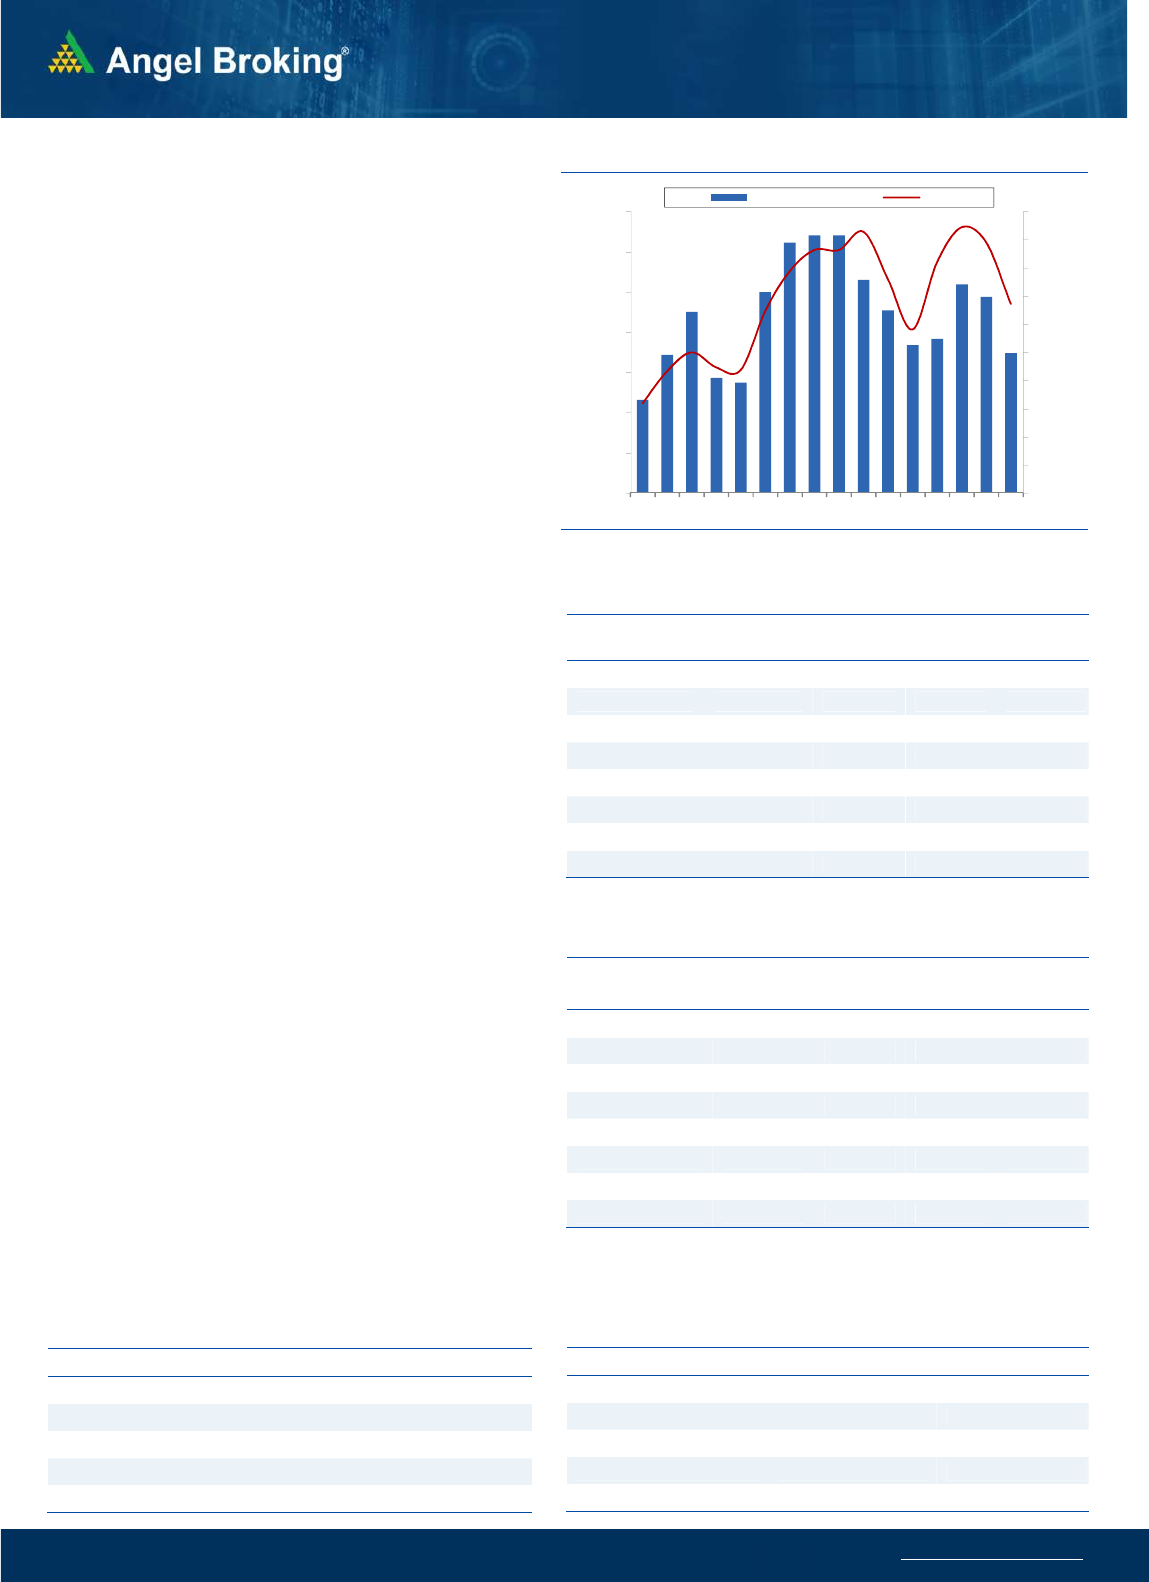
Nifty
Bank Out
look
-
(
31167)
On Friday, the Bank Index started on a weak note and with bearish
momentum throughout the session ended with a loss of 3.17% at
31167. During the last week, we remained cautious on the Bank
Index and we mentioned a stiff resistance around the 32700 -
33000 mark. On Thursday, despite Bank Nifty making a fresh new
high, it failed to sustain above the mentioned levels that triggered
a selloff in the last hour of the weekly expiry day. A follow-up
selling was seen on Friday resulting in a Double Top bearish
breakdown and now we sense the bank index is likely to see
further weakness going ahead in the near term. Traders are
advised to keep light on banking stocks and use any bounce to
exit longs. As far as levels are concerned 31500 - 31650 is the
immediate resistance whereas on the flip side 30900 - 30750 is
the next support zone.
Key Levels
Support 1 – 30900 Resistance 1 – 31500
Support 2 – 30750 Resistance 2 – 31650
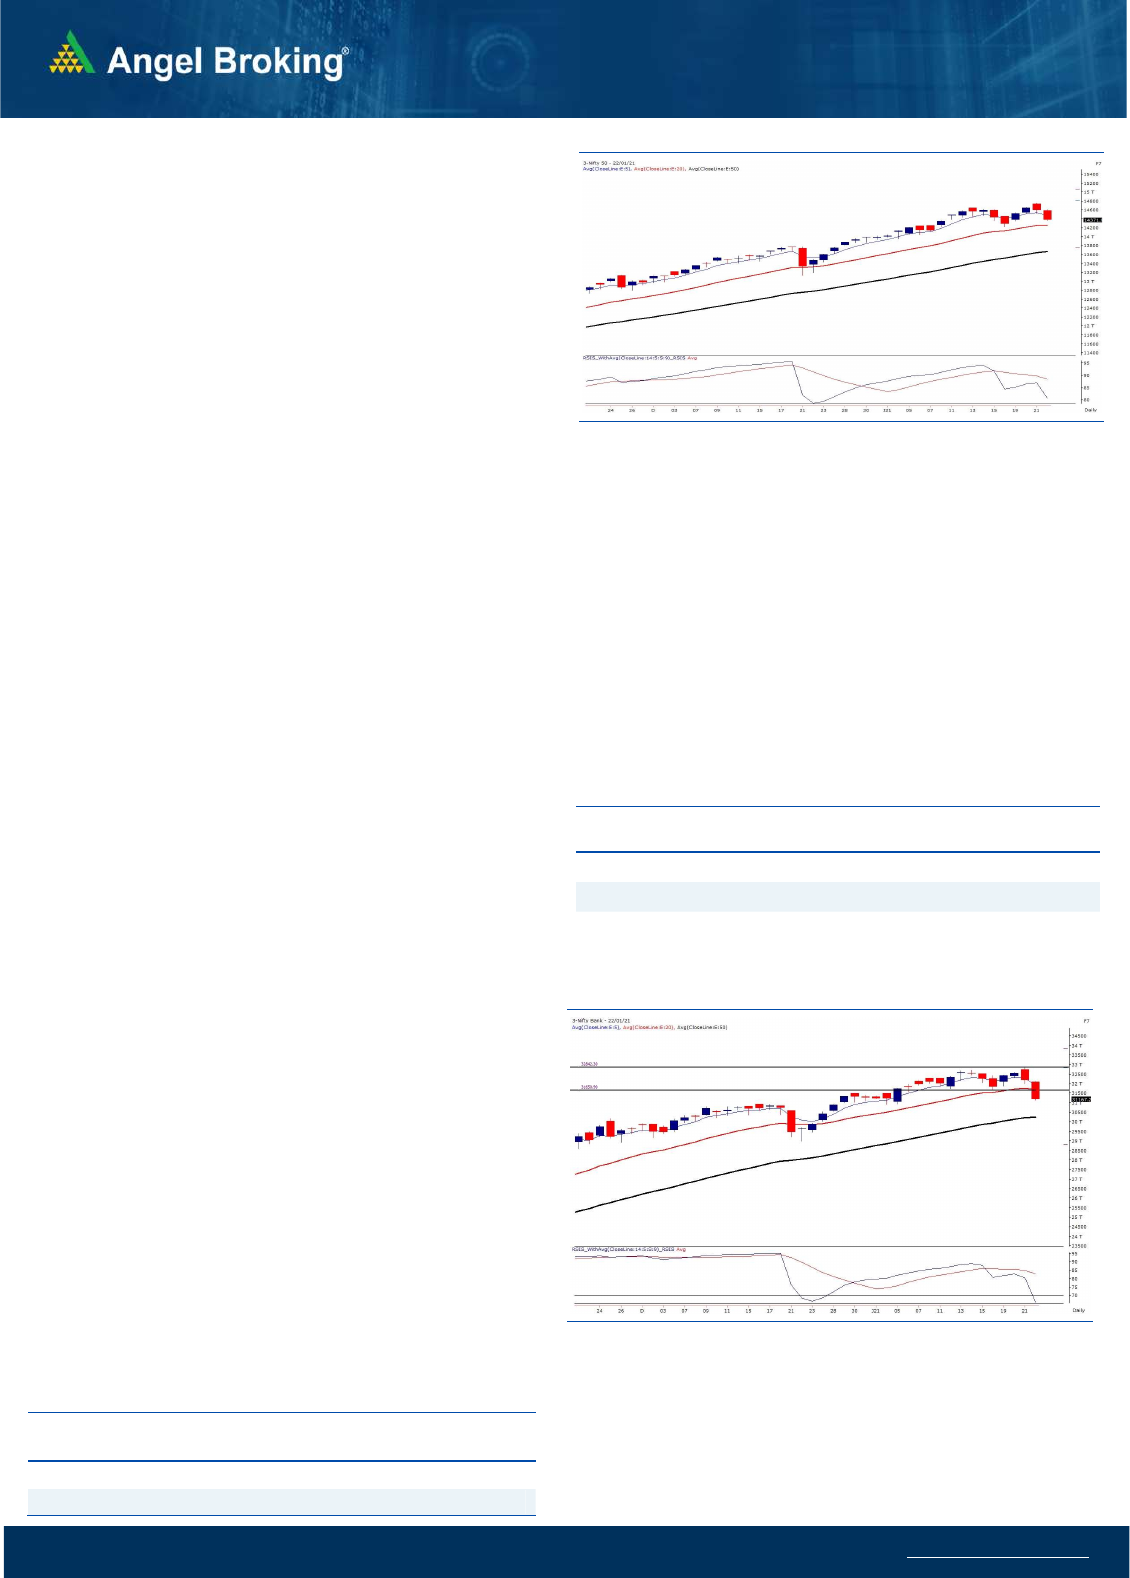
Exhibit 1: Nifty Daily Chart
Se
nsex
(
48879)
/ Nifty
(
14372
)
Last Friday’s weakness was carried over to Monday as well and
hence, Nifty witnessed a decent corrective move on the opening day
to test sub-14300 levels. However, the bulls were not ready to give
up easily as they came back strong on the subsequent two sessions
on the back of overall global optimism. In the process, almost all
major sectoral indices registered their new record highs. Everything
looked hunky dory until the sudden profit booking took place in the
last hour of the weekly expiry. This sell off went on to intensify on
the last day of the week to erase all weekly gains to conclude tad
below the 14400 mark.
Early in the week, markets took a smart U-turn on lot of positivity
across the globe. Although, new highs were being hit, we were not
convinced with the move and we had clearly stated this in our intra-
week commentary. The main reason behind this was indices (NIFTY,
BANKNIFTY and NIFTY MIDCAP 50) making new highs with the 3-
points Negative Divergence in the RSI-Smoothened oscillator on
daily chart. Such divergence with 3 points is generally considered a
sign of caution and hence, repeatedly we advised not getting carried
away by the euphoria. Now, although Nifty has not broken any major
supports, the development in BANKNIFTY does not look
encouraging at all. In fact, the entire banking and financial space
was the major culprit behind Friday’s correction as they took a solid
knock. To be specific, BANKNIFTY has confirmed a double top
pattern on daily chart and has broken its important swing low with
an ease. The weekly chart of the same exhibits a confirmation of
‘Long Legged Doji’ pattern. For Nifty, the important support to watch
out would be 14222, below which the recent bullish structure will
get distorted to extend the correction towards 14000 – 13800 levels.
On the higher side, 14500 – 14632 would be seen as immediate
hurdles.Historically, it is rare to see a major trend reversal ahead of
any mega event. Hence, it would be interesting to see how things
pan out in this week as the Union Budget is around the corner.
Looking at the price development, it does not look encouraging. All
eyes should be on the financial space; because if further weakness
has to come, it would certainly be led by this space. We continue to
advise staying light on positions and should ideally avoid creating
leveraged positions ahead of the budget (especially in high beta
counters). With a broader view, if any significant correction comes, it
would be a great opportunity to accumulate quality propositions in
a staggered manner.
Key Levels
Support 1 – 14222 Resistance 1 – 14500
Support 2 – 14100 Resistance2 – 14540
Exhibit 2: Nifty Bank Daily Chart
www.angelbroking.com
Technical & Derivatives Report
January 25, 2021
Nifty Vs OI
13700
13800
13900
14000
14100
14200
14300
14400
14500
14600
14700
12,000
12,500
13,000
13,500
14,000
14,500
15,000
15,500
1/1 1/5 1/7 1/11 1/13 1/15 1/19 1/21
(`000)
Openinterest Nifty
View
Post a negative start on the first day of the week, the Nifty
pulled higher on next couple of sessions and registered new
high around 14750 on Thursday. However, we witnessed a
correction in the later half on Thursday which continued on
the last day as well and the index ended the week below
14400.
FIIs were net sellers in the cash segment to the tune of
Rs. 636 crore. In index future segment, they sold worth Rs.
1471 crore with increase in open interest indicating short
formation and long unwinding on Friday.
Nifty witnessed unwinding of some positions while short
formations were seen in Bank Nifty. FII’s added some short
positions in the index futures and hence, their ‘Long Short
Ratio’ has declined to tad below 60 percent. In options
segment too, call writers have added decent amount of
positions and hence, upside seems to be limited in this
expiry week. Traders should prefer to lighten up longs on
any pullback moves towards 14450-14500. The immediate
support for Nifty is placed around 14200 and it would be
crucial to see how the market reacts if it comes around this
support.
C
o
mme
n
t
s
The Nifty futures open interest has decreased by 4.86%
Bank Nifty futures open interest has increased by 8.63%
as market closed at 14371.90 levels.
The Nifty January future closed with a premium of 8.25
point against a premium of 8.3 point in last trading
session. The February series closed at a premium of 48.05
point.
The INDIA VIX increased from 22.18 to 22.42.
At the same time, the PCR-OI of Nifty decreased from
1.28 to 1.14.
Few of the liquid counters where we have seen high cost
of carry are SUNTV, ULTRACEMCO, KOTAKBANK, DLF,
IDEA AND SHREECEM.
OI Gainers
SCRIP OI
OI
CHG. (%)
PRICE
PRICE
CHG. (%)
BIOCON 17657100 35.88 393.75 -10.99
RBLBANK 31659300 24.75 232.80 -8.41
ULTRACEMCO 1877200 24.35 5534.75 0.25
BAJAJ-AUTO 2226500 24.07 4089.70 9.92
APOLLOTYRE 19985000 18.57 231.90 6.53
BANDHANBNK 30376800 10.81 314.10 -7.58
TATAPOWER 98712000 10.47 79.40 -4.39
HINDALCO 25623700 9.48 239.20 -3.82
OI Losers
SCRIP OI
OI
CHG. (%)
PRICE
PRICE
CHG. (%)
SAIL 138567000 -10.33 58.20 -10.74
BAJAJFINSV 649875 -10.28 9071.10 -0.19
SUNTV 9667500 -9.91 507.85 1.98
WIPRO 32195200 -8.75 444.75 0.33
APOLLOHOSP 1503500 -8.71 2597.95 0.20
PEL 4288350 -7.56 1487.40 -4.74
BOSCHLTD 105100 -7.40 15670.55 -0.82
PAGEIND 66000 -7.37 29349.65 1.78
Put-Call Ratio
SCRIP PCR-OI PCR-VOL
NIFTY 1.14 1.00
BANKNIFTY 0.63 1.09
RELIANCE 0.53 0.54
ICICIBANK 0.50 0.70
INFY 0.35 0.45
Historical Volatility
SCRIP HV
BAJAJ-AUTO 41.04
BIOCON 60.86
SAIL 67.56
SRF 49.09
ASIANPAINT 38.10
www.angelbroking.com
Technical & Derivatives Report
January 25, 2021
Note: Above mentioned Bullish or Bearish Spreads in Nifty (January Series) are given as an information and not as a recommendation.
Nifty Spot =
14371.90
FII Statistics for January 22, 2020
Detail Buy
Net Contracts
Open Interest
Sell
Value
(in Cr.)
Change
INDEX
FUTURES
5613.93
7085.22
(1471.29) 141630
14085.02
4.75
INDEX
OPTIONS
431046.68
432539.10
(1492.42) 761027
75750.99
15.15
STOCK
FUTURES
28891.61
29358.62
(467.01) 1222407
99895.90
0.06
STOCK
OPTIONS
18465.83
18623.84
(158.01) 192581
15810.35
2.42
Total 484018.05
487606.78
(3588.73) 2317645
205542.26
5.07
Turnover on January 22, 2020
Instrume
nt
No. of
Contracts
Turnover
( in Cr. )
Change
(%)
Index Futures 5,89,658 53812.16 58.11
Index Options 2,92,50,524
26,72,175.85 -58.99
Stock Futures 14,19,862 1,26,546.11 25.42
Stock Options 29,47,252 2,73,585.01 7.05
Total 3,42,07,296
31,26,119.13 -54.74
Bull-Call Spreads
Action Strike Price Risk Reward BEP
Buy 14400 130.70
45.55 54.45 14445.55
Sell 14500 85.15
Buy 14400 130.70
78.10 121.90 14478.10
Sell 14600 52.60
Buy 14500 85.15
32.55 67.45 14532.55
Sell 14600 52.60
Bear-Put Spreads
Action Strike Price Risk Reward BEP
Buy 14400 149.90
42.50 57.50 14357.50
Sell 14300 107.40
Buy 14400 149.90
74.00 126.00 14326.00
Sell 14200 75.90
Buy 14300 107.40
31.50 68.50 14268.50
Sell 14200 75.90
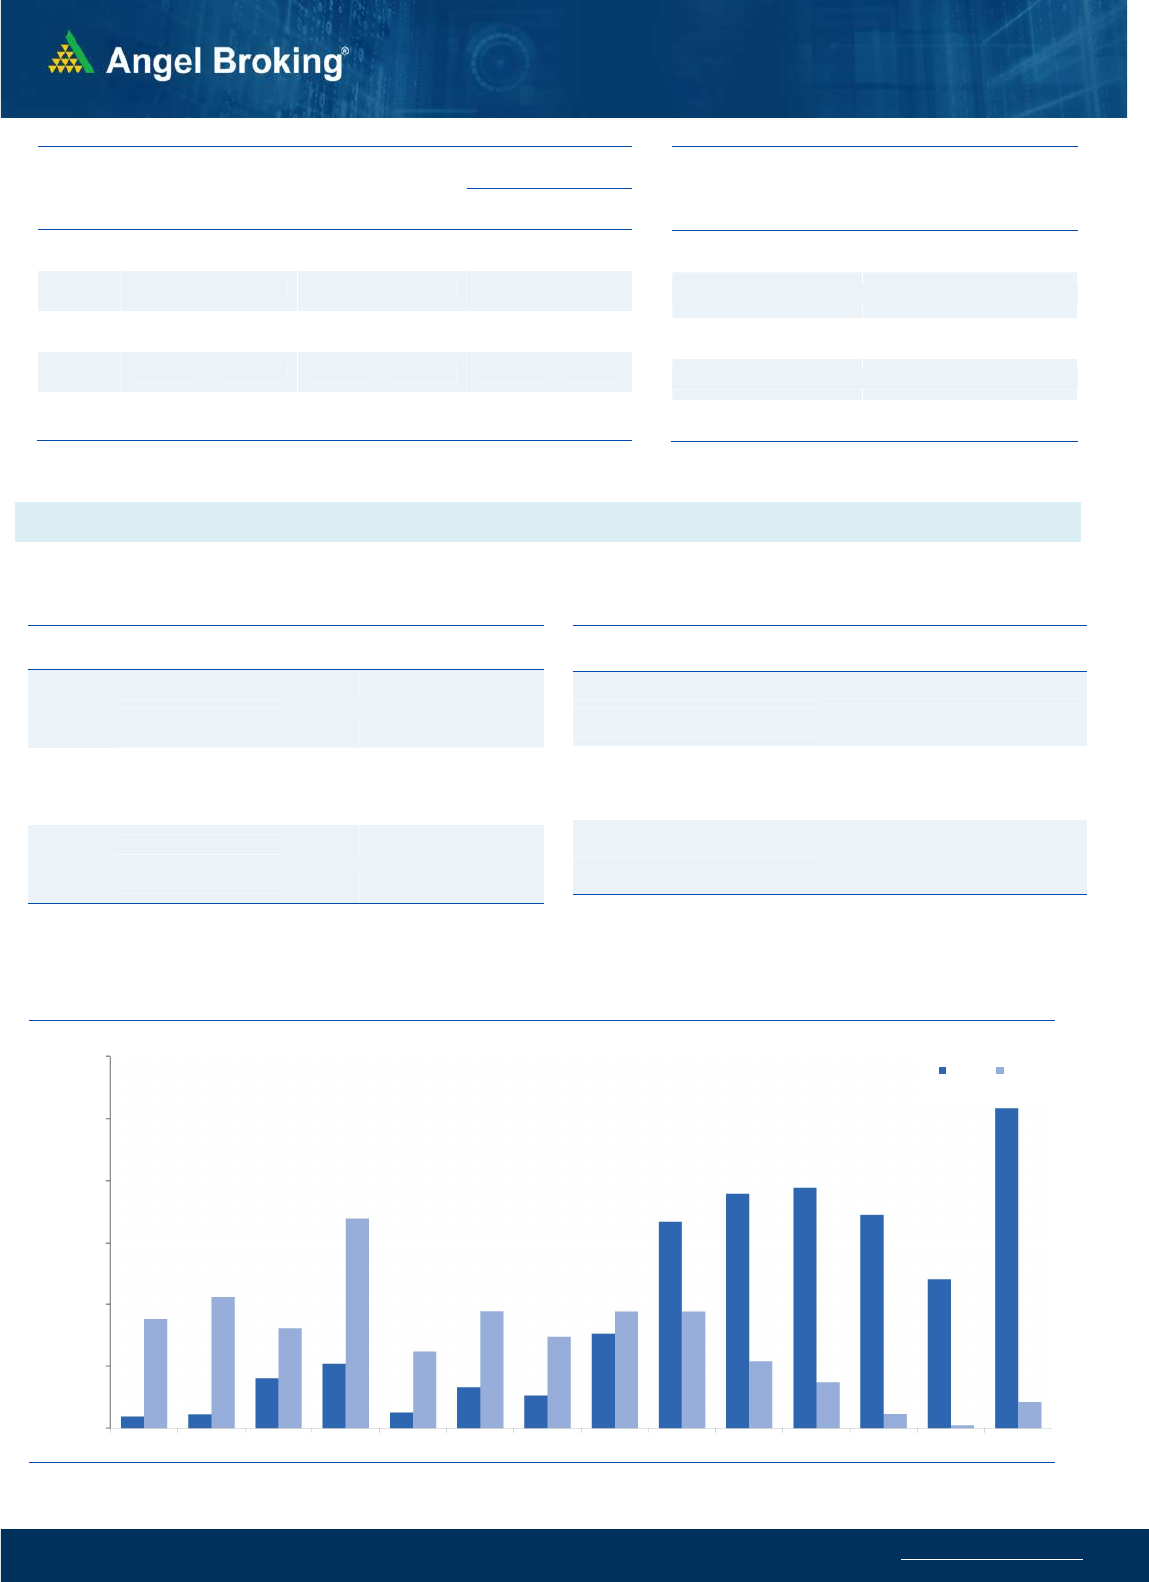
Nifty Put-Call Analysis
,0
1000,000
2000,000
3000,000
4000,000
5000,000
6000,000
13700 13800 13900 14000 14100 14200 14300 14400 14500 14600 14700 14800 14900 15000
Call Put

www.angelbroking.com
Technical & Derivatives Report
January 25, 2021
Da
ily
Pivot Level
s for
Nifty Constituents
Scrips
S2
S1
PIVOT
R1
R2
ADANIPORTS
516
526
542
552
567
ASIANPAINT 2,473 2,535
2,652
2,714
2,831
AXISBANK
617
631
652
666
688
BAJAJ-AUTO 3,597 3,843
3,987
4,233
4,376
BAJFINANCE 4,827 4,900
5,018
5,091
5,210
BAJAJFINSV 8,835 8,953
9,083
9,201
9,332
BPCL
383
390
401
408
419
BHARTIARTL
566
571
578
584
591
BRITANNIA 3,531 3,569
3,630
3,668
3,729
CIPLA
785
797
810
821
834
COALINDIA
129
131
135
137
140
DIVISLAB 3,479 3,512
3,563
3,596
3,647
DRREDDY 4,922 4,979
5,042
5,100
5,163
EICHERMOT 2,833 2,903
2,970
3,040
3,107
GAIL
131
133
134
136
138
GRASIM
981
992
1,012
1,023
1,042
HCLTECH
968
977
990
999
1,013
HDFCBANK 1,423 1,433
1,451
1,461
1,478
HDFCLIFE
669
678
693
703
718
HDFC 2,521 2,555
2,617
2,651
2,713
HEROMOTOCO 3,148 3,261
3,373
3,486
3,598
HINDALCO
227
233
242
247
256
HINDUNILVR 2,331 2,370
2,396
2,435
2,461
ICICIBANK
516
525
539
548
562
IOC
94
95
96
97
98
INDUSINDBK
862
878
906
922
950
INFY 1,312 1,326
1,341
1,356
1,371
ITC
206
208
212
214
217
JSW STEEL
356
366
382
391
407
KOTAKBANK 1,792 1,810
1,843
1,861
1,893
LT 1,335 1,349
1,362
1,375
1,388
M&M
775
787
807
818
838
MARUTI 7,811 7,930
8,119
8,238
8,427
NESTLEIND 17,342
17,466
17,674
17,798
18,006
NTPC
91
92
94
96
98
ONGC
91
92
94
95
97
POWERGRID
191
193
195
196
198
RELIANCE 1,987 2,018
2,067
2,098
2,147
SBILIFE
814
838
862
886
910
SHREECEM 23,287
23,491
23,816
24,020
24,346
SBIN
272
278
288
294
304
SUNPHARMA
561
568
578
585
594
TCS 3,207 3,255
3,290
3,338
3,373
TATAMOTORS
263
276
292
305
320
TATASTEEL
610
629
652
671
694
TECHM
957
969
987
999
1,017
TITAN 1,457 1,474
1,504
1,522
1,552
ULTRACEMCO 5,406 5,470
5,533
5,597
5,660
UPL
546
556
574
585
603
WIPRO
434
439
446
451
457

www.angelbroking.com
Technical & Derivatives Report
January 25, 2021
*
Research Team Tel: 022 – 39357600 (Extn. 6844) Website: www.angelbroking.com
For Technical Queries E-mail: technicalresearch-cso@angelbroking.com
DISCLAIMER
Angel Broking Limited (hereinafter referred to as “Angel”) is a registered Member of National Stock Exchange of India Limited, Bombay
Stock Exchange Limited and Metropolitan Stock Exchange Limited. It is also registered as a Depository Participant with CDSL and
Portfolio Manager and Investment Adviser with SEBI. It also has registration with AMFI as a Mutual Fund Distributor. Angel Broking
Limited is a registered entity with SEBI for Research Analyst in terms of SEBI (Research Analyst) Regulations, 2014 vide registration
number INH000000164. Angel or its associates has not been debarred/ suspended by SEBI or any other regulatory authority for
accessing /dealing in securities Market. Angel or its associates/analyst has not received any compensation / managed or co-managed
public offering of securities of the company covered by Analyst during the past twelve months.
This document is solely for the personal information of the recipient, and must not be singularly used as the basis of any investment
decision. Nothing in this document should be construed as investment or financial advice. Each recipient of this document should make
such investigations as they deem necessary to arrive at an independent evaluation of an investment in the securities of the companies
referred to in this document (including the merits and risks involved), and should consult their own advisors to determine the merits
and risks of such an investment.
Reports based on technical and derivative analysis center on studying charts of a stock's price movement, outstanding positions and
trading volume, as opposed to focusing on a company's fundamentals and, as such, may not match with a report on a company's
fundamentals. Investors are advised to refer the Fundamental and Technical Research Reports available on our website to evaluate the
contrary view, if any.
The information in this document has been printed on the basis of publicly available information, internal data and other reliable
sources believed to be true, but we do not represent that it is accurate or complete and it should not be relied on as such, as this
document is for general guidance only. Angel Broking Limited or any of its affiliates/ group companies shall not be in any way
responsible for any loss or damage that may arise to any person from any inadvertent error in the information contained in this report.
Angel Broking Limited has not independently verified all the information contained within this document. Accordingly, we cannot
testify, nor make any representation or warranty, express or implied, to the accuracy, contents or data contained within this document.
While Angel Broking Limited endeavors to update on a reasonable basis the information discussed in this material, there may be
regulatory, compliance, or other reasons that prevent us from doing so.
This document is being supplied to you solely for your information, and its contents, information or data may not be reproduced,
redistributed or passed on, directly or indirectly.
Technical and Derivatives Team:
Sameet Chavan Chief Analyst - Technical & Derivatives sameet.chavan@angelbroking.com
Ruchit Jain Senior Analyst - Technical & Derivatives ruchit.jain@angelbroking.com
Rajesh Bhosale Technical Analyst rajesh.bhosle@angelbroking.com
Sneha Seth Derivatives Analyst sneha.seth@angelbroking.com
