www.angelbroking.com
Technical & Derivatives Report
August 24, 2020
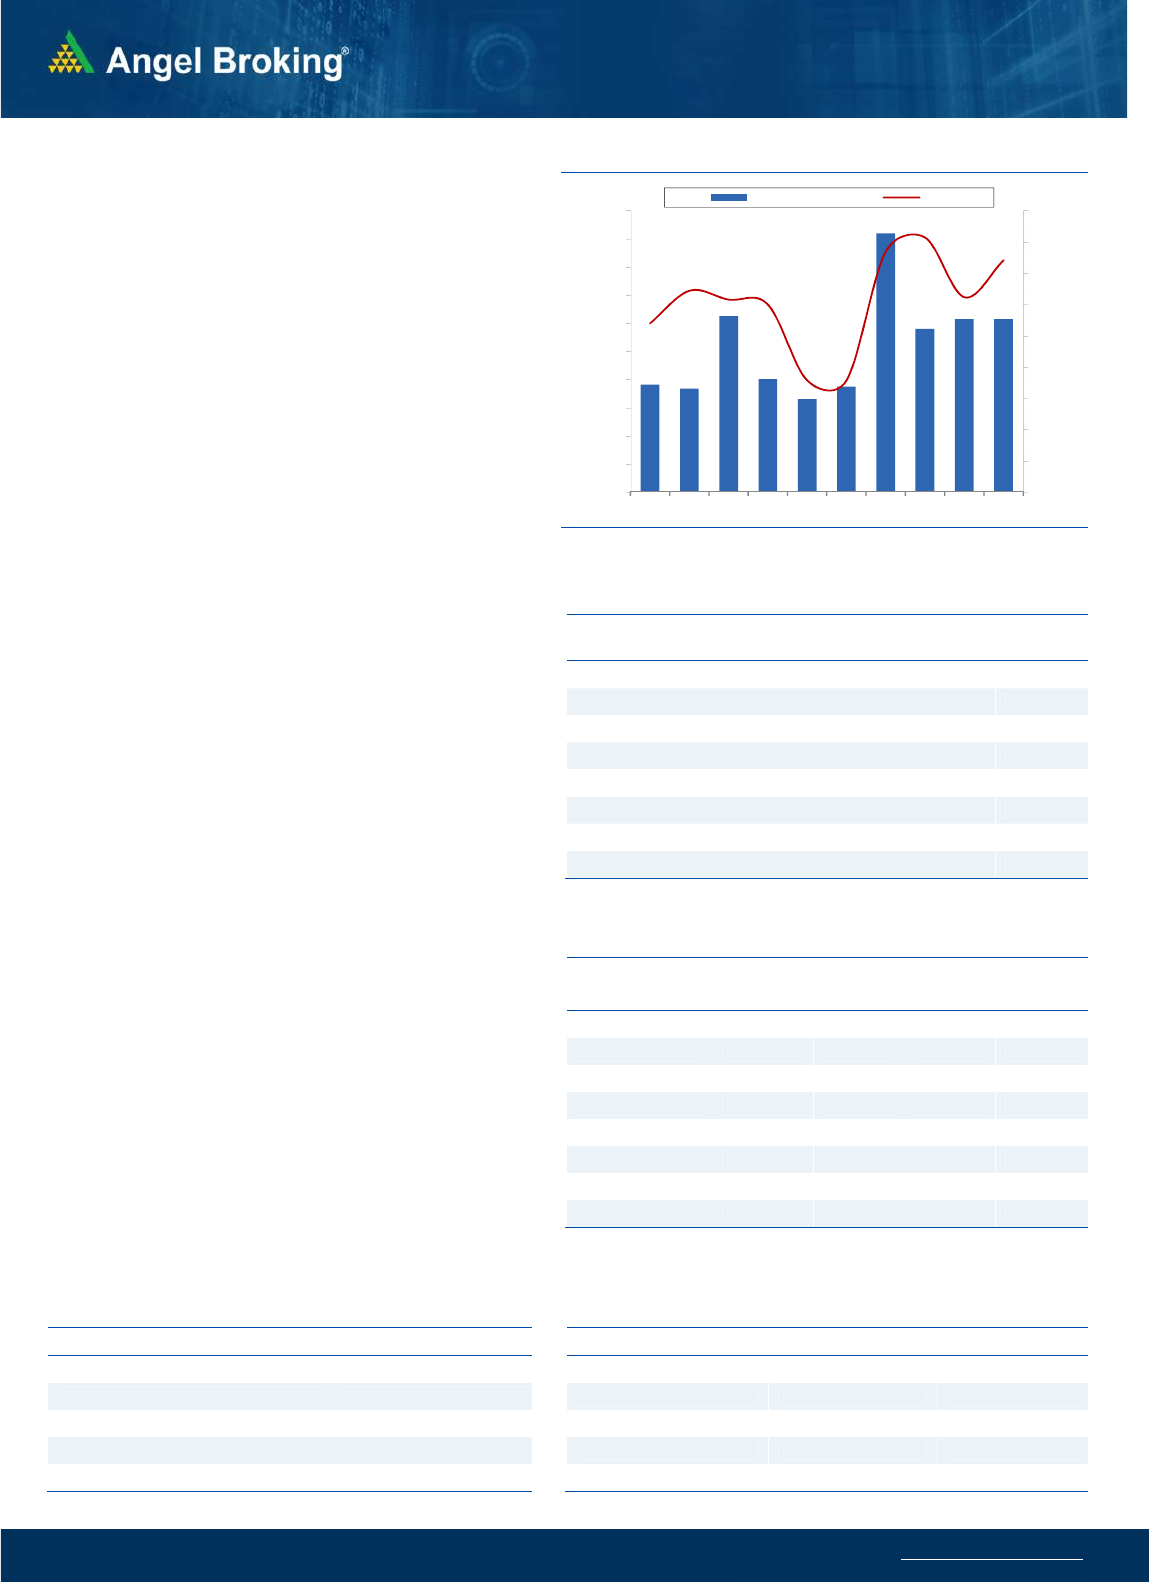
Nifty Bank Outlook - (22300)
On Friday, Bank Nifty started with a gap up opening and it
remained within a range throughout the session to end with gains
of 1.36% tad at 22300 levels.
On the daily chart, the bank index for the last one month is trading
in a range of 21000 and 22500. With the last week's activity, the
base has now shifted higher towards 21400 and we sense the next
directional move can only be seen on a breakout from 21400 -
22500 levels. Till then traders are advised to focus on individual
stocks within the basket as they are giving trading opportunities
on both sides of the trend. Immediate support is placed around
Friday's gap at 22080 followed by Thursday's low at 21886.
Key Levels
Support 1 – 22080 Resistance 1 – 22500
Support 2 – 21886 Resistance 2 – 22670
Exhibit 1: Nifty Daily Chart
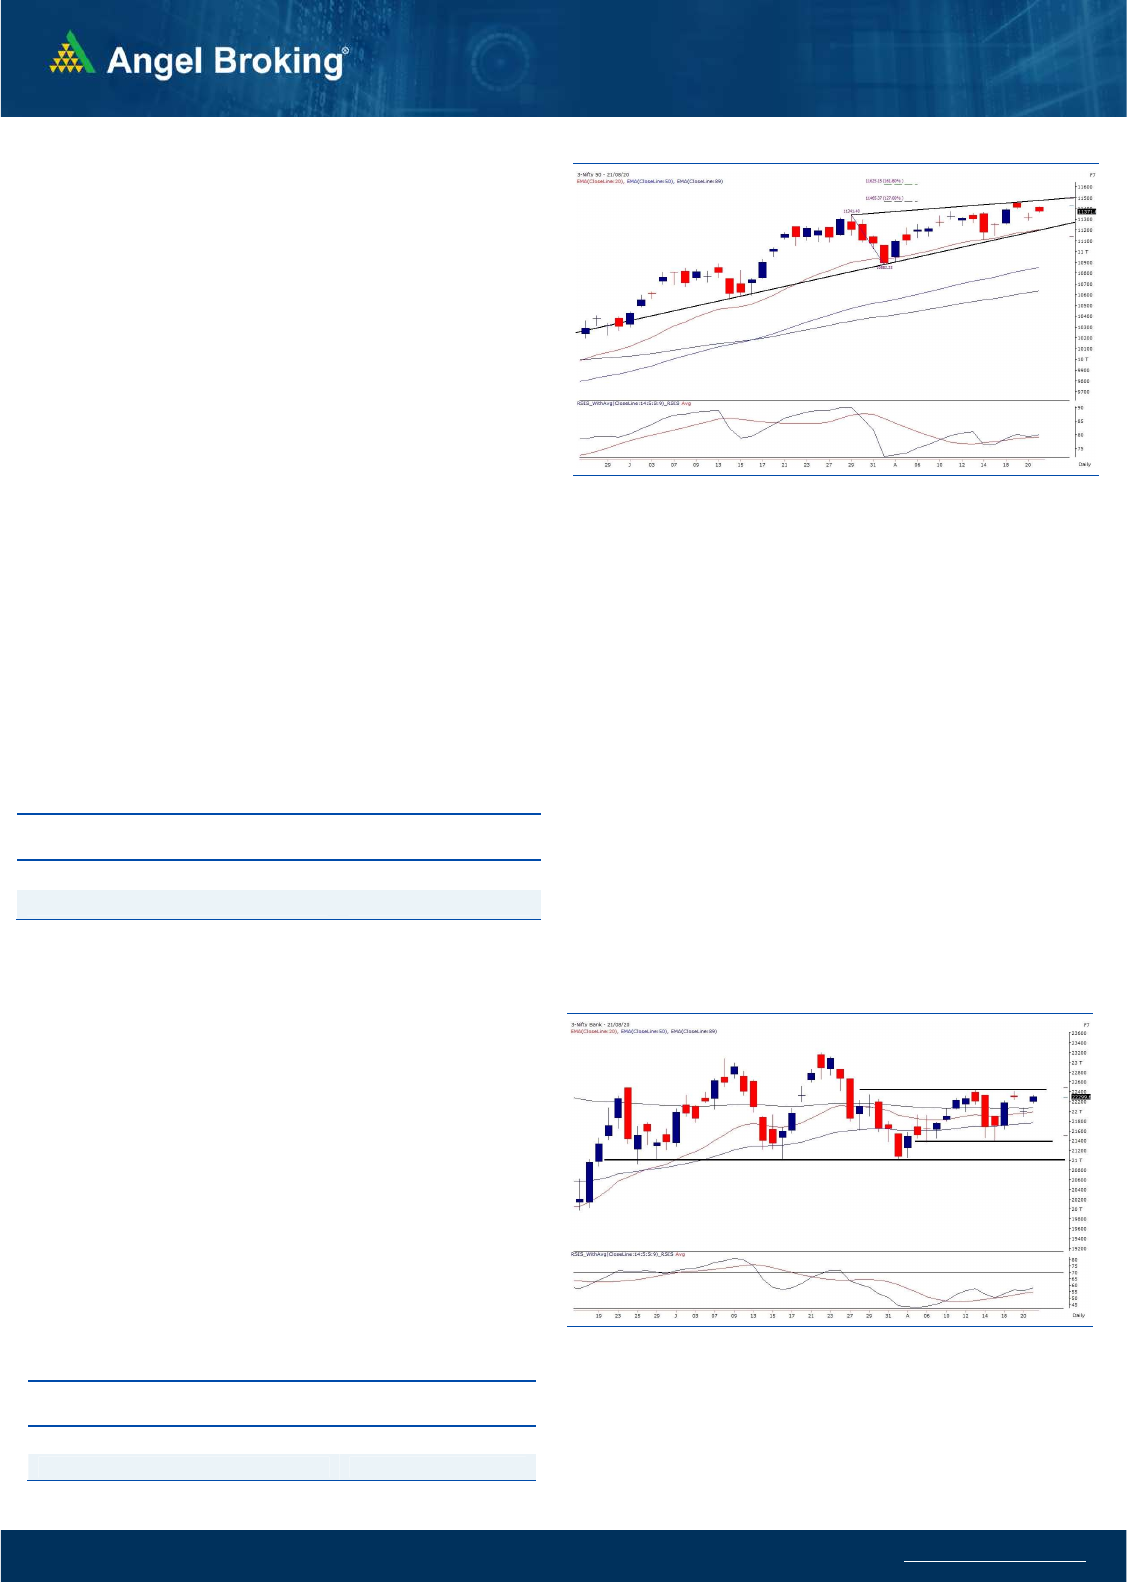
Sensex (38435) / Nifty (11372)
We kick started the last week higher on Monday on the back of a
cheerful mood across the globe. This was followed by a strong
trading session where we witnessed some robust moves in index
heavyweights as well as the broader market. During the remaining
part of the week, index just trapped in a range and had extremely
lethargic moves to register its highest weekly close after February
20, 2020.
Barring the first couple of days, it was once again a boring week for
index specific traders. Although, the Banking, Metal and Capital
Goods managed to chip in to some extent, but the real outshining
space has been the mid and small cap universe. Clearly, there has
been no stopping for this space and especially the way these stocks
just took off in the last three weeks. When midcap rally starts, it
generally creates a euphoric situation and this is clearly what we are
experiencing for the past few days. Nobody knows when and where
it’s going to stop and at the same time, it’s hard not to participate
also. The overall structure remains sturdy; but we believe that sooner
or later, the market is likely to witness some correction, which would
be healthy in the longer run. In the last five months, forget bearish,
we did not even sound cautious and used all dips to get into the
market. But now looking at a few observations, we do not want to
maintain similar optimism purely with the short-term view.
Key Levels
Support 1 – 11300 Resistance 1 – 11460
Support 2 – 11250 Resistance 2 – 11500
Exhibit 2: Nifty Bank Daily Chart
On the daily chart, we can see a small ‘Rising Wedge’ and ‘Bearish
Wolfe Wave’ pattern and a move below 11250-11200 would
confirm a near term reversal to undergo some price correction in
coming days. As far as the NIFTY MIDCAP 50 index is concerned,
although it has surpassed the weekly ‘200-SMA’ marginally, we
advise taking some money off the table now and aggressive bets
should ideally be avoided overnight. Adding to all this, we would like
to draw attention towards an important development in ‘US DOLLAR
INDEX’. We have seen massive correction in this over the past few
months, which has triggered some gravity defying moves in equity
markets; but now this index seems to have rebounded from key
supports along with the ‘Positive Divergence’ in RSI. Hence, further
pullback in the DOLLAR index can lead to some corrective moves
going forward. By mentioning all these points, we do not expect a
complete reversal, rather such intermediate correction is considered
a healthy development and provides better opportunities for those
who have missed the bus in the last few months.
www.angelbroking.com
Technical & Derivatives Report
August 24, 2020
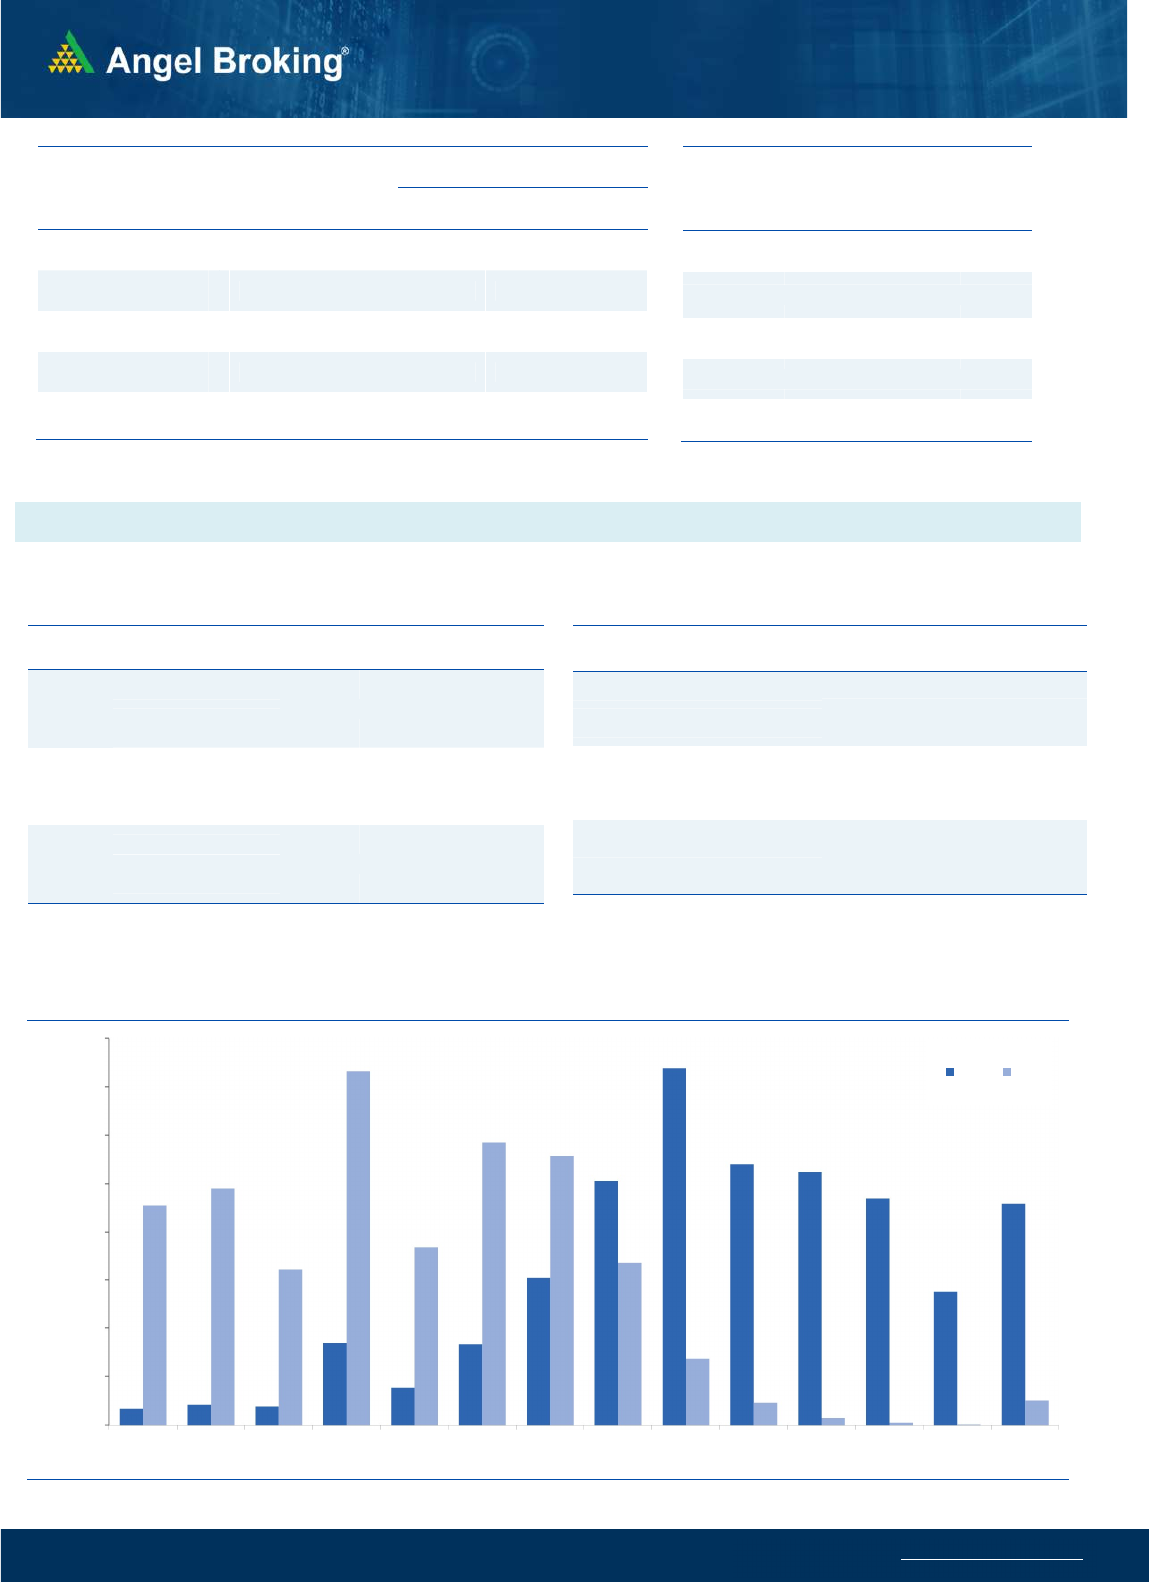
Nifty Vs OI
11000
11050
11100
11150
11200
11250
11300
11350
11400
11450
11,000
11,100
11,200
11,300
11,400
11,500
11,600
11,700
11,800
11,900
12,000
8/10 8/11 8/12 8/13 8/14 8/17 8/18 8/19 8/20 8/21
(`000)
Openinterest Nifty
View
s
Nifty rallied higher during the week upto 11460, and
then consolidated at the end of the week to register
weekly gains of about 200 points.
FIIs were net buyers in the cash market segment to the
tune of Rs. 410 crores. In index futures, they bought
worth 1236 crores with increase in open interest
indicating long formations and short covering on
Friday
.
During the week, FIIs added net longs in index futures
and 60% of their positions are on the long side. The
options data hints at a resistance around the 11500
mark while supports are placed at 11300 and 11200.
The index could consolidate within this range and
hence, traders are advised to trade with a stock specific
approach at the start of this week and watch for further
developments as we approach the monthly expiry day.
C
o
mme
n
t
s
The Nifty futures open interest has increased by 2.17%
Bank Nifty futures open interest has decreased by 3.36%
as market closed at 11371.6 levels.
The Nifty August future closed with a premium of 5.6
point against a discount of 6.8 point in last trading
session. The September series closed at a premium of
17.6 point.
The INDIA VIX has decreased from 20.62 to 19.94
At the same time, the PCR-OI of Nifty increased from 1.32
to 1.54.
Few of the liquid counters where we have seen high cost
of carry are BANKBARODA, RBLBANK, JINDALSTEL,
GMRINFRA AND IDEA.
OI Gainers
SCRIP OI
OI
CHG. (%)
PRICE
PRICE
CHG. (%)
BHEL 84777000 52.00 40.65 6.10
GMRINFRA 120060000 32.80 24.30 9.64
SAIL 60420000 18.75 42.45 1.91
MFSL 2637700 17.22 557.35 3.87
PNB 87444000 13.15 35.65 1.42
BOSCHLTD 112850 10.69 14196.95 3.05
L&TFH 36964800 10.38 67.75 -1.45
MOTHERSUMI 26453000 8.47 117.55 -1.67
OI Losers
SCRIP OI
OI
CHG. (%)
PRICE
PRICE
CHG. (%)
RBLBANK 19968000 -23.15 184.15 1.76
UJJIVAN 1643400 -21.53 251.45 -1.16
EQUITAS 12828800 -14.49 56.40 -0.53
CENTURYTEX 2080400 -11.60 340.90 0.95
TORNTPOWER 2598000 -10.91 355.15 -1.68
MUTHOOTFIN 3754500 -10.70 1182.00 -0.68
VOLTAS 2695000 -9.75 659.30 -1.42
NTPC 53466000 -8.68 105.95 4.74
Put-Call Ratio
SCRIP PCR-OI PCR-VOL
NIFTY 1.54 0.94
BANKNIFTY 0.97 0.84
RELIANCE 0.57 0.43
ICICIBANK 0.48 0.53
INFY 0.54 0.48
Historical Volatility
SCRIP HV
GMRINFRA 54.54
PAGEIND 48.07
NTPC 39.94
POWERGRID 38.40
ASIANPAINT 40.83
www.angelbroking.com
Technical & Derivatives Report
August 24, 2020
Note: Above mentioned Bullish or Bearish Spreads in Nifty (August Series) are given as an information and not as a recommendation.
Nifty Spot =
11371.60
FII Statistics for August 21, 2020
Detail Buy
Sell Net
Open Interest
Contracts
Value
(in Cr.)
Change
(%)
INDEX
FUTURES
3369.00
2132.56
1236.44
129709
10121.76
2.64
INDEX
OPTIONS
83722.67
83041.46
681.21
663153
52648.36
15.98
STOCK
FUTURES
19275.76
18960.41
315.35
1287766
90472.57
(0.14)
STOCK
OPTIONS
7087.22
7122.11
(34.89) 96319
6852.74
(3.55)
Total 113454.65
111256.54
2198.11
2176947
160095.43
4.28
Turnover on August 21, 2020
Instrument
No. of
Contracts
Turnover
( in Cr. )
Change
(%)
Index Futures 2,86,857 19562.75 -26.60
Index Options 98,02,989 6,84,142.05 -79.38
Stock Futures 9,91,801 70976.45 15.34
Stock Options 14,64,969 1,10,815.00 20.13
Total 1,25,46,616
8,85,496.25 -74.69
Bull-Call Spreads
Action Strike Price Risk Reward BEP
Buy 11400 75.35
41.05 58.95 11441.05
Sell 11500 34.30
Buy 11400 75.35
62.70 137.30 11462.70
Sell 11600 12.65
Buy 11500 34.30
21.65 78.35 11521.65
Sell 11600 12.65
Bear-Put Spreads
Action Strike Price Risk Reward BEP
Buy 11300 57.40
23.15 76.85 11276.85
Sell 11200 34.25
Buy 11300 57.40
36.00 164.00 11264.00
Sell 11100 21.40
Buy 11200 34.25
12.85 87.15 11187.15
Sell 11100 21.40
Nifty Put-Call Analysis
,0
500,000
1000,000
1500,000
2000,000
2500,000
3000,000
3500,000
4000,000
10700 10800 10900 11000 11100 11200 11300 11400 11500 11600 11700 11800 11900 12000
Call Put

www.angelbroking.com
Technical & Derivatives Report
August 24, 2020
Daily Pivot Levels for Nifty Constituents
Scrips
S2
S1
PIVOT
R1
R2
ADANIPORTS
349
352
356
358
362
ASIANPAINT 1,845 1,901
1,937
1,994
2,030
AXISBANK
432
436
441
445
449
BAJAJ-AUTO 3,018 3,036
3,055
3,073
3,092
BAJFINANCE 3,343 3,366
3,403
3,426
3,463
BAJAJFINSV 6,197 6,240
6,303
6,346
6,409
BPCL
402
406
412
417
423
BHARTIARTL
508
514
522
528
536
INFRATEL
196
198
199
201
203
BRITANNIA 3,840 3,861
3,887
3,908
3,934
CIPLA
752
756
763
768
775
COALINDIA
137
138
140
141
143
DRREDDY 4,448 4,469
4,494
4,515
4,541
EICHERMOT 21,311
21,507
21,675
21,871
22,039
GAIL
100
101
102
103
104
GRASIM
662
670
676
684
691
HCLTECH
696
701
708
713
720
HDFCBANK 1,055 1,071
1,080
1,095
1,104
HDFC
588
593
601
606
614
HEROMOTOCO
1,768
1,786
1,805
1,823
1,843
HINDALCO 2,921 2,977
3,013
3,070
3,106
HINDUNILVR
190
193
198
201
206
ICICIBANK 2,178 2,190
2,199
2,211
2,221
IOC
364
368
370
374
376
INDUSINDBK
87
88
89
90
91
INFY
507
510
516
519
525
ITC
936
942
953
959
970
JSW STEEL
195
196
197
199
200
KOTAKBANK
276
279
283
286
291
LT 1,320 1,330
1,341
1,351
1,362
M&M
981
987
999
1,005
1,017
MARUTI
600
605
613
618
626
NESTLEIND 6,882 6,928
6,996
7,042
7,110
NTPC 16,061
16,311
16,501
16,751
16,941
ONGC
99
102
105
109
111
POWERGRID
79
80
82
83
85
RELIANCE
180
184
187
192
195
SHREECEM 2,049 2,065
2,094
2,110
2,139
SBIN 21,928
22,123
22,295
22,490
22,663
SUNPHARMA
195
197
199
201
203
TCS
517
525
532
539
546
TATAMOTORS 2,224 2,236
2,254
2,266
2,284
TATASTEEL
118
119
122
123
126
TECHM
417
423
432
438
448
TITAN
726
730
733
736
740
ULTRACEMCO 1,122 1,130
1,137
1,145
1,152
UPL 4,114 4,151
4,177
4,214
4,239
VEDANTA
483
488
496
501
509
WIPRO
269
271
275
277
281
ZEEL
180
186
195
201
210

www.angelbroking.com
Technical & Derivatives Report
August 24, 2020
*
Research Team Tel: 022 – 39357600 (Extn. 6844) Website: www.angelbroking.com
For Technical & Derivatives Queries E-mail: technic[email protected]
DISCLAIMER
Angel Broking Limited (hereinafter referred to as “Angel”) is a registered Member of National Stock Exchange of India Limited, Bombay
Stock Exchange Limited and Metropolitan Stock Exchange Limited. It is also registered as a Depository Participant with CDSL and
Portfolio Manager and Investment Adviser with SEBI. It also has registration with AMFI as a Mutual Fund Distributor. Angel Broking
Limited is a registered entity with SEBI for Research Analyst in terms of SEBI (Research Analyst) Regulations, 2014 vide registration
number INH000000164. Angel or its associates has not been debarred/ suspended by SEBI or any other regulatory authority for
accessing /dealing in securities Market. Angel or its associates/analyst has not received any compensation / managed or co-managed
public offering of securities of the company covered by Analyst during the past twelve months.
This document is solely for the personal information of the recipient, and must not be singularly used as the basis of any investment
decision. Nothing in this document should be construed as investment or financial advice. Each recipient of this document should make
such investigations as they deem necessary to arrive at an independent evaluation of an investment in the securities of the companies
referred to in this document (including the merits and risks involved), and should consult their own advisors to determine the merits
and risks of such an investment.
Reports based on technical and derivative analysis center on studying charts of a stock's price movement, outstanding positions and
trading volume, as opposed to focusing on a company's fundamentals and, as such, may not match with a report on a company's
fundamentals. Investors are advised to refer the Fundamental and Technical Research Reports available on our website to evaluate the
contrary view, if any.
The information in this document has been printed on the basis of publicly available information, internal data and other reliable
sources believed to be true, but we do not represent that it is accurate or complete and it should not be relied on as such, as this
document is for general guidance only. Angel Broking Limited or any of its affiliates/ group companies shall not be in any way
responsible for any loss or damage that may arise to any person from any inadvertent error in the information contained in this report.
Angel Broking Limited has not independently verified all the information contained within this document. Accordingly, we cannot
testify, nor make any representation or warranty, express or implied, to the accuracy, contents or data contained within this document.
While Angel Broking Limited endeavors to update on a reasonable basis the information discussed in this material, there may be
regulatory, compliance, or other reasons that prevent us from doing so.
This document is being supplied to you solely for your information, and its contents, information or data may not be reproduced,
redistributed or passed on, directly or indirectly.
Technical and Derivatives Team:
Sameet Chavan Chief Analyst - Technical & Derivatives sameet.chavan@angelbroking.com
Ruchit Jain Senior Analyst - Technical & Derivatives ruchit.jain@angelbroking.com
Rajesh Bhosale Technical Analyst rajesh.bhosle@angelbroking.com
Sneha Seth Derivatives Analyst sneha.seth@angelbroking.com
