www.angelbroking.com
Technical & Derivatives Report
July 24, 2020
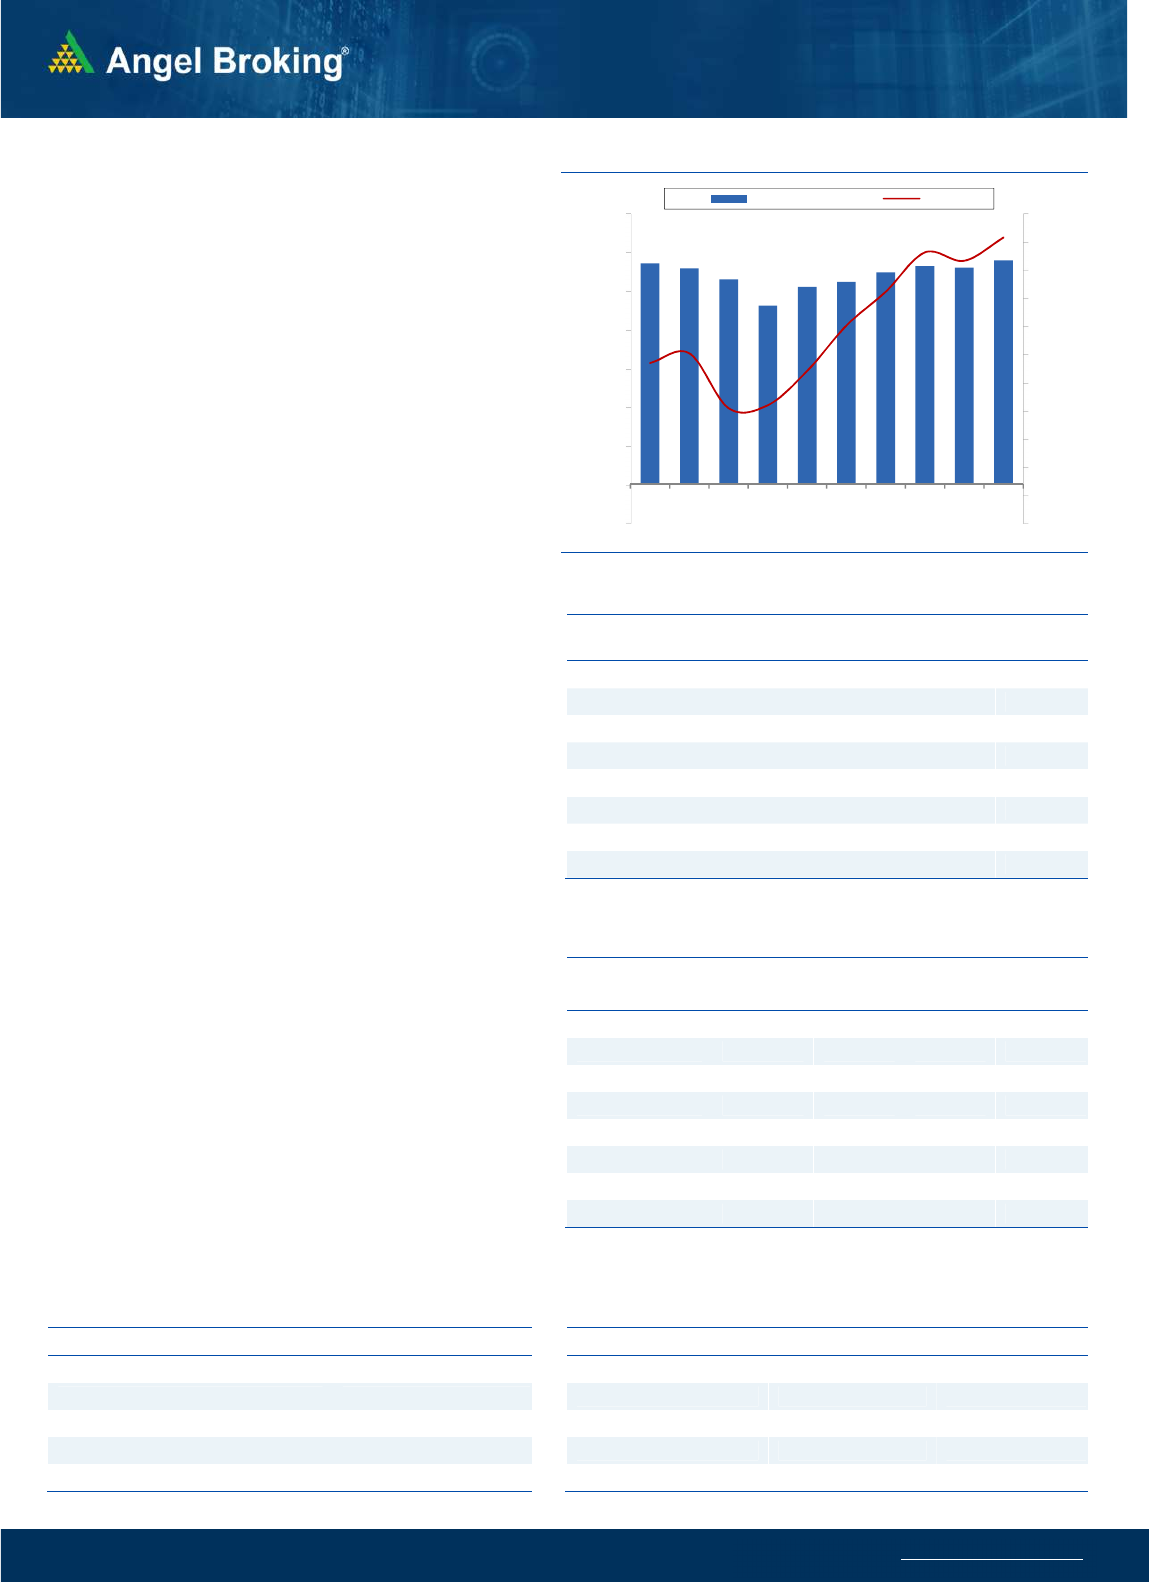
Nifty
Bank Out
look
-
(
23084
)
Bank Nifty as well started on a flat note and after an initial decline
witnessed positive momentum throughout the session to
eventually end with gains of 0.88% at 23084.
In our yesterday's outlook, we had mentioned a breakout level for
bank nifty at 23100 and it has now closed tad below the same.
The bank nifty has started showing outperformance in the last few
sessions and as mentioned above a further rally in the bank index
can open doors for a strong upmove in the broader markets. For
the coming session, 23220 will be the level to watch and sustained
trade above the same can push the bank index towards 23470 -
23600 levels. On the flip side, immediate support is placed around
22850 and 22730 levels. Traders are advised to focus on stocks
within this basket as they are likely to give outperforming
opportunities.
Key Levels
Support 1 – 22850 Resistance 1 – 23220
Support 2 – 22730 Resistance 2 – 23470
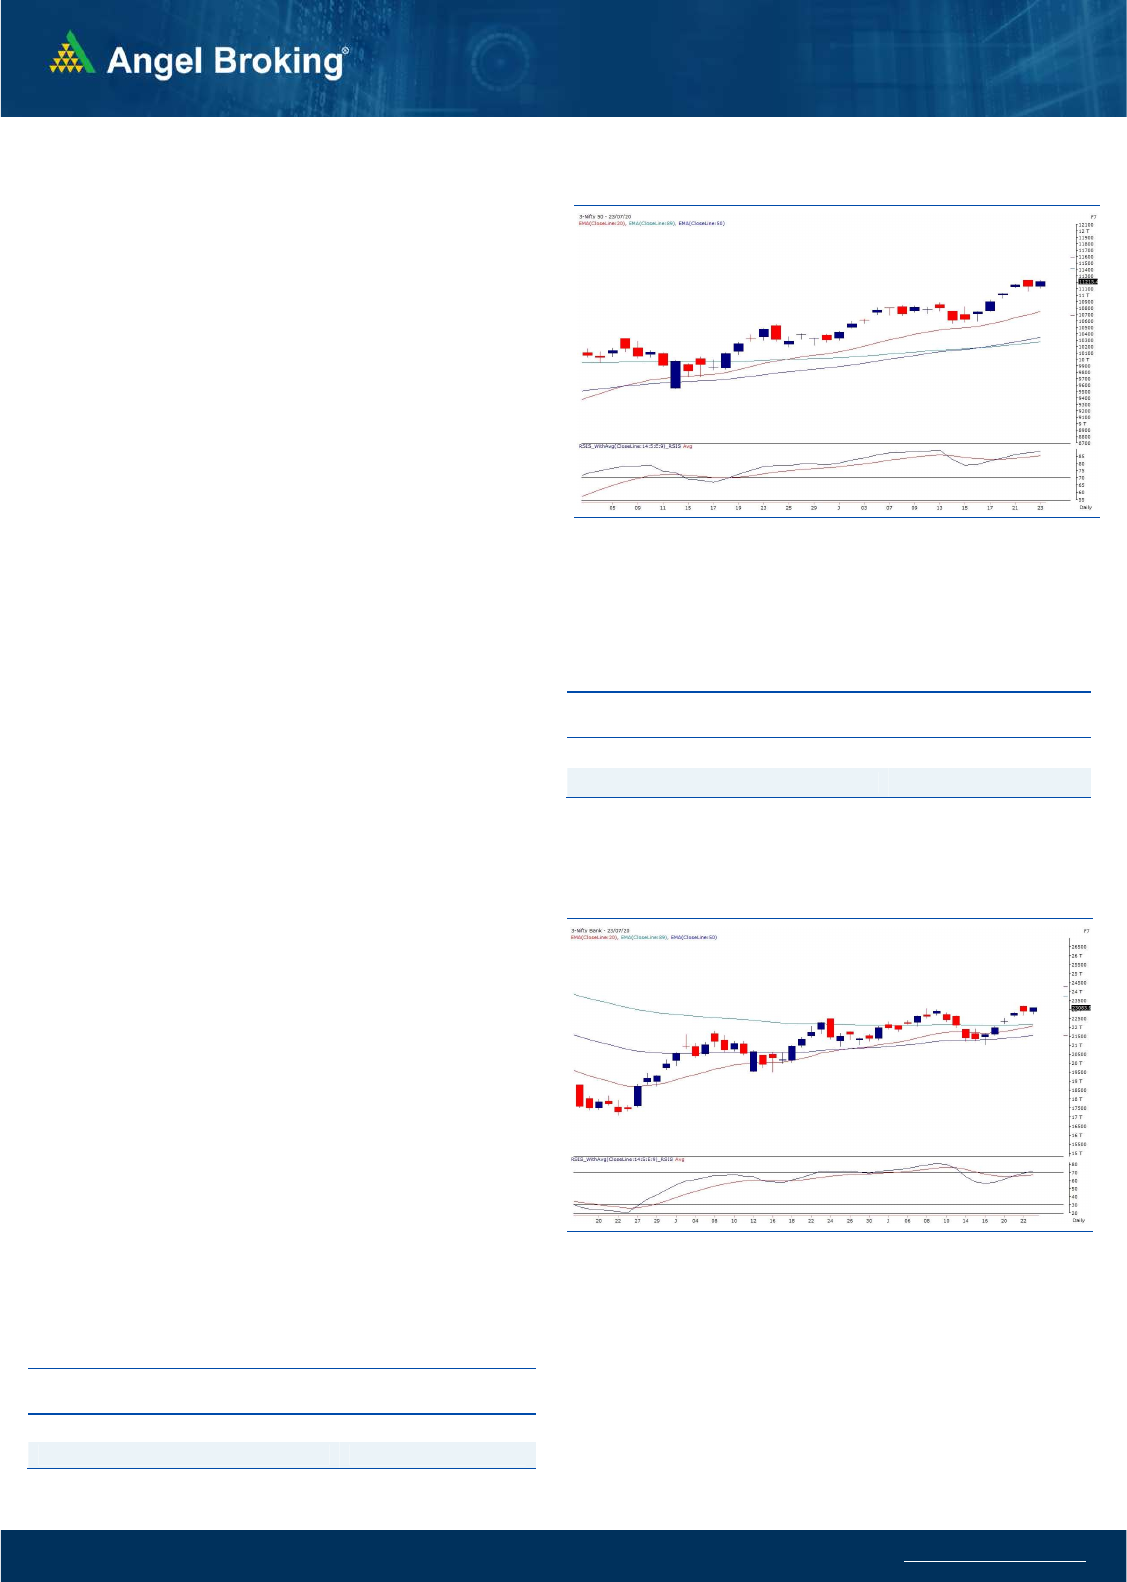
Exhibit 1: Nifty Daily Chart
Sensex (38140) / Nifty (11215)
Yesterday, our markets kick-started the day on a flat note in line with
muted global cues. In the initial trade, we witnessed a small decline
towards 11100, which got bought into. Since it was considered a
strong support for weekly expiry, the buying accelerated in the
following hours. In fact, during the remaining part of the day, we
witnessed higher highs higher lows to confirm a close beyond the
11200 mark.
Clearly, there has been no stopping for the recent Bull Run and one
after another, markets are convincingly surpassing all major hurdles.
As per the technical observations, Nifty at present is placed at the
78.6% retracement of the entire fall started after the outbreak of
coronavirus pandemic and hence, it is considered to be a
respectable resistance. Here, all eyes should be on banking space
now as it is likely to play a vital role for the overall direction for next
few days. The way Bank Nifty is shaped up, any further rally in it
would unfold a strong up move in the broader markets as well.
Hence more than Nifty, we would be keeping a close track on the
banking index now. As far as levels for Nifty is concerned, a
sustainable move beyond 11225 would result in an extension
towards 11300-11350 and on the flipside, 11150 followed by
11100 remains to be an immediate support zone.
Exhibit 2: Nifty Bank Daily Chart
Traders are advised to keep following stock centric moves and
ideally should keep booking timely profits wherever it's necessary.
The stop loss level in Nifty should move higher towards 11050,
which can be seen as a key support.
Key Levels
Support 1 – 11150 Resistance 1 – 11300
Support 2 – 11100 Resistance 2 – 11350
www.angelbroking.com
Technical & Derivatives Report
July 24, 2020
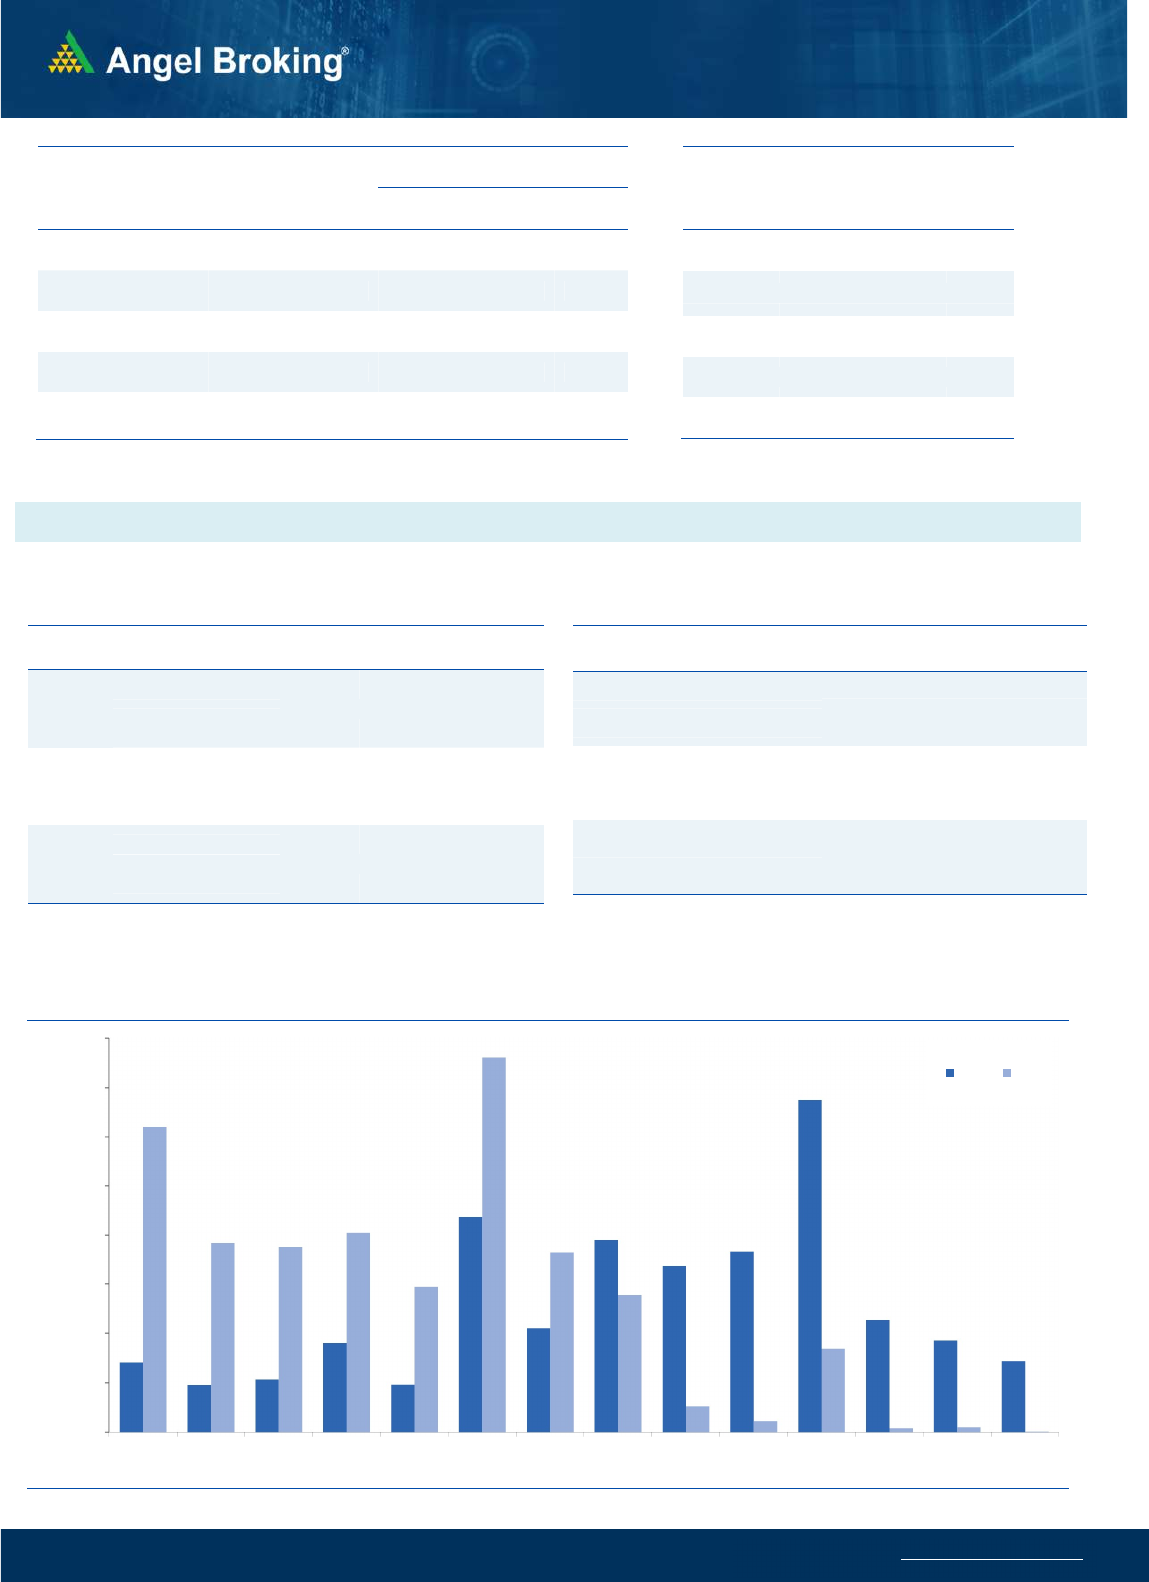
Nifty Vs OI
10200
10300
10400
10500
10600
10700
10800
10900
11000
11100
11200
11300
,0
2,000
4,000
6,000
8,000
10,000
12,000
14,000
16,000
7/10 7/13 7/14 7/15 7/16 7/17 7/20 7/21 7/22 7/23
(`000)
Openinterest Nifty
View
s
Yesterday, Nifty started on a flat note which was
followed by an immediate dip. This dip however got
bought into and Nifty continued with its recent
northward journey to eventually end with gains of
0.74% at 11215.45.
FIIs were net buyers in the cash market segment to the
tune of Rs. 1740.50 crores. In index futures, they bought
worth 220 crores with increase in open interest
indicating long formations in yesterday’s session
.
On the weekly expiry session, Nifty witnessed buying
interest from the support of 11100 and ended above
the 11200 mark. Some long formation was seen in Nifty
along with price upmove whereas there was no relevant
change in open interest in Bank Nifty. FII's continued
their buying streak in the cash segment. The monthly
options data indicates a broad range of 11000-11500
for the coming week. The Nifty PCR-OI is at 1.86 which
is considered as overbought level. Traders are advised
to trade with a stocks specific approach for the day.
C
o
mme
n
t
s
The Nifty futures open interest has increased by 2.85%
Bank Nifty futures open interest has increased by 0.05%
as market closed at 11215.45 levels.
The Nifty July future closed with a discount of 7.9 point
against a discount of 22.05 point in last trading session.
The August series closed at a discount of 1 point.
The INDIA VIX has decreased from 24.88 to 24.64
At the same time, the PCR-OI of Nifty increased from 1.68
to 1.86.
Few of the liquid counters where we have seen high cost
of carry are ESCORTS, JINDALSTEL, L&TFH, ASHOKLEY
AND MFSL.
OI Gainers
SCRIP OI
OI
CHG. (%)
PRICE
PRICE
CHG. (%)
APOLLOHOSP 1105500 22.09 1531.30 3.38
BALKRISIND 2612000 15.21 1273.35 1.23
CENTURYTEX 2958200 13.66 307.45 0.13
JUSTDIAL 1576400 13.39 377.80 2.43
HAVELLS 6346000 8.96 605.65 3.88
MRF 19080 7.80 63357.45 -1.45
SHREECEM 169150 7.74 21567.50 -1.89
CANBK 13070000 7.66 102.25 0.20
OI Losers
SCRIP OI
OI
CHG. (%)
PRICE
PRICE
CHG. (%)
IDFCFIRSTB 132183000 -9.26 27.30 1.48
RELIANCE 36641790 -8.53 2057.95 2.74
M&MFIN 23088576 -8.48 148.60 -3.10
IGL 10194250 -7.54 414.15 1.68
TITAN 6805500 -7.29 1070.20 0.88
GMRINFRA 136035000 -5.53 21.65 3.84
MUTHOOTFIN 3379500 -3.82 1305.85 -0.39
JINDALSTEL 17220000 -3.56 171.75 -0.69
Put-Call Ratio
SCRIP PCR-OI PCR-VOL
NIFTY 1.86 1.08
BANKNIFTY 1.23 0.74
RELIANCE 0.97 0.48
ICICIBANK 0.62 0.40
INFY 1.12 0.79
Historical Volatility
SCRIP HV
DIVISLAB 40.38
EICHERMOT 56.07
HAVELLS 46.08
BEL 60.84
GMRINFRA 52.67
www.angelbroking.com
Technical & Derivatives Report
July 24, 2020
Note: Above mentioned Bullish or Bearish Spreads in Nifty (July Series) are given as an information and not as a recommendation.
Nifty Spot =
11215.45
FII Statistics for July 23, 2020
Detail Buy Sell Net
Open Interest
Contracts
Value
(in Cr.)
Change
(%)
INDEX
FUTURES
3740.84
3520.47
220.37
143708
10840.78
8.02
INDEX
OPTIONS
332386.00
330647.94
1738.06
704950
55499.47
(18.67)
STOCK
FUTURES
14525.38
15806.00
(1280.62) 1311437
91154.46
(0.52)
STOCK
OPTIONS
5559.76
5373.91
185.85
93321
6527.53
(9.91)
Total 356211.98
355348.32
863.66
2253416
164022.24
(6.95)
Turnover on July 23, 2020
Instrument
No. of
Contracts
Turnover
( in Cr. )
Change
(%)
Index Futures
3,89,374 26308.51 -19.47
Index Options
5,69,95,273
32,81,494.60
84.96
Stock Futures
8,82,817 61960.25 -14.74
Stock Options
13,47,520
1,01,872.49
-14.56
Total 5,96,14,984
34,71,635.85
73.69
Bull-Call Spreads
Action Strike Price Risk Reward BEP
Buy 11200 125.60
47.35 52.65 11247.35
Sell 11300 78.25
Buy 11200 125.60
80.35 119.65 11280.35
Sell 11400 45.25
Buy 11300 78.25
33.00 67.00 11333.00
Sell 11400 45.25
Bear-Put Spreads
Action Strike Price Risk Reward BEP
Buy 11200 119.45
39.65 60.35 11160.35
Sell 11100 79.80
Buy 11200 119.45
66.80 133.20 11133.20
Sell 11000 52.65
Buy 11100 79.80
27.15 72.85 11072.85
Sell 11000 52.65
Nifty Put-Call Analysis
,0
500,000
1000,000
1500,000
2000,000
2500,000
3000,000
3500,000
4000,000
10500 10600 10700 10800 10900 11000 11100 11200 11300 11400 11500 11600 11700 11800
Call Put

www.angelbroking.com
Technical & Derivatives Report
July 24, 2020
Daily Pivot Levels for Nifty Constituents
Scrips
S2
S1
PIVOT
R1
R2
ADANIPORTS
309
312
314
316
318
ASIANPAINT 1,665 1,697
1,718
1,750
1,771
AXISBANK
449
455
465
471
480
BAJAJ-AUTO 2,897 2,965
3,007
3,075
3,118
BAJFINANCE 3,174 3,236
3,278
3,340
3,382
BAJAJFINSV 6,241 6,311
6,383
6,453
6,525
BPCL
425
441
459
476
494
BHARTIARTL
557
562
569
574
581
INFRATEL
197
199
200
202
204
BRITANNIA 3,783 3,805
3,842
3,865
3,902
CIPLA
657
664
669
676
681
COALINDIA
132
133
134
135
136
DRREDDY 4,033 4,081
4,111
4,159
4,189
EICHERMOT 19,277
20,080
20,563
21,365
21,848
GAIL
100
101
103
104
106
GRASIM
588
593
602
608
617
HCLTECH
638
645
651
659
665
HDFCBANK 1,103 1,116
1,130
1,144
1,158
HDFC 1,847 1,862
1,886
1,900
1,924
HEROMOTOCO
2,722
2,747
2,770
2,794
2,817
HINDALCO
159
160
161
163
164
HINDUNILVR 2,166 2,189
2,228
2,250
2,290
ICICIBANK
372
382
389
399
406
IOC
89
92
94
96
98
INDUSINDBK
504
509
515
520
526
INFY
893
900
908
916
923
ITC
195
198
200
203
204
JSW STEEL
203
206
208
211
213
KOTAKBANK 1,319 1,346
1,363
1,391
1,408
LT
895
906
922
933
949
M&M
574
589
599
613
623
MARUTI 5,919 5,993
6,041
6,115
6,163
NESTLEIND 16,953
17,105
17,202
17,354
17,451
NTPC
89
90
91
91
92
ONGC
81
82
83
84
85
POWERGRID
175
179
181
184
186
RELIANCE 1,955 2,006
2,043
2,095
2,131
SHREECEM 21,104
21,336
21,733
21,965
22,361
SBIN
188
193
196
201
204
SUNPHARMA
470
473
477
481
485
TCS 2,147 2,159
2,175
2,187
2,203
TATAMOTORS
104
105
106
107
107
TATASTEEL
343
348
352
356
361
TECHM
597
615
625
642
652
TITAN 1,036 1,053
1,068
1,085
1,100
ULTRACEMCO 3,787 3,813
3,851
3,877
3,915
UPL
448
455
467
474
486
VEDANTA
110
112
114
115
117
WIPRO
260
263
266
269
272
ZEEL
151
155
161
165
172

www.angelbroking.com
Technical & Derivatives Report
July 24, 2020
*
Research Team Tel: 022 – 39357600 (Extn. 6844) Website: www.angelbroking.com
For Technical & Derivatives Queries E-mail: technicalrese[email protected]
DISCLAIMER
Angel Broking Limited (hereinafter referred to as “Angel”) is a registered Member of National Stock Exchange of India Limited, Bombay
Stock Exchange Limited and Metropolitan Stock Exchange Limited. It is also registered as a Depository Participant with CDSL and
Portfolio Manager and Investment Adviser with SEBI. It also has registration with AMFI as a Mutual Fund Distributor. Angel Broking
Limited is a registered entity with SEBI for Research Analyst in terms of SEBI (Research Analyst) Regulations, 2014 vide registration
number INH000000164. Angel or its associates has not been debarred/ suspended by SEBI or any other regulatory authority for
accessing /dealing in securities Market. Angel or its associates/analyst has not received any compensation / managed or co-managed
public offering of securities of the company covered by Analyst during the past twelve months.
This document is solely for the personal information of the recipient, and must not be singularly used as the basis of any investment
decision. Nothing in this document should be construed as investment or financial advice. Each recipient of this document should make
such investigations as they deem necessary to arrive at an independent evaluation of an investment in the securities of the companies
referred to in this document (including the merits and risks involved), and should consult their own advisors to determine the merits
and risks of such an investment.
Reports based on technical and derivative analysis center on studying charts of a stock's price movement, outstanding positions and
trading volume, as opposed to focusing on a company's fundamentals and, as such, may not match with a report on a company's
fundamentals. Investors are advised to refer the Fundamental and Technical Research Reports available on our website to evaluate the
contrary view, if any.
The information in this document has been printed on the basis of publicly available information, internal data and other reliable
sources believed to be true, but we do not represent that it is accurate or complete and it should not be relied on as such, as this
document is for general guidance only. Angel Broking Limited or any of its affiliates/ group companies shall not be in any way
responsible for any loss or damage that may arise to any person from any inadvertent error in the information contained in this report.
Angel Broking Limited has not independently verified all the information contained within this document. Accordingly, we cannot
testify, nor make any representation or warranty, express or implied, to the accuracy, contents or data contained within this document.
While Angel Broking Limited endeavors to update on a reasonable basis the information discussed in this material, there may be
regulatory, compliance, or other reasons that prevent us from doing so.
This document is being supplied to you solely for your information, and its contents, information or data may not be reproduced,
redistributed or passed on, directly or indirectly.
Technical and Derivatives Team:
Sameet Chavan Chief Analyst - Technical & Derivatives sameet.chavan@angelbroking.com
Ruchit Jain Senior Analyst - Technical & Derivatives ruchit.jain@angelbroking.com
Rajesh Bhosale Technical Analyst rajesh.bhosle@angelbroking.com
Sneha Seth Derivatives Analyst sneha.seth@angelbroking.com
