www.angelbroking.com
Technical & Derivatives Report
June 24, 2020
Nifty
Bank Out
look
-
(
2
2265
)
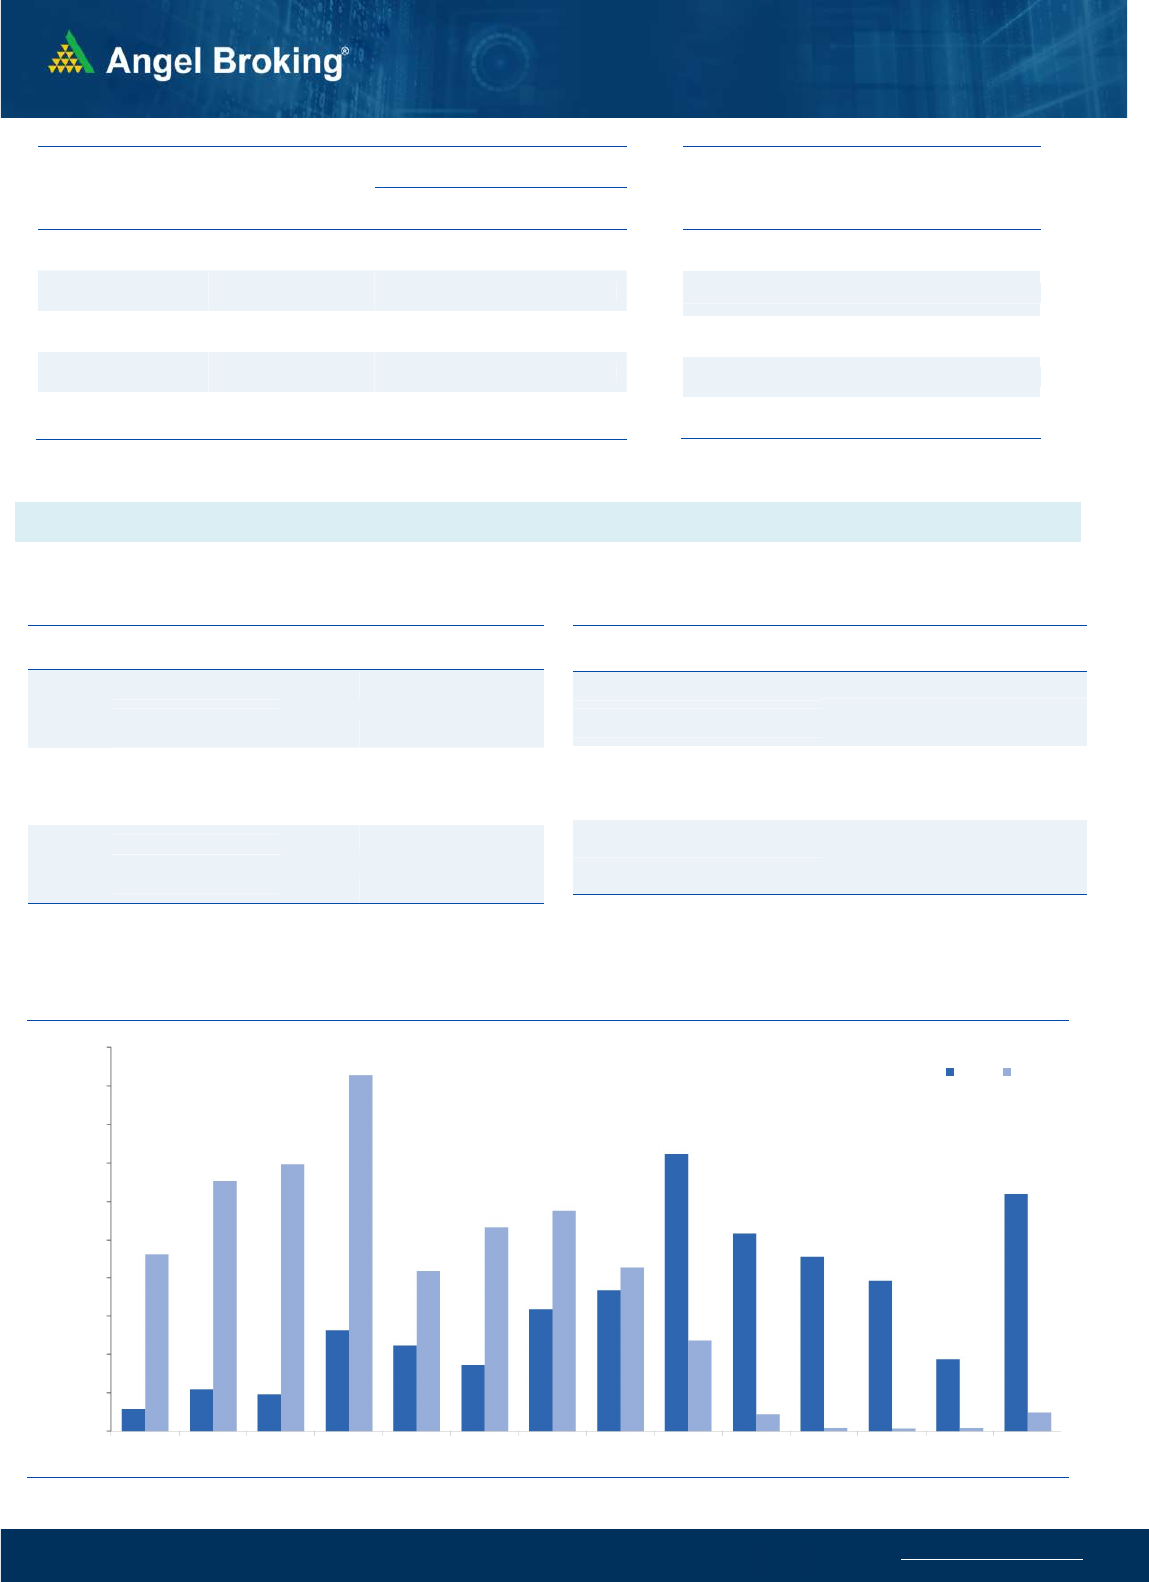
The banking index opened marginally in the green along with the
benchmark index. Without wasting any time, we witnessed
continuation of the northward trajectory, courtesy to some of the
heavyweight banking names. In fact the momentum kept on
accelerating as the day progressed to eventually conclude the day
with over couple of percent gains. The Bank Nifty finally managed
to surpass its recent high and thereby marking a higher close in
last three months. Also, it’s about to traverse it ‘89-day EMA’,
which would then reinforce the upward momentum. Hence the
coming session would be quite crucial for this high beta tradable
index. We continue to remain upbeat and advocate buying on
declines around 22000-21800. The strong support zone would
now be seen at 21600-21400 and on the flipside, 22500-22800
would be the levels to watch out for.
Key Levels
Support 1 – 22000 Resistance 1 – 22500
Support 2 – 21800 Resistance 2 – 22800
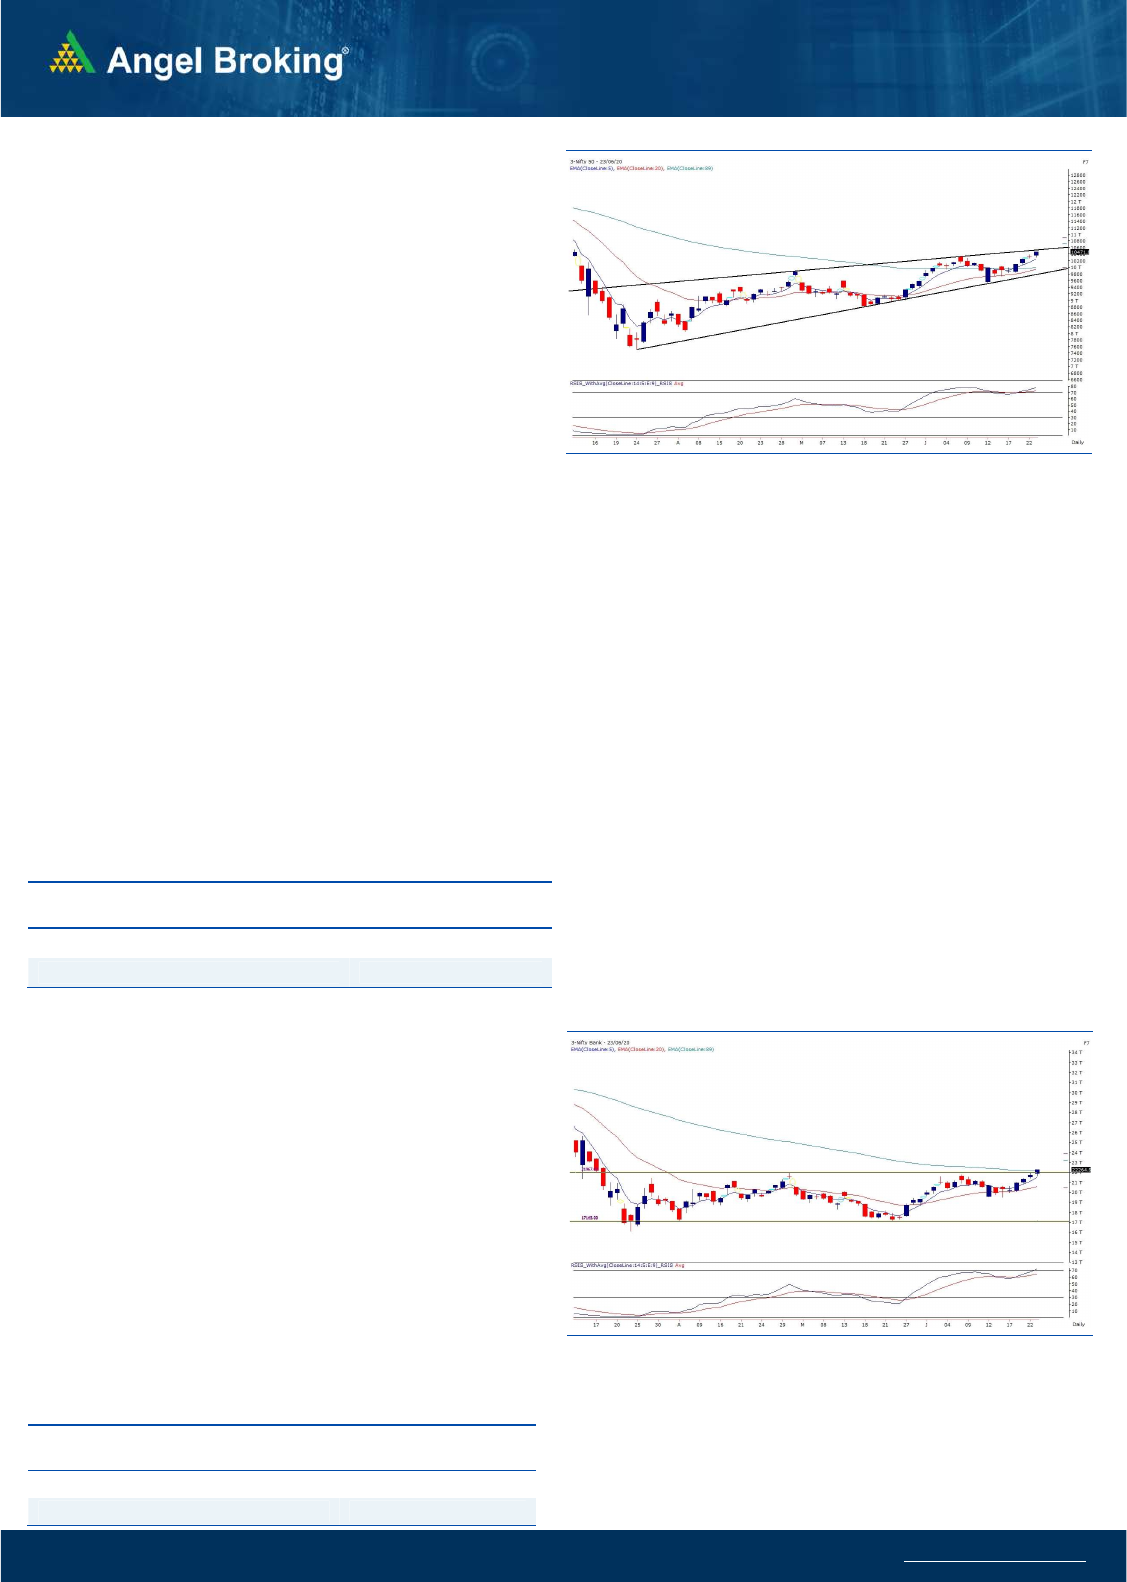
Exhibit 1: Nifty Daily Chart
Se
nsex
(
3
5430
)
/ Nifty
(
10
47
1
)
Nifty started trading marginally positive in yesterday’s session.
The initial dip around 10300 in first hour of the trade was bought
into and then we witnessed a gradual upmove throughout the
day. The momentum accelerated in the last hour of the trade with
support of index heavyweights and Nifty ended the day with gains
of over one and a half percent.
The index has been forming a ‘Higher Top Higher Bottom’
structure and the broader markets have done considerably well in
last few sessions. The upmove in index supported by a broader
market participation is certainly an encouraging sign and hence,
we have been optimistic on the market and have been advising to
use dips as buying opportunity. Last few day’s have been traders
delight as the midcap and small cap names (along with the
banking and NBFC space) have provided good trading
opportunities. As of now, there are no signs on reversal and hence,
one should keep focusing on stock picking from a momentum
perspective. Just one caveat that we would like to highlight is the
formation of a ‘Wolfe Wave’ structure on daily chart of Nifty and
resistance according to the pattern is seen around 10550-10600.
We would see how the index behaves around this juncture in next
couple of sessions. Until any reversal signs seen, traders are
advised to take a stock specific approach and trade with a positive
bias. The intraday supports for Nifty are placed around 10390 and
10300 whereas resistance is seen in the range of 10550-10600.
Key Levels
Support 1 – 10390 Resistance 1 – 10550
Support 2 – 10300 Resistance 2 – 10600
Exhibit 2: Nifty Bank Daily Chart

www.angelbroking.com
Technical & Derivatives Report
June 24, 2020
Nifty Vs OI
9400
9600
9800
10000
10200
10400
10600
10,000
10,500
11,000
11,500
12,000
12,500
13,000
6/9 6/10 6/11 6/12 6/15 6/16 6/17 6/18 6/19 6/22 6/23
(`000)
Openinterest Nifty
View
s
After opening on a mild positive note, Nifty continued
with its northward trajectory and ended with gains of
1.55% at 10471.
FIIs were net buyers in the cash market segment to the
tune of Rs. 169 crores. In index futures, they sold
worth 115 crores with a increase in open interest by 5
percent, indicating formation of some short positions
.
The indices continued its upmove and rallied towards
the 10500 mark. Nifty futures witnessed addition of
fresh longs as price upmove was supported with rise in
open interest. In options front, 10500 call option has
decent open interest outstanding indicating
resistance. It would be crucial to see how the call
writers position themselves ahead of the expiry. On
the flipside, 10300 will be seen as the immediate
support. It is advisable to continue to trade with a
positive bias and use intraday dips as buying
opportunity
.
C
o
mme
n
t
s
The Nifty futures open interest has increased by 7.98%
Bank Nifty futures open interest has decreased by 3.13%
as market closed at 10471 levels.
The Nifty June future closed with a discount of 3.3 point
against a discount of 23 point in last trading session. The
July series closed at a discount of 19.55 point.
The INDIA VIX has decreased from 30.46 to 29.34
At the same time, the PCR-OI of Nifty increased from 1.53
to 1.63.
Few of the liquid counters where we have seen high cost
of carry are IDEA, JINDALSTEL, GMRINFRA, SAIL and
BANDHANBNK.
OI Gainers
SCRIP OI
OI
CHG. (%)
PRICE
PRICE
CHG. (%)
JUSTDIAL 2825200 47.95 389.75 8.28
RAMCOCEM 1374950 24.54 645.70 2.26
VOLTAS 4770000 18.66 547.45 -0.57
BAJFINANCE 8259250 13.16 3025.65 6.37
PETRONET 13116000 11.50 259.65 -1.25
ONGC 69467000 11.16 85.65 1.25
SAIL 46786800 10.79 32.50 3.82
COLPAL 2168600 9.90 1407.95 2.16
OI Losers
SCRIP OI
OI
CHG. (%)
PRICE
PRICE
CHG. (%)
ESCORTS 2043800 -24.62 970.65 -1.10
CENTURYTEX 3711600 -17.00 316.50 -2.51
CANBK 12011400 -14.51 113.75 1.88
NCC 22464000 -13.54 32.05 3.06
IDEA 308042000 -13.16 10.25 1.97
INFRATEL 11535200 -12.34 232.35 3.97
BALKRISIND 1424000 -11.00 1243.70 -0.30
IDFCFIRSTB 116550000 -10.53 28.40 0.35
Put-Call Ratio
SCRIP PCR-OI PCR-VOL
NIFTY 1.63 0.94
BANKNIFTY 1.26 0.75
RELIANCE 0.81 0.62
ICICIBANK 0.75 0.47
INFY 0.81 0.76
Historical Volatility
SCRIP HV
LT 48.59
NTPC 39.22
POWERGRID 38.99
BANDHANBNK 99.32
NAUKRI 60.07
www.angelbroking.com
Technical & Derivatives Report
June 24, 2020
Note: Above mentioned Bullish or Bearish Spreads in Nifty (June Series) are given as an information and not as a recommendation.
Nifty Spot =
10471
FII Statistics for June 23, 2020
Detail Buy Sell Net
Open Interest
Contracts
Value
(in Cr.)
Change
(%)
INDEX
FUTURES
6395.78
6510.48
(114.70) 138573
9608.50
5.44
INDEX
OPTIONS
219220.19
219539.91
(319.72) 868220
61817.16
1.48
STOCK
FUTURES
43940.84
43824.37
116.47
1472548
90694.18
(5.18)
STOCK
OPTIONS
4823.36
4622.08
201.28
87077
4938.81
(10.20)
Total 274380.17
274496.84
(116.67) 2566418
167058.65
(2.67)
Turnover on June 23, 2020
Instrument
No. of
Contracts
Turnover
( in Cr. )
Change
(%)
Index Futures 6,71,057 38498.04 0.09
Index Options 1,92,87,844
11,32,645.14
10.83
Stock Futures 20,56,417 1,21,347.95 16.29
Stock Options 14,95,905 90211.10 -11.52
Total 2,35,11,223
13,82,702.23
9.15
Bull-Call Spreads
Action Strike Price Risk Reward BEP
Buy 10500 64.75
35.30 64.70 10535.30
Sell 10600 29.45
Buy 10500 64.75
52.55 147.45 10552.55
Sell 10700 12.20
Buy 10600 29.45
17.25 82.75 10617.25
Sell 10700 12.20
Bear-Put Spreads
Action Strike Price Risk Reward BEP
Buy 10500 97.65
44.55 55.45 10455.45
Sell 10400 53.10
Buy 10500 97.65
68.70 131.30 10431.30
Sell 10300 28.95
Buy 10400 53.10
24.15 75.85 10375.85
Sell 10300 28.95
Nifty Put-Call Analysis
,0
500,000
1000,000
1500,000
2000,000
2500,000
3000,000
3500,000
4000,000
4500,000
5000,000
9700 9800 9900 10000 10100 10200 10300 10400 10500 10600 10700 10800 10900 11000
Call Put

www.angelbroking.com
Technical & Derivatives Report
June 24, 2020
Daily Pivot Levels for Nifty Constituents
Scrips
S2
S1
PIVOT
R1
R2
ADANIPORTS
343
349
353
360
364
ASIANPAINT 1,623 1,654
1,671
1,702
1,719
AXISBANK
425
434
440
449
454
BAJAJ-AUTO 2,807 2,835
2,872
2,900
2,938
BAJFINANCE 2,713 2,869
2,989
3,146
3,266
BAJAJFINSV 5,973 6,
146
6,264
6,438
6,555
BPCL
378
385
389
396
400
BHARTIARTL
569
574
579
584
590
INFRATEL
221
227
230
236
239
BRITANNIA 3,387 3,427
3,466
3,506
3,545
CIPLA
644
652
663
671
682
COALINDIA
141
142
145
146
148
DRREDDY 4,003 4,056
4,093
4,146
4,183
EICHERMOT 17,444
17,667
17,834
18,057
18,224
GAIL
97
98
99
100
102
GRASIM
602
612
623
633
645
HCLTECH
556
568
576
588
596
HDFCBANK 1,006 1,024
1,035
1,053
1,063
HDFC 1,787 1,812
1,829
1,854
1,871
HEROMOTOCO
2,384
2,40
1
2,423
2,441
2,462
HINDALCO
147
153
156
162
165
HINDUNILVR 2,073 2,114
2,143
2,185
2,214
ICICIBANK
359
367
373
382
387
IOC
87
88
89
91
92
INDUSINDBK
487
504
514
531
541
INFY
680
700
712
733
745
ITC
183
185
186
187
189
JSW STEEL
195
199
201
204
207
KOTAKBANK 1,333 1,361
1,379
1,407
1,424
LT
888
928
949
989
1,010
M&M
489
503
511
525
534
MARUTI 5,774 5,830
5,919
5,975
6,063
NESTLEIND 15,983
16,266
16,493
16,776
17,003
NTPC
93
97
99
103
105
ONGC
83
85
86
87
88
POWERGRID
175
181
185
191
195
RELIANCE 1,686 1,703
1,734
1,751
1,781
SHREECEM 21,690
22,223
22,583
23,116
23,476
SBIN
186
189
191
194
196
SUNPHARMA
484
492
498
506
511
TCS 1,996 2,016
2,030
2,050
2,064
TATAMOTORS
100
102
10
4
106
108
TATASTEEL
323
328
331
335
338
TECHM
539
549
554
564
570
TITAN
970
985
996
1,011
1,023
ULTRACEMCO 3,790 3,866
3,910
3,987
4,031
UPL
445
454
462
471
478
VEDANTA
107
109
110
112
113
WIPRO
209
215
219
224
228
ZEEL
171
17
6
182
187
192

www.angelbroking.com
Technical & Derivatives Report
June 24, 2020
*
Research Team Tel: 022 – 39357600 (Extn. 6844) Website: www.angelbroking.com
For Technical & Derivatives Queries E-mail: technicalresearc[email protected]
DISCLAIMER
Angel Broking Limited (hereinafter referred to as “Angel”) is a registered Member of National Stock Exchange of India Limited, Bombay
Stock Exchange Limited and Metropolitan Stock Exchange Limited. It is also registered as a Depository Participant with CDSL and
Portfolio Manager and Investment Adviser with SEBI. It also has registration with AMFI as a Mutual Fund Distributor. Angel Broking
Limited is a registered entity with SEBI for Research Analyst in terms of SEBI (Research Analyst) Regulations, 2014 vide registration
number INH000000164. Angel or its associates has not been debarred/ suspended by SEBI or any other regulatory authority for
accessing /dealing in securities Market. Angel or its associates/analyst has not received any compensation / managed or co-managed
public offering of securities of the company covered by Analyst during the past twelve months.
This document is solely for the personal information of the recipient, and must not be singularly used as the basis of any investment
decision. Nothing in this document should be construed as investment or financial advice. Each recipient of this document should make
such investigations as they deem necessary to arrive at an independent evaluation of an investment in the securities of the companies
referred to in this document (including the merits and risks involved), and should consult their own advisors to determine the merits
and risks of such an investment.
Reports based on technical and derivative analysis center on studying charts of a stock's price movement, outstanding positions and
trading volume, as opposed to focusing on a company's fundamentals and, as such, may not match with a report on a company's
fundamentals. Investors are advised to refer the Fundamental and Technical Research Reports available on our website to evaluate the
contrary view, if any.
The information in this document has been printed on the basis of publicly available information, internal data and other reliable
sources believed to be true, but we do not represent that it is accurate or complete and it should not be relied on as such, as this
document is for general guidance only. Angel Broking Limited or any of its affiliates/ group companies shall not be in any way
responsible for any loss or damage that may arise to any person from any inadvertent error in the information contained in this report.
Angel Broking Limited has not independently verified all the information contained within this document. Accordingly, we cannot
testify, nor make any representation or warranty, express or implied, to the accuracy, contents or data contained within this document.
While Angel Broking Limited endeavors to update on a reasonable basis the information discussed in this material, there may be
regulatory, compliance, or other reasons that prevent us from doing so.
This document is being supplied to you solely for your information, and its contents, information or data may not be reproduced,
redistributed or passed on, directly or indirectly.
Technical and Derivatives Team:
Sameet Chavan Chief Analyst - Technical & Derivatives sameet.chavan@angelbroking.com
Ruchit Jain Senior Analyst - Technical & Derivatives ruchit.jain@angelbroking.com
Rajesh Bhosale Technical Analyst rajesh.bhosle@angelbroking.com
Sneha Seth Derivatives Analyst sneha.seth@angelbroking.com
