www.angelbroking.com
Technical & Derivatives Report
Oc
tober 23, 2020
Nifty
Bank Out
look
-
(
24484
)
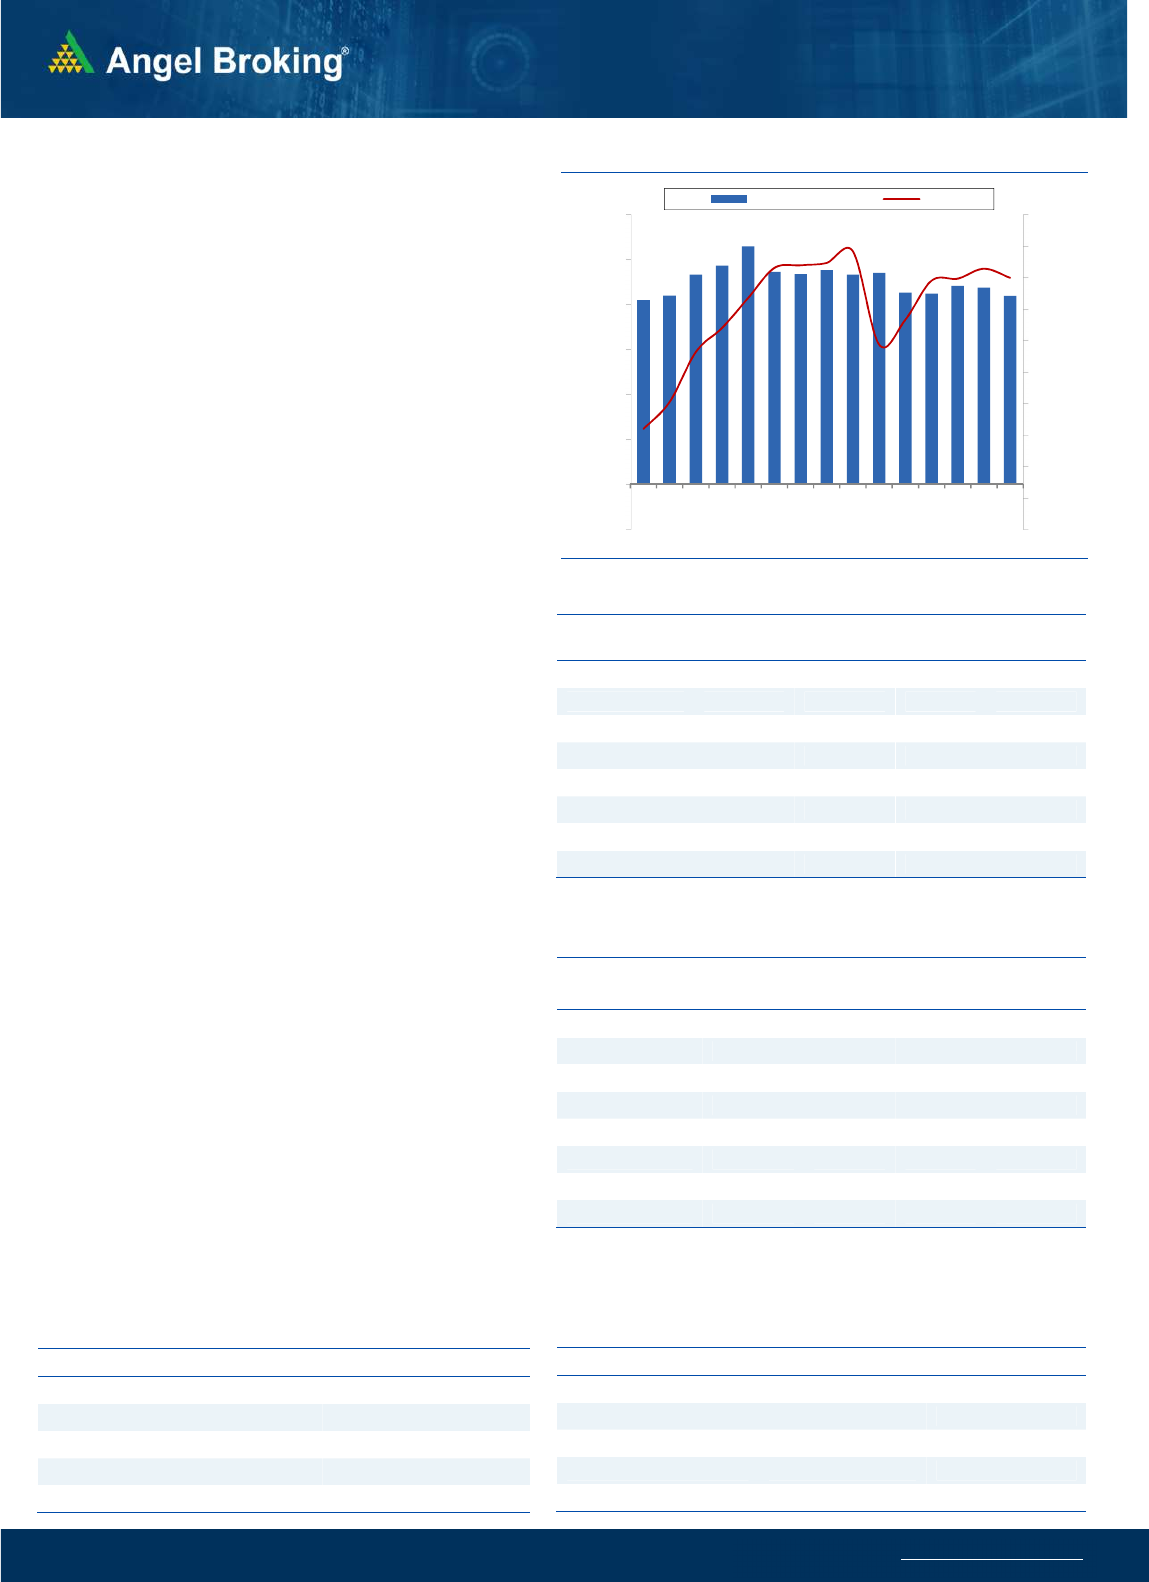
We had a sluggish start yesterday owing to global cues. In the
initial couple of hours, banking index recovered well and tried
giving some good move. But this feeble attempt got sold into
and for the major part of the day, we witnessed range bound
action with slightly negative bias. In fact,at the stroke of the
penultimate hour, markets had a sharp dip but it was more of an
expiry related move and hence, the weakness didn’t last long. At
the end, due to modest recovery, the BANKNIFTY ended with a
nominal half a percent cut.
Since last couple of days the volatility has risen a bit. Yesterday’s
behaviour was more of a choppy one rather than calling it as
volatile. We reiterate that till the time banking index holds
24200-24000, there is no reason to worry for. In fact, in between
dips are likely to be bought. On the higher side, 24750-25000
are the levels to watch out for. The major rally is likely to unfold
only after surpassing the sturdy wall of 25000-25200. Till then
the consolidation within 700-800 points is likely to continue with
a positive bias.
Key Levels
Support 1 – 24200 Resistance 1 – 24750
Support 2 – 24000 Resistance 2 – 25000
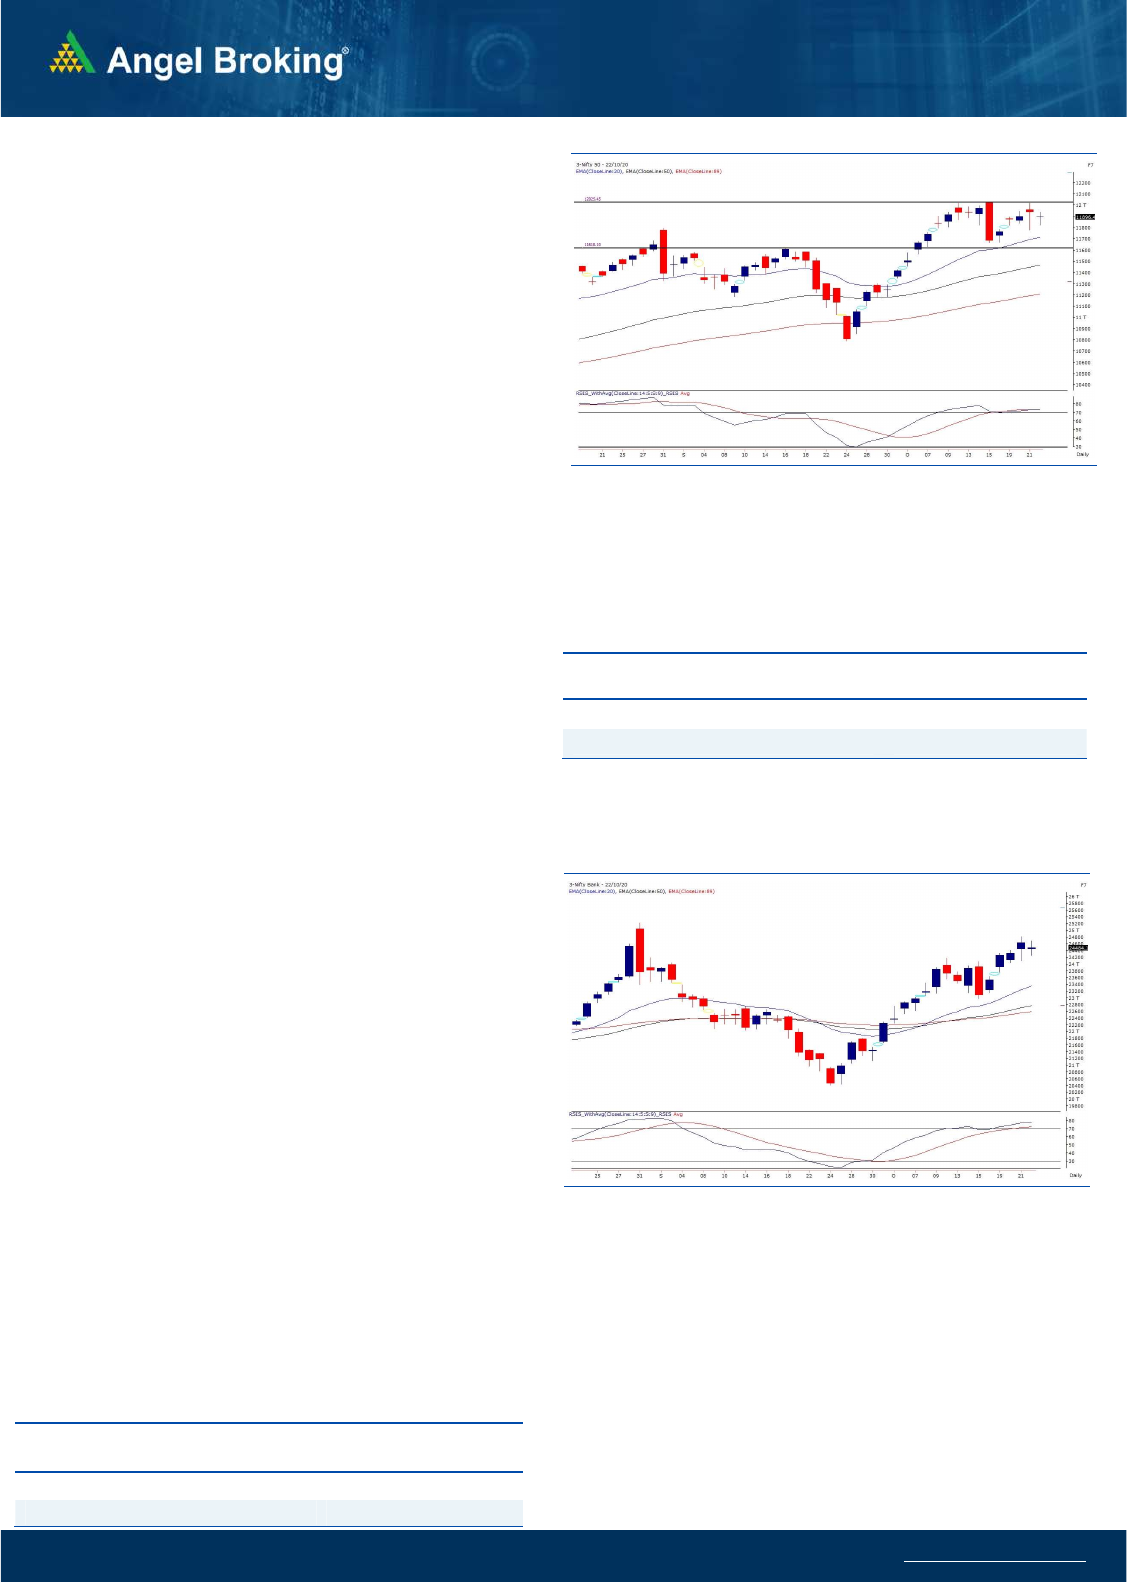
Exhibit 1: Nifty Daily Chart
Se
nsex
(
40558)
/ Nifty
(
11896
)
The global cues were marginally negative in morning and in line
with that, Nifty started the session below 11900. The index
oscillated within a narrow range throughout the session and ended
the weekly expiry day tad below 11900 mark.
Our markets had already seen high volatility a day prior to the
weekly expiry session. However, the expiry day turned out to be a
dull session for the index as the Nifty consolidated throughout the
day. But the midcap stocks witnessed some good momentum in
the last hour of the day and if we observe the chart of the Nifty
Midcap50 index, it seems to be poised for a breakout from the
recent consolidation phase. The breakout zone of the mentioned
index is placed at 4780-4800 and a move beyond that should then
lead to a trended upmove in the midcap space. On looking at the
charts, it seems to be a high probability of the index breaking in
upward direction, but traders are advised to wait for a confirmation
to place aggressive bets in the midcaps. As far as Nifty levels are
concerned, 12000-12025 continues to be immediate resistance
zone and the next leg of upmove would be seen only on a move
beyond the same. So traders are advised to keep a tab on the both
the indices as a breakout in both the indices simultaneously should
lead to a good upmove in the broader markets. On the flipside,
11775 has become a sacrosanct and if the index breaks that, then it
could result into profit booking in the market.
Exhibit 2: Nifty Bank Daily Chart
Since we are still in a consolidation phase, traders are advised to
keep a tab on the above mentioned levels and trade aggressively
only on a breakout from the above mentioned range. Till then, we
continue with our advise for traders to look for stock specific
opportunities.
.Key Levels
Support 1 – 11800 Resistance 1 – 12000
Support 2 – 11775 Resistance2 – 12025
www.angelbroking.com
Technical & Derivatives Report
October 23, 2020
Nifty Vs OI
11100
11200
11300
11400
11500
11600
11700
11800
11900
12000
12100
,0
2,000
4,000
6,000
8,000
10,000
12,000
14,000
10/1 10/6 10/8 10/12 10/14 10/16 10/20 10/22
(`000)
Openinterest Nifty
View
s
Post Wednesday’s roller coster move, Nifty traded in
the narrow range for the entire day and eventually
concluded the dull expiry day with a cut of 0.35%.
FIIs were net buyers in the cash segment to the tune of
Rs. 1118 crores. In index future segment, they sold
worth Rs. 319 crores with marginal change in open
interest, suggesting blend of long unwinding and short
formation in yesterday’s session.
Yesterday, we witnessed some profit booking in both
the indices. However, meaningful longs are still intact
in the system. In index options front, build-up was
scattered between 11900-12500 call and 11300-11900
put options. At present, 11800-12000 remains an
immediated trading range and any move beyond this
may bring back direction move. Hence, traders are
advised trading in individual counters for the time
being.
C
o
mme
n
t
s
The Nifty futures open interest has decreased by 1.36%
Bank Nifty futures open interest has decreased by 0.58%
as market closed at 11896.45 levels.
The Nifty October future closed with a premium of 2.20
point against a discount of 10.20 point in last trading
session. The November series closed at a premium of
26.90 point.
The INDIA VIX has decreased from 22.92 to 22.64.
At the same time, the PCR-OI of Nifty decreased from
1.42 to 1.34.
Few of the liquid counters where we have seen high
cost of carry are PNB, NATIONALUM, NTPC, IDEA and
COALINDIA.
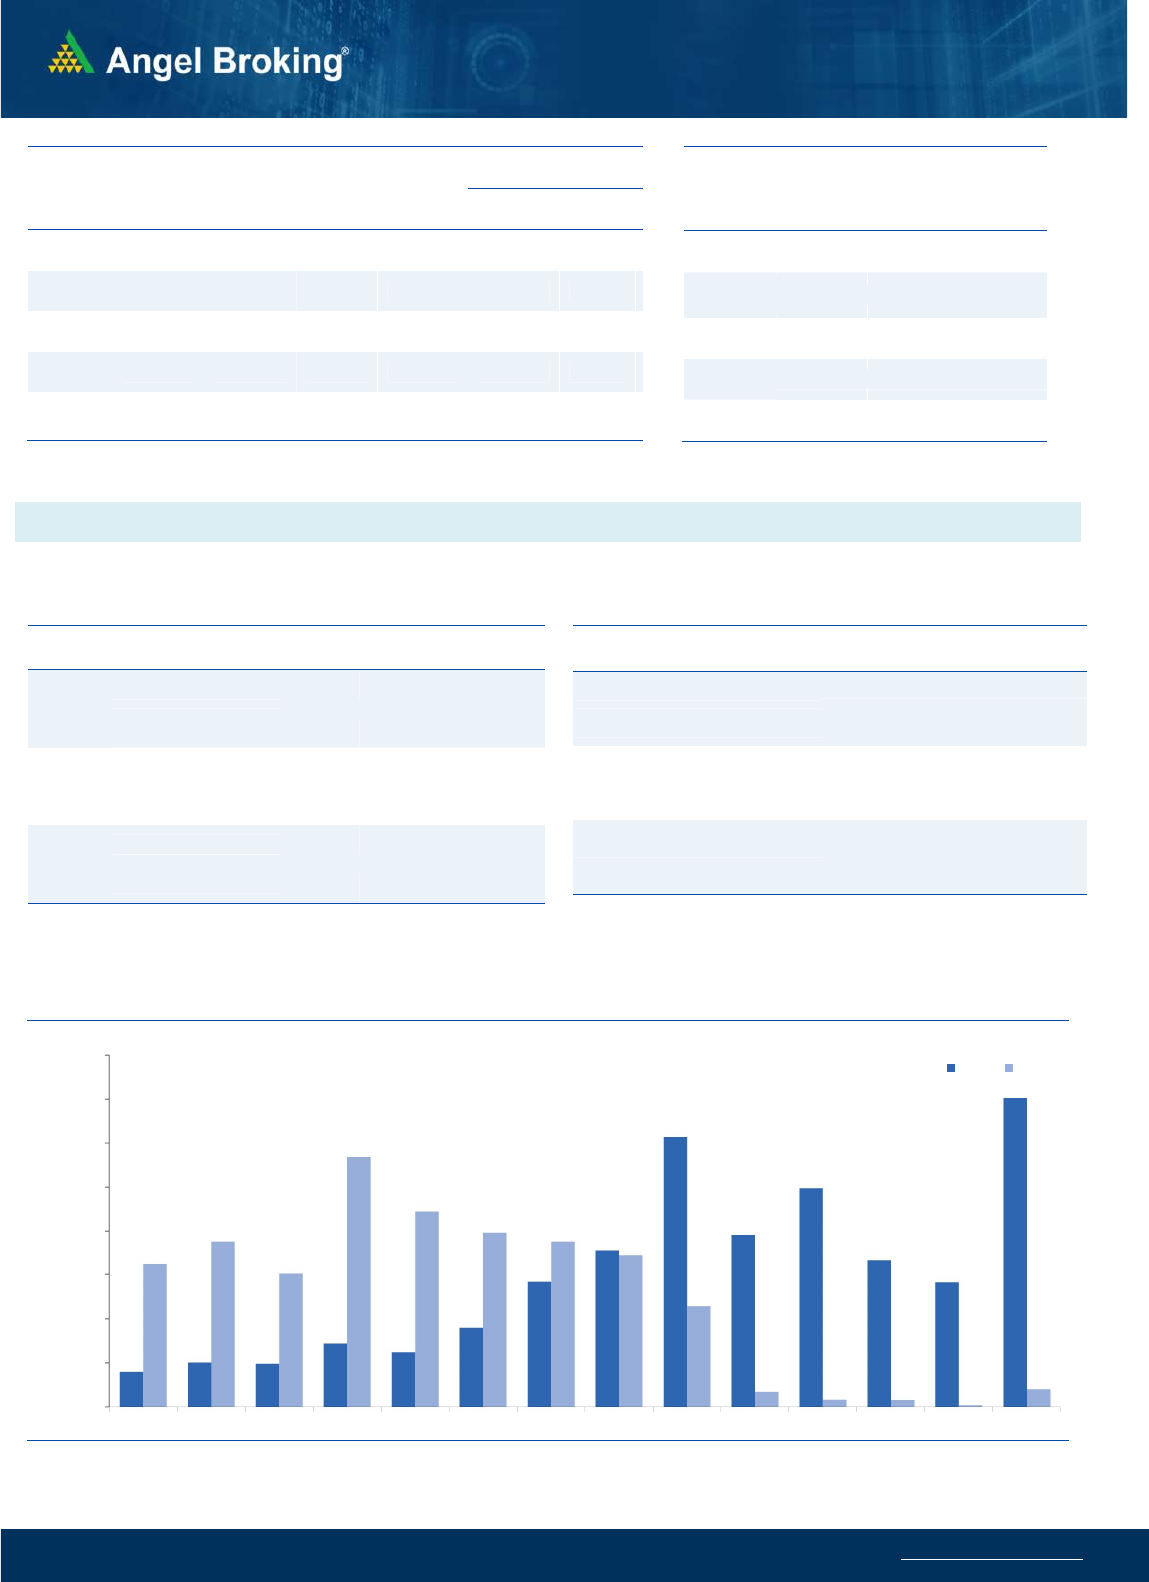
OI Gainers
SCRIP OI
OI
CHG. (%)
PRICE
PRICE
CHG. (%)
SAIL 58292000 22.52 36.05 1.12
POWERGRID 19288000 11.93 165.10 0.89
DABUR 12898750 10.25 507.15 -1.69
PVR 1700446 9.77 1178.30 -2.94
TATASTEEL 27504300 9.62 409.65 1.56
BAJAJFINSV 921625 9.16 5873.35 -0.32
MGL 1866000 8.97 828.60 0.90
CUMMINSIND 1990800 8.86 461.60 -0.84
OI Losers
SCRIP OI
OI
CHG. (%)
PRICE
PRICE
CHG. (%)
TORNTPOWER 2232000 -17.70 322.20 4.26
IGL 5676000 -6.20 391.25 2.79
ULTRACEMCO 2042600 -6.06 4614.50 -0.62
MRF 35210 -5.55 62250.65 1.90
COLPAL 3085600 -5.16 1431.95 0.53
KOTAKBANK 10855600 -5.13 1393.05 0.28
PETRONET 11586000 -4.64 235.60 4.87
IOC 55409700 -4.28 77.70 2.23
Put-Call Ratio
SCRIP PCR-OI PCR-VOL
NIFTY 1.34 0.98
BANKNIFTY 1.05 0.90
RELIANCE 0.41 0.53
ICICIBANK 0.72 0.63
INFY 0.39 0.48
Historical Volatility
SCRIP HV
TORNTPOWER 39.34
PETRONET 44.49
NTPC 39.47
JUBLFOOD 50.67
ASHOKLEY 72.87
www.angelbroking.com
Technical & Derivatives Report
October 23, 2020
Note: Above mentioned Bullish or Bearish Spreads in Nifty (October Series) are given as an information and not as a recommendation.
Nifty Spot =
11896.45
FII Statistics for October 22, 2020
Detail Buy
Net Contracts
Open Interest
Sell
Value
(in Cr.)
Change
INDEX
FUTURES
4349.08 4667.64 (318.56) 148074 12057.00 (0.03)
INDEX
OPTIONS
542966.31 543735.89 (769.58) 759176 63177.75 (21.37)
STOCK
FUTURES
15978.93 16008.90 (29.97) 1123992 81282.34 0.26
STOCK
OPTIONS
6648.76 6571.08 77.68
104965 8229.97 (0.08)
Total 569943.08
570983.51
(1040.43) 2136207
164747.06
(8.70)
Turnover on October 22, 2020
Instrument
No. of
Contracts
Turnover
( in Cr. )
Change
(%)
Index Futures
4,75,385 33675.58 -27.02
Index
Options
7,15,26,755
50,59,716.66 66.19
Stock Futures
8,74,194 66558.78 -6.12
Stock
Options
14,14,392 1,14,788.94 -18.36
Total 7,42,90,726
52,74,739.96 59.74
Bull-Call Spreads
Action Strike Price Risk Reward BEP
Buy 11900 117.15
46.20 53.80 11946.20
Sell 12000 70.95
Buy 11900 117.15
78.50 121.50 11978.50
Sell 12100 38.65
Buy 12000 70.95
32.30 67.70 12032.30
Sell 12100 38.65
Bear-Put Spreads
Action Strike Price Risk Reward BEP
Buy 11900 116.85
39.05 60.95 11860.95
Sell 11800 77.80
Buy 11900 116.85
65.50 134.50 11834.50
Sell 11700 51.35
Buy 11800 77.80
26.45 73.55 11773.55
Sell 11700 51.35
Nifty Put-Call Analysis
,0
500,000
1000,000
1500,000
2000,000
2500,000
3000,000
3500,000
4000,000
11200 11300 11400 11500 11600 11700 11800 11900 12000 12100 12200 12300 12400 12500
Call Put

www.angelbroking.com
Technical & Derivatives Report
October 23, 2020
Da
ily
Pivot Level
s for
Nifty Constituents
Scrips
S2
S1
PIVOT
R1
R2
ADANIPORTS
344
351
358
365
371
ASIANPAINT 2,058 2,079
2,098
2,119
2,138
AXISBANK
489
500
506
517
524
BAJAJ-AUTO 2,945 2,976
3,008
3,038
3,070
BAJFINANCE 3,075 3,195
3,270
3,390
3,465
BAJAJFINSV 5,699 5,786
5,933
6,020
6,167
BPCL
341
345
348
352
355
BHARTIARTL
413
422
427
436
441
BRITANNIA 3,371 3,414
3,454
3,498
3,537
CIPLA
731
744
757
770
783
COALINDIA
113
114
116
117
118
DIVISLAB 3,002 3,048
3,077
3,123
3,152
DRREDDY 4,752 4,887
4,966
5,101
5,180
EICHERMOT 2,121 2,140
2,159
2,179
2,198
GAIL
85
87
88
90
91
GRASIM
776
784
789
797
802
HCLTECH
839
853
865
879
892
HDFCBANK 1,208 1,221
1,235
1,248
1,262
HDFCLIFE
553
557
562
566
571
HDFC 2,003 2,023
2,043
2,063
2,083
HEROMOTOCO 2,992 3,037
3,107
3,151
3,221
HINDALCO
179
182
185
187
190
HINDUNILVR 2,139 2,159
2,173
2,193
2,207
ICICIBANK
401
407
413
419
425
IOC
74
76
77
79
80
INDUSINDBK
590
599
615
625
640
INFY 1,103 1,116 1,
137
1,150
1,171
ITC
166
167
168
169
170
JSW STEEL
316
321
324
329
332
KOTAKBANK 1,364 1,379
1,392
1,406
1,419
LT
913
925
932
943
951
M&M
589
597
602
610
615
MARUTI 6,731 6,771
6,816
6,856
6,900
NESTLEIND 15,606
15,758
15,920
16,071
16,233
NTPC
79
82
84
87
88
ONGC
67
68
68
70
70
POWERGRID
159
162
164
167
169
RELIANCE 2,069 2,088
2,110
2,129
2,152
SBILIFE
763
772
780
789
797
SHREECEM 20,673
20,832
21,061
21,221
21,449
SBIN
200
201
203
205
207
SUNPHARMA
477
481
486
491
496
TCS 2,617 2,644
2,665
2,693
2,714
TATAMOTORS
126
130
132
136
138
TATASTEEL
394
402
408
415
421
TECHM
815
826
840
851
865
TITAN 1,201 1,215
1,234
1,248
1,267
ULTRACEMCO 4,419 4,517
4,626
4,724
4,833
UPL
446
450
454
458
462
WIPRO
337
341
345
348
352

www.angelbroking.com
Technical & Derivatives Report
October 23, 2020
*
Research Team Tel: 022 – 39357600 (Extn. 6844) Website: www.angelbroking.com
For Technical Queries E-mail: technicalresearch-cso@angelbroking.com
For Derivatives Queries E-mail: derivatives.desk@angelbroking.com
DISCLAIMER
Angel Broking Limited (hereinafter referred to as “Angel”) is a registered Member of National Stock Exchange of India Limited,
Bombay Stock Exchange Limited and Metropolitan Stock Exchange Limited. It is also registered as a Depository Participant with CDSL
and Portfolio Manager and Investment Adviser with SEBI. It also has registration with AMFI as a Mutual Fund Distributor. Angel
Broking Limited is a registered entity with SEBI for Research Analyst in terms of SEBI (Research Analyst) Regulations, 2014 vide
registration number INH000000164. Angel or its associates has not been debarred/ suspended by SEBI or any other regulatory
authority for accessing /dealing in securities Market. Angel or its associates/analyst has not received any compensation / managed
or co-managed public offering of securities of the company covered by Analyst during the past twelve months.
This document is solely for the personal information of the recipient, and must not be singularly used as the basis of any investment
decision. Nothing in this document should be construed as investment or financial advice. Each recipient of this document should
make such investigations as they deem necessary to arrive at an independent evaluation of an investment in the securities of the
companies referred to in this document (including the merits and risks involved), and should consult their own advisors to determine
the merits and risks of such an investment.
Reports based on technical and derivative analysis center on studying charts of a stock's price movement, outstanding positions and
trading volume, as opposed to focusing on a company's fundamentals and, as such, may not match with a report on a company's
fundamentals. Investors are advised to refer the Fundamental and Technical Research Reports available on our website to evaluate
the contrary view, if any.
The information in this document has been printed on the basis of publicly available information, internal data and other reliable
sources believed to be true, but we do not represent that it is accurate or complete and it should not be relied on as such, as this
document is for general guidance only. Angel Broking Limited or any of its affiliates/ group companies shall not be in any way
responsible for any loss or damage that may arise to any person from any inadvertent error in the information contained in this
report. Angel Broking Limited has not independently verified all the information contained within this document. Accordingly, we
cannot testify, nor make any representation or warranty, express or implied, to the accuracy, contents or data contained within this
document. While Angel Broking Limited endeavors to update on a reasonable basis the information discussed in this material, there
may be regulatory, compliance, or other reasons that prevent us from doing so.
This document is being supplied to you solely for your information, and its contents, information or data may not be reproduced,
redistributed or passed on, directly or indirectly.
Technical and Derivatives Team:
Sameet Chavan Chief Analyst - Technical & Derivatives sameet.chavan@angelbroking.com
Ruchit Jain Senior Analyst - Technical & Derivatives ruchit.jain@angelbroking.com
Rajesh Bhosale Technical Analyst rajesh.bhosle@angelbroking.com
Sneha Seth Derivatives Analyst sneha.seth@angelbroking.com
