
www.angelbroking.com
Technical & Derivatives Report
July 21, 2020
Nifty Bank Outlook - (22322)
Due to Friday’s late surge in banking conglomerates, the stage was
all set for a bump up opening to start the new trading week. The
stellar Q1 numbers from the banking giant, HDFC Bank became
the catalyst for this head start. However, in the absence of follow
up buying, the banking index slipped into a consolidation mode
and remained range bound to conclude the session almost near
the opening point.
The Bank Nifty is now convincingly above it’s recent hurdle of
22000, which is a sign of strength. In our sense, any decline
towards 22150-22000 is likely to get bought into and the moment
it surpasses 22450-22500, we may see an extension towards
22800-23000 levels. Traders are advised to stay positive and try
to identify potential movers within this space, which are likely to
provide better trading opportunities.
Key Levels
Support 1 – 22150 Resistance 1 – 22500
Support 2 – 22000 Resistance 2 – 23000
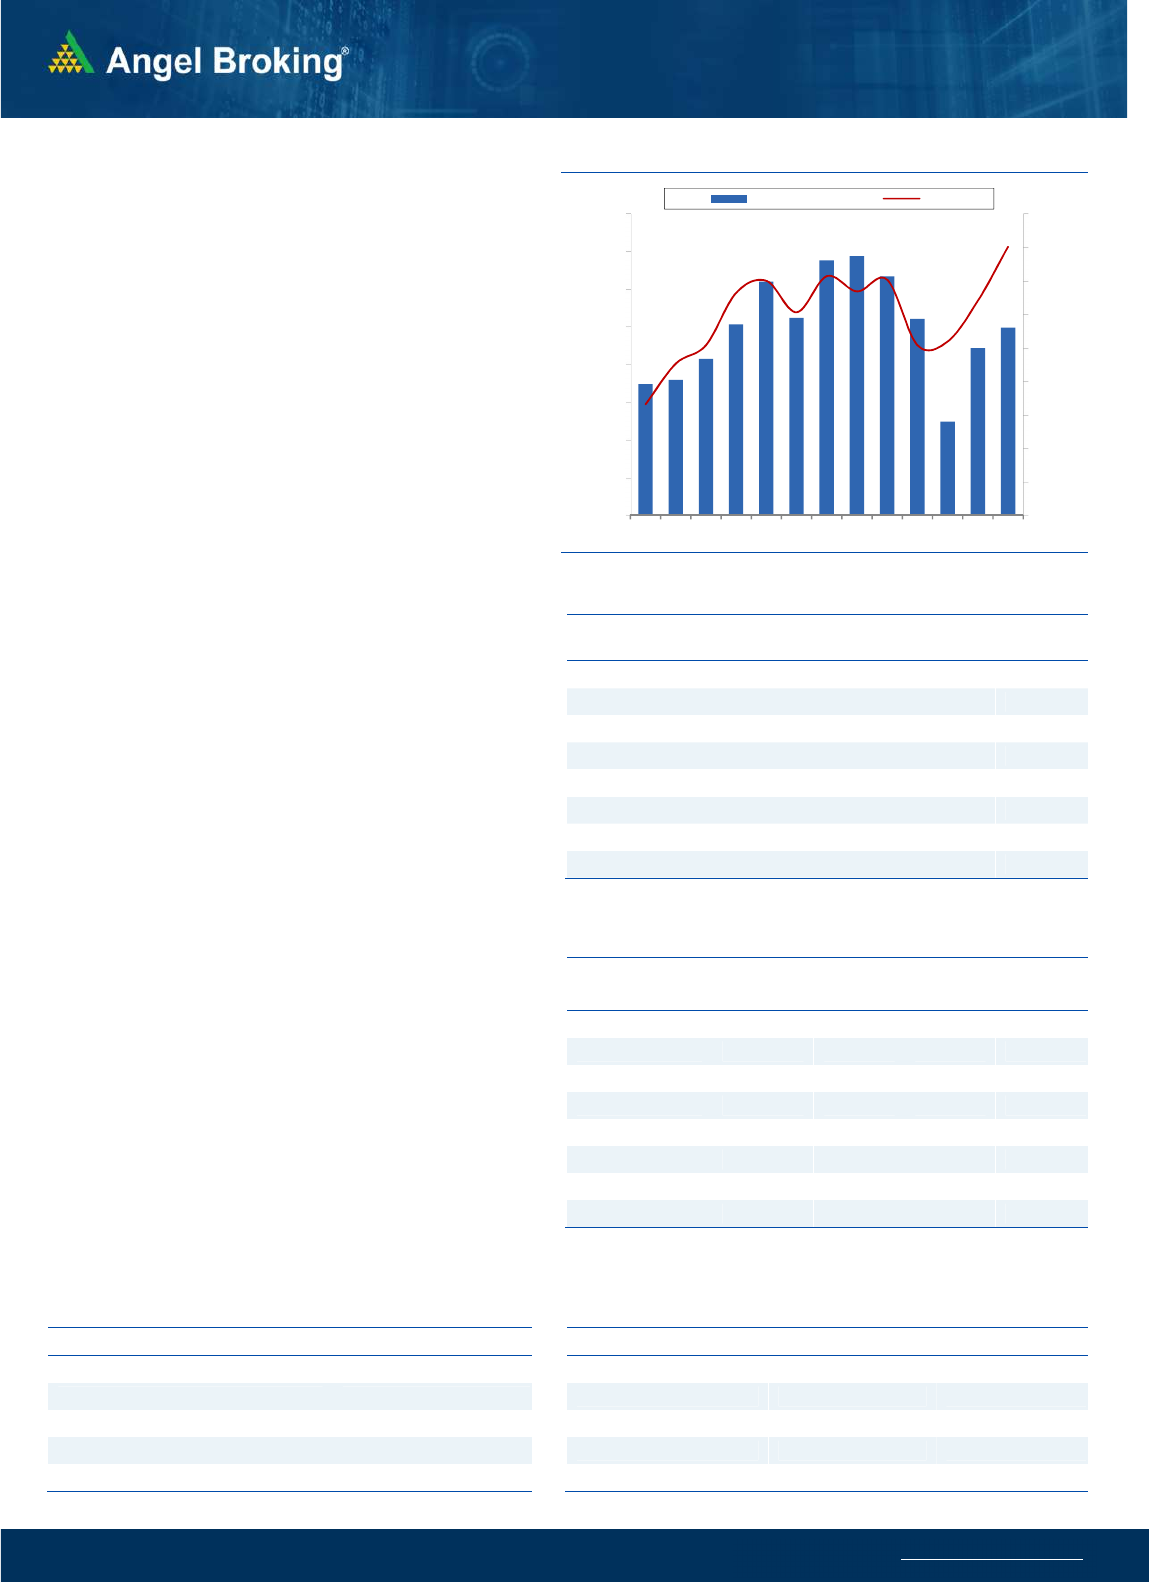
Exhibit 1: Nifty Daily Chart
Sensex (37419) / Nifty (11022)
Nifty started trading for the week with a gap up opening around
the 11000 mark. This was much expected as Nifty gave a breakout
from a consolidation on Friday and ended above its resistance level.
After a gap up opening, index consolidated with a range and traded
with a positive bias to end the day with gains of over a percent.
Yesterday’s positive move in the indices was on the expected lines
and the Nifty finally surpassed the 11000 mark. The upmove was
supported by a broader market participation with leadership seen
from the Banking and Financial stocks at the start of the day, and
then supported by the IT heavyweights in the closing hour. As
mentioned in our weekly update, this upmove should ideally extend
towards the 78.6 percent retracement zone at 11100-11200.
Hence, traders are advised to continue to trade with a positive bias
and avoid taking any contra trades. Around 11200, traders can look
to book profits and take some money off the table. On the flipside,
10920-10900 is the immediate support range and traders should
look for buying opportunities in any intraday declines towards the
support.
Key Levels
Support 1 – 10920 Resistance 1 – 11100
Support 2 – 10900 Resistance 2 – 11200
Exhibit 2: Nifty Bank Daily Chart
www.angelbroking.com
Technical & Derivatives Report
July 21, 2020
Nifty Vs OI
10100
10200
10300
10400
10500
10600
10700
10800
10900
11000
10,000
10,500
11,000
11,500
12,000
12,500
13,000
13,500
14,000
7/1 7/2 7/3 7/6 7/7 7/8 7/9 7/107/137/147/157/167/17
(`000)
Openinterest Nifty
Vie
w
s
The week started on a strong note with a gap up
opening. Subsequently, Index traded within a range for
the major part and ended with gains of 1.11% at 11022.
FIIs were net buyers in the cash market segment to the
tune of Rs. 1710 crores. In index futures, the activity was
muted as they sold worth 68.11 crores with increase in
open interest
.
Nifty started trading for the week on a positive note,
long formation was seen in the index wherein open
interest increased by about 4 percent along with price
upmove. FII's bought equities in the cash segment
which supported the upmove. In options segment, in-
the-money call options of 10800 and 10900 strikes saw
unwinding of positions whereas OI addition was seen in
11200-11500 strikes. On the flipside, 11000-10800 put
options added fresh open interest indicating support
shifting higher. We continue with our advice for traders
to trade with a positive bias and look for buying
opportunities in intraday declines.
C
o
mme
n
t
s
The Nifty futures open interest has increased by 3.83%
Bank Nifty futures open interest has increased by 1.98%
as market closed at 11022.20 levels.
The Nifty July future closed with a discount of 13.6 point
against a premium of 3.35 point in last trading session.
The August series closed at a discount of 5.1 point.
The INDIA VIX has increased from 24.15 to 24.71
At the same time, the PCR-OI of Nifty decreased from
1.76 to 1.75.
Few of the liquid counters where we have seen high cost
of carry are L&TFH, CENTURYTEX, CANBK, NCC, AND
ESCORTS
OI Gainers
SCRIP OI
OI
CHG. (%)
PRICE
PRICE
CHG. (%)
M&MFIN 21863100 90.02 229.60 6.74
KOTAKBANK 9666400 12.14 1319.05 -1.05
ADANIENT 21768000 11.88 160.70 6.04
EQUITAS 11825600 10.51 58.35 5.88
CHOLAFIN 6822500 6.64 215.20 4.16
HDFCBANK 44255200 6.62 1133.05 2.89
ZEEL 24903000 6.59 154.75 -1.90
UPL 14671800 6.23 453.65 3.94
OI Losers
SCRIP OI
OI
CHG. (%)
PRICE
PRICE
CHG. (%)
BRITANNIA 1612000 -24.16 3982.65 5.05
RBLBANK 20514000 -11.00 174.70 3.12
GLENMARK 6904600 -9.61 418.65 -2.54
TATACHEM 3298000 -8.74 306.30 1.81
DIVISLAB 4403200 -8.34 2298.80 1.19
MFSL 1591200 -7.76 569.15 -1.08
FEDERALBNK 57349500 -6.72 53.70 2.96
CANBK 11470000 -5.98 103.00 0.68
Put-Call Ratio
SCRIP PCR-OI PCR-VOL
NIFTY 1.75 0.91
BANKNIFTY 0.92 0.79
RELIANCE 0.63 0.41
ICICIBANK 0.47 0.39
INFY 1.58 0.83
Historical Volatility
SCRIP HV
M&MFIN 82.41
BRITANNIA 50.92
ADANIENT 61.66
SUNPHARMA 46.89
HCLTECH 47.36

www.angelbroking.com
Technical & Derivatives Report
July 21, 2020
Note: Above mentioned Bullish or Bearish Spreads in Nifty (July Series) are given as an information and not as a recommendation.
Nifty Spot =
11022.20
FII Statistics for July 20, 2020
Detail Buy Sell Net
Open Interest
Contracts
Value
(in Cr.)
Change
(%)
INDEX
FUTURES
4151.75
4219.86
(68.11) 117969
8533.91
3.82
INDEX
OPTIONS
189941.86
190240.88
(299.02) 782308
58335.52
6.42
STOCK
FUTURES
14904.96
15179.98
(275.02) 1308733
90326.78
0.47
STOCK
OPTIONS
4591.02
4613.13
(22.11) 113445
7866.17
(0.63)
Total 213589.59
214253.85
(664.26) 2322455
165062.38
2.51
Turnover on July 20, 2020
Instrument
No. of
Contracts
Turnover
( in Cr. )
Change
(%)
Index Futures
4,49,467 29561.75 -10.53
Index Options
1,63,68,040
10,03,760.61
14.79
Stock Futures
8,72,341 59006.44 -5.15
Stock Options
12,96,022
95044.31 -9.88
Total 1,89,85,870
11,87,373.11
10.44
Bull-Call Spreads
Action Strike Price Risk Reward BEP
Buy 11000 159.05
48.80 51.20 11048.80
Sell 11100 110.25
Buy 11000 159.05
88.15 111.85 11088.15
Sell 11200 70.90
Buy 11100 110.25
39.35 60.65 11139.35
Sell 11200 70.90
Bear-Put Spreads
Action Strike Price Risk Reward BEP
Buy 11000 151.95
38.15 61.85 10961.85
Sell 10900 113.80
Buy 11000 151.95
68.10 131.90 10931.90
Sell 10800 83.85
Buy 10900 113.80
29.95 70.05 10870.05
Sell 10800 83.85
Nifty Put-Call Analysis
,0
500,000
1000,000
1500,000
2000,000
2500,000
3000,000
10400 10500 10600 10700 10800 10900 11000 11100 11200 11300 11400 11500 11600 11700
Call Put

www.angelbroking.com
Technical & Derivatives Report
July 21, 2020
Daily Pivot Levels for Nifty Constituents
Scrips
S2
S1
PIVOT
R1
R2
ADANIPORTS
307
312
315
321
324
ASIANPAINT 1,706 1,729
1,743
1,766
1,780
AXISBANK
422
428
435
441
449
BAJAJ-AUTO 2,953 2,978
2,999
3,024
3,045
BAJFINANCE 3,267 3,354
3,404
3,491
3,541
BAJAJFINSV 6,290 6,455
6,545
6,710
6,800
BPCL
427
432
440
445
453
BHARTIARTL
560
568
575
583
590
INFRATEL
186
195
202
210
217
BRITANNIA 3,742 3,862
3,928
4,048
4,113
CIPLA
661
668
679
686
698
COALINDIA
130
132
133
135
136
DRREDDY 4,025 4,058
4,106
4,140
4,188
EICHERMOT 18,565
18,876
19,078
19,389
19,591
GAIL
99
99
101
101
102
GRASIM
585
594
603
612
621
HCLTECH
617
633
642
658
668
HDFCBANK 1,108 1,121
1,137
1,149
1,165
HDFC 1,774 1,790
1,817
1,833
1,860
HEROMOTOCO
2,694
2,777
2,825
2,908
2,957
HINDALCO
158
159
161
163
164
HINDUNILVR 2,282 2,307
2,325
2,349
2,368
ICICIBANK
350
357
362
368
373
IOC
85
87
88
89
90
INDUSINDBK
511
520
531
540
551
INFY
890
912
929
951
967
ITC
190
192
193
195
196
JSW STEEL
202
204
207
209
211
KOTAKBANK 1,294 1,306
1,322
1,334
1,349
LT
905
912
922
929
939
M&M
576
585
591
600
607
MARUTI 5,748 5,808
5,872
5,932
5,996
NESTLEIND 16,930
17,088
17,229
17,388
17,529
NTPC
86
86
88
88
90
ONGC
78
79
80
81
82
POWERGRID
161
162
163
164
165
RELIANCE 1,885 1,902
1,917
1,935
1,950
SHREECEM 21,832
22,049
22,224
22,442
22,617
SBIN
186
189
191
193
195
SUNPHARMA
469
476
489
497
509
TCS 2,172 2,190
2,209
2,226
2,245
TATAMOTORS
103
104
105
106
108
TATASTEEL
343
348
351
356
359
TECHM
588
606
616
633
643
TITAN
974
988
1,000
1,014
1,027
ULTRACEMCO 3,798 3,831
3,861
3,894
3,924
UPL
433
443
450
460
466
VEDANTA
106
107
109
110
111
WIPRO
253
262
268
277
282
ZEEL
151
153
156
158
161

www.angelbroking.com
Technical & Derivatives Report
July 21, 2020
*
Research Team Tel: 022 – 39357600 (Extn. 6844) Website: www.angelbroking.com
For Technical & Derivatives Queries E-mail: technicalresearch-cso@angelbroking.com
DISCLAIMER
Angel Broking Limited (hereinafter referred to as “Angel”) is a registered Member of National Stock Exchange of India Limited, Bombay
Stock Exchange Limited and Metropolitan Stock Exchange Limited. It is also registered as a Depository Participant with CDSL and
Portfolio Manager and Investment Adviser with SEBI. It also has registration with AMFI as a Mutual Fund Distributor. Angel Broking
Limited is a registered entity with SEBI for Research Analyst in terms of SEBI (Research Analyst) Regulations, 2014 vide registration
number INH000000164. Angel or its associates has not been debarred/ suspended by SEBI or any other regulatory authority for
accessing /dealing in securities Market. Angel or its associates/analyst has not received any compensation / managed or co-managed
public offering of securities of the company covered by Analyst during the past twelve months.
This document is solely for the personal information of the recipient, and must not be singularly used as the basis of any investment
decision. Nothing in this document should be construed as investment or financial advice. Each recipient of this document should make
such investigations as they deem necessary to arrive at an independent evaluation of an investment in the securities of the companies
referred to in this document (including the merits and risks involved), and should consult their own advisors to determine the merits
and risks of such an investment.
Reports based on technical and derivative analysis center on studying charts of a stock's price movement, outstanding positions and
trading volume, as opposed to focusing on a company's fundamentals and, as such, may not match with a report on a company's
fundamentals. Investors are advised to refer the Fundamental and Technical Research Reports available on our website to evaluate the
contrary view, if any.
The information in this document has been printed on the basis of publicly available information, internal data and other reliable
sources believed to be true, but we do not represent that it is accurate or complete and it should not be relied on as such, as this
document is for general guidance only. Angel Broking Limited or any of its affiliates/ group companies shall not be in any way
responsible for any loss or damage that may arise to any person from any inadvertent error in the information contained in this report.
Angel Broking Limited has not independently verified all the information contained within this document. Accordingly, we cannot
testify, nor make any representation or warranty, express or implied, to the accuracy, contents or data contained within this document.
While Angel Broking Limited endeavors to update on a reasonable basis the information discussed in this material, there may be
regulatory, compliance, or other reasons that prevent us from doing so.
This document is being supplied to you solely for your information, and its contents, information or data may not be reproduced,
redistributed or passed on, directly or indirectly.
Technical and Derivatives Team:
Sameet Chavan Chief Analyst - Technical & Derivatives sameet.chavan@angelbroking.com
Ruchit Jain Senior Analyst - Technical & Derivatives ruchit.jain@angelbroking.com
Rajesh Bhosale Technical Analyst rajesh.bhosle@angelbroking.com
Sneha Seth Derivatives Analyst sneha.seth@angelbroking.com
