www.angelbroking.com
January 21
, 2021
Technical & Derivatives Report
Nifty
Bank Out
look
-
(
32544
)
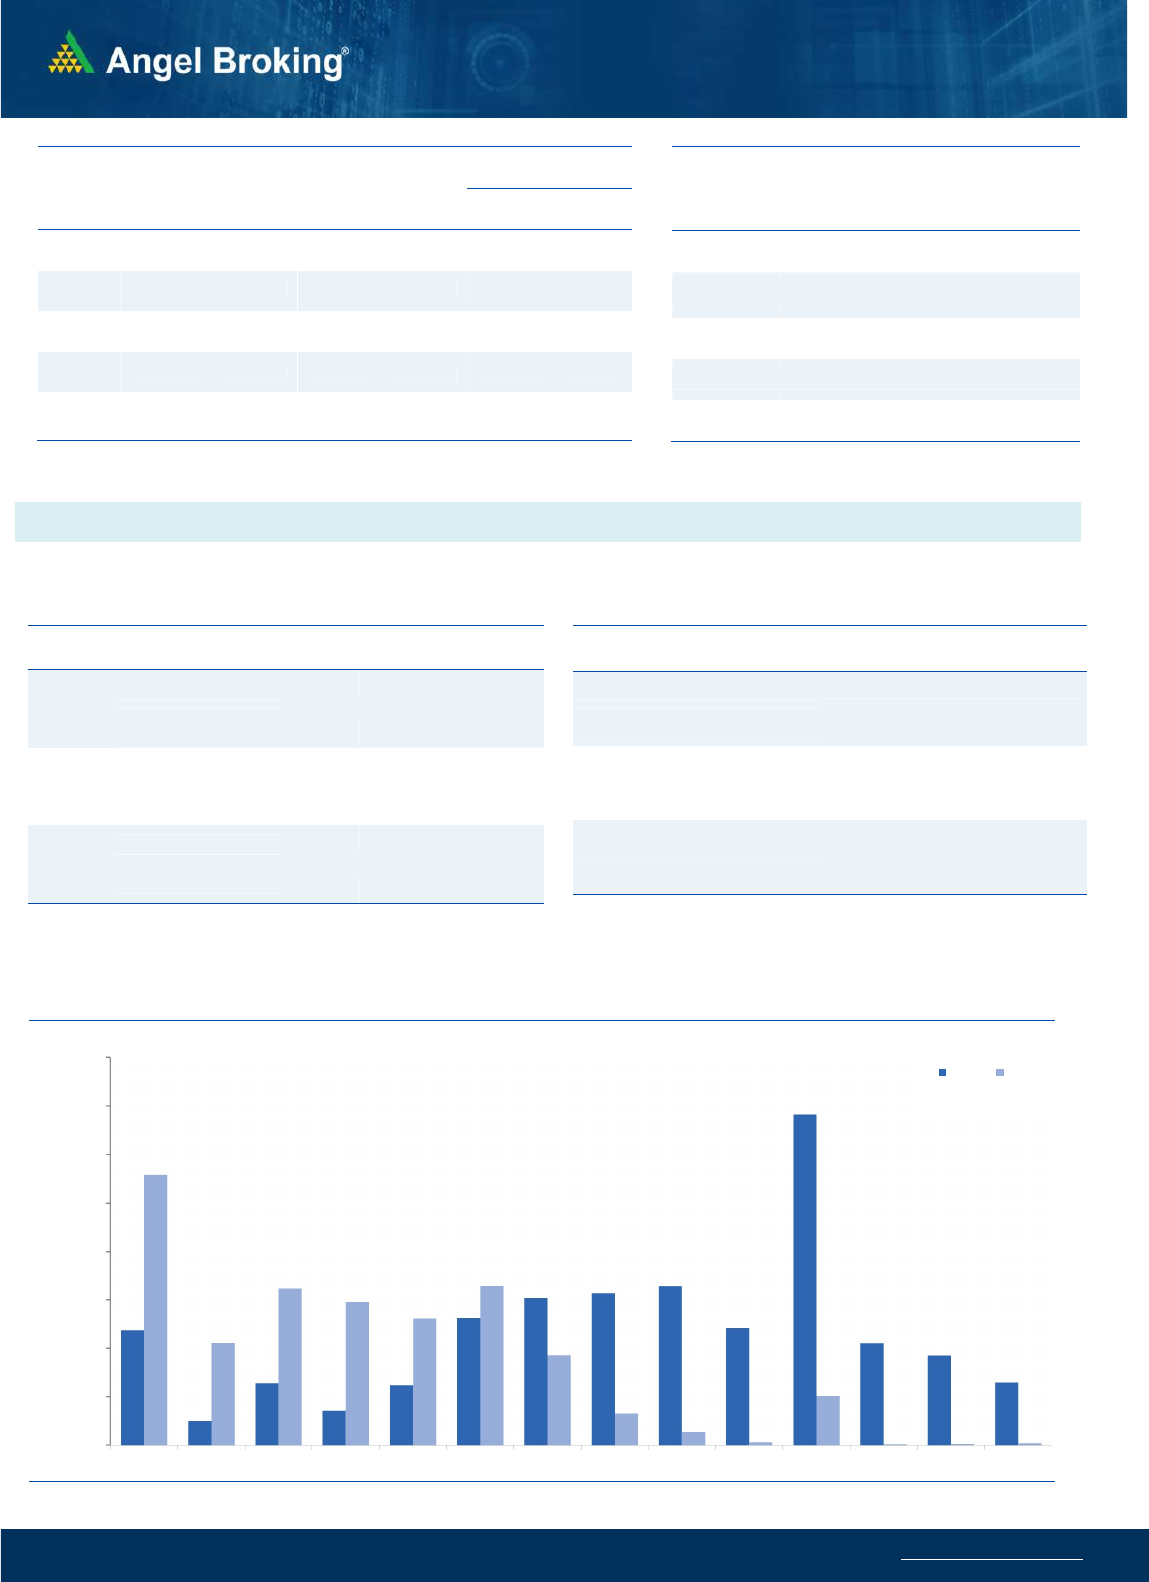
The banking index too opened flat along with the benchmark
index. However as the day progressed, we witnessed good buying
momentum in Nifty; courtesy to some of the heavyweights like,
RIL, HDFC, IT and Auto counters. The BANKNIFTY too extended its
gains a bit; but relatively it underperformed the benchmark index.
For the major part of the day, BANKNIFTY remained in a
consolidation mode to add nearly four tenths of a percent gains.
Monday’s corrective move has completely been engulfed and
markets are trading in a positive territory for the week. Yes, the
sentiments across the globe continues to be optimistic and no
negative development is as good as a positive trigger for the
market. Hence, we are seeing good buying momentum in last
couple of days. However, for BANKNIFTY 32700-33000 remains to
be a strong resistance and till the time it’s not crossed, 32700 –
32000 remains to be an immediate range. Let see how things pan
out on the penultimate weekly expiry day. Traders are advised not
to get carried away and should stay light on positions.
Key Levels
Support 1 – 32200 Resistance 1 – 32700
Support 2 – 32000 Resistance 2 – 33000
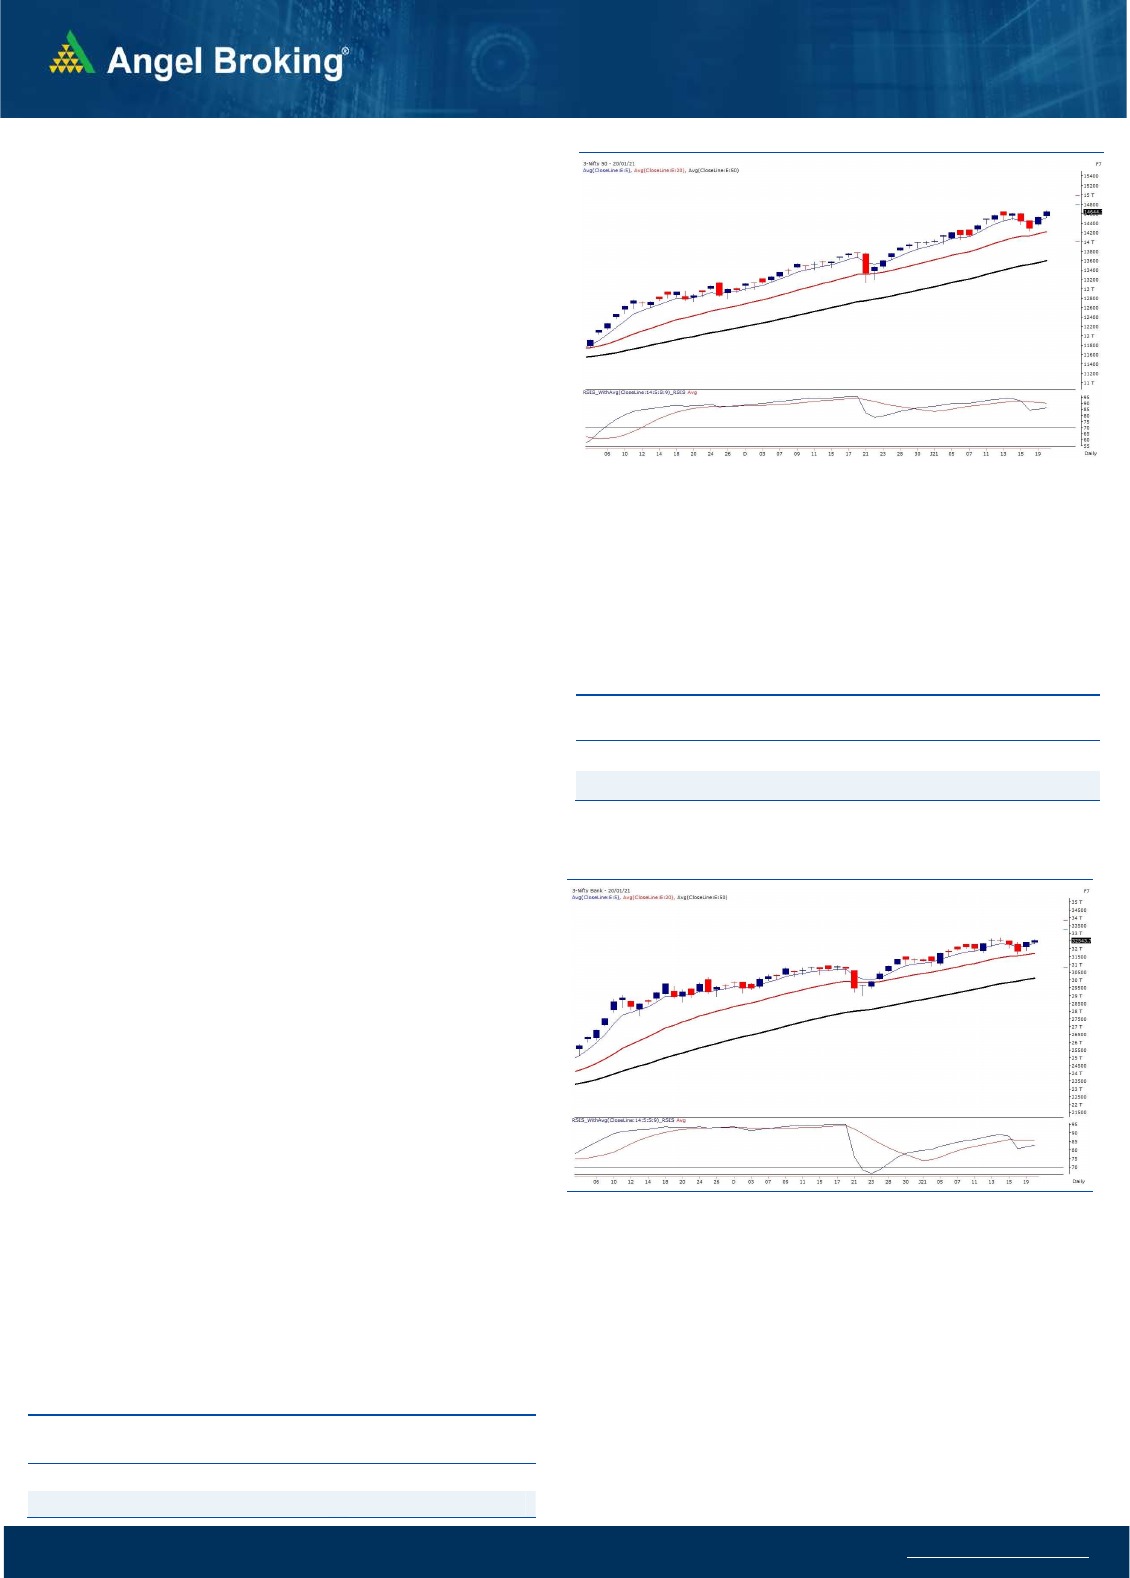
Exhibit 1: Nifty Daily Chart
Se
nsex
(
49792
)
/ Nifty
(
14645
)
The Nifty index opened on a flat note and gradually moved higher
during the day to register new highs. In just a couple of sessions, the
index recovered all its losses of the recent correction and has ended
the day tad below 14650.
The index continued its previous day’s upmove yesterday supported
mainly by the IT heavyweights. The Auto stocks and the heavyweight
Reliance Industries too contributed and participated in the upmove.
Although, the Banking index consolidated in a range yesterday and
relatively underperformed the Nifty as no significant momentum was
seen in the private sector banking stocks. If we look at the recent
chart of Nifty on the daily time-frame, it is seen that the 20-day EMA
has acted as a support on intermediate declines and the index has
continued its ‘Higher Top Higher Bottom’ structure. With last two
days of upmove, this moving average support now coincides with
Monday’s low of 14222 and thus, it now becomes a sacrosanct for
the short term. Apart from this, the Nifty Midcap index had seen
some correction from its important level as per the retracement
theory and hence, it would be crucial to see if this index surpasses
its swing high with an ease. In case the midcap index does not break
this hurdle, then we could see some volatility again in the short term
and hence, traders should keep a close tab on this index.
Meanwhile, we continue with our advice for traders to keep focusing
on stock specific moves and identify the sectors which are showing
momentum on a given day. Traders should also avoid taking
leverage positions at this juncture and focus on timely exits on the
trading positions. The intraday supports in Nifty for the coming
session are placed around 14535 and 14490 whereas resistances are
seen around 14710 and 14770.
Key Levels
Support 1 – 14535 Resistance 1 – 14710
Support 2 – 14490 Resistance2 – 14770
Exhibit 2: Nifty Bank Daily Chart

www.angelbroking.com
Technical & Derivatives Report
January 21
, 2021
Nifty Vs OI
13700
13800
13900
14000
14100
14200
14300
14400
14500
14600
14700
12,000
12,500
13,000
13,500
14,000
14,500
15,000
15,500
1/1 1/5 1/7 1/11 1/13 1/15 1/19
(`000)
Openinterest Nifty
View
Nifty opened marginally positive and continued the
upmove to end well above 14600.
FIIs were net buyers in the cash segment to the tune of
Rs. 2289 crore. In index future segment, they sold worth Rs.
1313 crores with decrease in open interest indicating long
unwinding in yesterday’s session.
In yesterday's upmove, we witnessed fresh long formations
in Nifty while short covering was seen in Bank Nifty.
However, FII's preferred to book some profits in the rally
and hence unwound some of their longs. In options
segment, 14500 and 14600 call writers ran to cover their
short positions while open interest addition was seen in
14600-14500 put options. The options data hint at support
in the range of 14600-14500 while resistance is seen around
14700 - 14750. Traders are advised to trade with a stock
specific approach for the near term and book profits on
existing longs in the higher end of the mentioned range.
C
o
mme
n
t
s
The Nifty futures open interest has increased by 4.88%
Bank Nifty futures open interest has decreased by 6.62%
as market closed at 14644.70 levels.
The Nifty January future closed with a premium of 0.45
point against a premium of 48.85 point in last trading
session. The February series closed at a premium of 38.5
point.
The INDIA VIX decreased from 22.90 to 21.55.
At the same time, the PCR-OI of Nifty increased from 1.36
to 1.44.
Few of the liquid counters where we have seen high cost
of carry are SAIL, BHEL, PNB, FEDERALBNK, GODREJPROP
AND BEL.
OI Gainers
SCRIP OI
OI
CHG. (%)
PRICE
PRICE
CHG. (%)
APOLLOTYRE 15780000 20.97 201.90 6.96
AARTIIND 473450 12.87 1211.95 -2.02
TORNTPOWER 4911000 11.28 333.55 -1.59
PNB 213568000 10.12 36.95 1.23
HAVELLS 4741000 9.62 1020.15 0.21
MOTHERSUMI 32025000 9.50 158.25 -0.87
MCDOWELL-N 11213750 8.84 619.90 -1.52
BANKBARODA 65484900 8.81 79.45 4.86
OI Losers
SCRIP OI
OI
CHG. (%)
PRICE
PRICE
CHG. (%)
BOSCHLTD 126000 -6.60 15882.35 4.22
APOLLOHOSP 1642500 -6.28 2675.80 0.69
ICICIPRULI 4135500 -5.00 515.25 0.16
L&TFH 30942400 -4.90 103.85 -1.94
GODREJCP 3751000 -4.70 801.05 1.36
MINDTREE 1934400 -4.54 1782.90 6.10
BHEL 102732000 -4.49 40.50 2.52
IDFCFIRSTB 181564000 -3.91 51.45 2.09
Put-Call Ratio
SCRIP PCR-OI PCR-VOL
NIFTY 1.44 1.02
BANKNIFTY 0.93 0.96
RELIANCE 0.57 0.47
ICICIBANK 0.56 0.42
INFY 0.35 0.29
Historical Volatility
SCRIP HV
MRF 38.34
APOLLOTYRE 53.05
MINDTREE 55.96
ADANIPORTS 47.03
TATAMOTORS 69.14
www.angelbroking.com
Technical & Derivatives Report
January 21
, 2021
Note: Above mentioned Bullish or Bearish Spreads in Nifty (January Series) are given as an information and not as a recommendation.
Nifty Spot =
14644.70
FII Statistics for January 20, 2020
Detail Buy
Net Contracts
Open Interest
Sell
Value
(in Cr.)
Change
INDEX
FUTURES
3070.02
4383.50
(1313.48) 124471
12819.53
(3.24)
INDEX
OPTIONS
357042.21
357702.90
(660.69) 892074
89949.36
2.60
STOCK
FUTURES
10460.01
10792.58
(332.57) 1214146
101492.87
0.17
STOCK
OPTIONS
12011.24
12052.85
(41.61) 186974
15744.41
(0.04)
Total 382583.48
384931.83
(2348.35) 2417665
220006.17
0.85
Turnover on January 20, 2020
Instrume
nt
No. of
Contracts
Turnover
( in Cr. )
Change
(%)
Index Futures 2,89,801 27164.85 -15.99
Index Options 3,32,76,958
30,55,816.88 26.23
Stock Futures 7,86,691 70296.61 4.00
Stock Options 20,15,695 1,88,906.97 8.55
Total 3,63,69,145
33,42,185.31 24.02
Bull-Call Spreads
Action Strike Price Risk Reward BEP
Buy 14700 103.90
42.60 57.40 14742.60
Sell 14800 61.30
Buy 14700 103.90
71.15 128.85 14771.15
Sell 14900 32.75
Buy 14800 61.30
28.55 71.45 14828.55
Sell 14900 32.75
Bear-Put Spreads
Action Strike Price Risk Reward BEP
Buy 14600 112.30
32.35 67.65 14567.65
Sell 14500 79.95
Buy 14600 112.30
54.75 145.25 14545.25
Sell 14400 57.55
Buy 14500 79.95
22.40 77.60 14477.60
Sell 14400 57.55
Nifty Put-Call Analysis
,0
500,000
1000,000
1500,000
2000,000
2500,000
3000,000
3500,000
4000,000
14000 14100 14200 14300 14400 14500 14600 14700 14800 14900 15000 15100 15200 15300
Call Put

www.angelbroking.com
Technical & Derivatives Report
January 21
, 2021
Da
ily
Pivot Level
s for
Nifty Constituents
Scrips
S2
S1
PIVOT
R1
R2
ADANIPORTS
517
538
550
571
584
ASIANPAINT 2,621 2,659
2,683
2,721
2,745
AXISBANK
657
666
674
683
691
BAJAJ-AUTO 3,592 3,618
3,655
3,681
3,719
BAJFINANCE 4,840 4,911
4,972
5,043
5,103
BAJAJFINSV 8,747 8,843
8,934
9,030
9,121
BPCL
406
410
413
417
421
BHARTIARTL
582
589
596
603
609
BRITANNIA 3,550 3,571
3,606
3,627
3,662
CIPLA
817
825
830
838
843
COALINDIA
137
139
141
143
144
DIVISLAB 3,554 3,580
3,623
3,649
3,692
DRREDDY 5,007 5,044
5,102
5,139
5,197
EICHERMOT 2,805 2,843
2,904
2,942
3,002
GAIL
136
137
139
140
142
GRASIM 1,006 1,020
1,029
1,044
1,053
HCLTECH
977
988
999
1,010
1,021
HDFCBANK 1,478 1,485
1,493
1,500
1,508
HDFCLIFE
693
698
705
710
717
HDFC 2,585 2,637
2,674
2,726
2,764
HEROMOTOCO 3,204 3,240
3,266
3,302
3,328
HINDALCO
246
249
251
254
257
HINDUNILVR 2,331 2,344
2,359
2,371
2,386
ICICIBANK
542
546
551
555
559
IOC
97
97
99
99
101
INDUSINDBK
918
933
943
958
969
INFY 1,308 1,324
1,336
1,352
1,364
ITC
214
216
217
219
221
JSW STEEL
390
395
399
405
409
KOTAKBANK 1,860 1,872
1,881
1,893
1,902
LT 1,349 1,366
1,379
1,396
1,410
M&M
790
807
819
837
849
MARUTI 7,749 7,947
8,058
8,257
8,368
NESTLEIND 17,431
17,556
17,748
17,873
18,065
NTPC
97
98
99
99
100
ONGC
97
98
99
100
101
POWERGRID
192
194
197
199
203
RELIANCE 1,981 2,018
2,038
2,075
2,095
SBILIFE
885
891
901
907
917
SHREECEM 23,461
23,720
24,095
24,355
24,730
SBIN
294
298
301
306
309
SUNPHARMA
586
591
597
601
608
TCS 3,240 3,275
3,301
3,335
3,362
TATAMOTORS
252
263
270
282
289
TATASTEEL
674
682
691
699
708
TECHM
987
1,003
1,013
1,030
1,040
TITAN 1,510 1,520
1,531
1,542
1,552
ULTRACEMCO 5,431 5,489
5,522
5,580
5,612
UPL
546
561
572
587
597
WIPRO
427
436
442
451
457

www.angelbroking.com
Technical & Derivatives Report
January 21
, 2021
*
Research Team Tel: 022 – 39357600 (Extn. 6844) Website: www.angelbroking.com
DISCLAIMER
Angel Broking Limited (hereinafter referred to as “Angel”) is a registered Member of National Stock Exchange of India Limited, Bombay
Stock Exchange Limited and Metropolitan Stock Exchange Limited. It is also registered as a Depository Participant with CDSL and
Portfolio Manager and Investment Adviser with SEBI. It also has registration with AMFI as a Mutual Fund Distributor. Angel Broking
Limited is a registered entity with SEBI for Research Analyst in terms of SEBI (Research Analyst) Regulations, 2014 vide registration
number INH000000164. Angel or its associates has not been debarred/ suspended by SEBI or any other regulatory authority for
accessing /dealing in securities Market. Angel or its associates/analyst has not received any compensation / managed or co-managed
public offering of securities of the company covered by Analyst during the past twelve months.
This document is solely for the personal information of the recipient, and must not be singularly used as the basis of any investment
decision. Nothing in this document should be construed as investment or financial advice. Each recipient of this document should make
such investigations as they deem necessary to arrive at an independent evaluation of an investment in the securities of the companies
referred to in this document (including the merits and risks involved), and should consult their own advisors to determine the merits
and risks of such an investment.
Reports based on technical and derivative analysis center on studying charts of a stock's price movement, outstanding positions and
trading volume, as opposed to focusing on a company's fundamentals and, as such, may not match with a report on a company's
fundamentals. Investors are advised to refer the Fundamental and Technical Research Reports available on our website to evaluate the
contrary view, if any.
The information in this document has been printed on the basis of publicly available information, internal data and other reliable
sources believed to be true, but we do not represent that it is accurate or complete and it should not be relied on as such, as this
document is for general guidance only. Angel Broking Limited or any of its affiliates/ group companies shall not be in any way
responsible for any loss or damage that may arise to any person from any inadvertent error in the information contained in this report.
Angel Broking Limited has not independently verified all the information contained within this document. Accordingly, we cannot
testify, nor make any representation or warranty, express or implied, to the accuracy, contents or data contained within this document.
While Angel Broking Limited endeavors to update on a reasonable basis the information discussed in this material, there may be
regulatory, compliance, or other reasons that prevent us from doing so.
This document is being supplied to you solely for your information, and its contents, information or data may not be reproduced,
redistributed or passed on, directly or indirectly.
Technical and Derivatives Team:
Sameet Chavan Chief Analyst - Technical & Derivatives sameet.chavan@angelbroking.com
Ruchit Jain Senior Analyst - Technical & Derivatives ruchit.jain@angelbroking.com
Rajesh Bhosale Technical Analyst rajesh.bhosle@angelbroking.com
Sneha Seth Derivatives Analyst sneha.seth@angelbroking.com
