www.angelbroking.com
Technical &
Derivatives Report
October 20, 2020
Nifty
Bank Out
look
-
(
24267
)
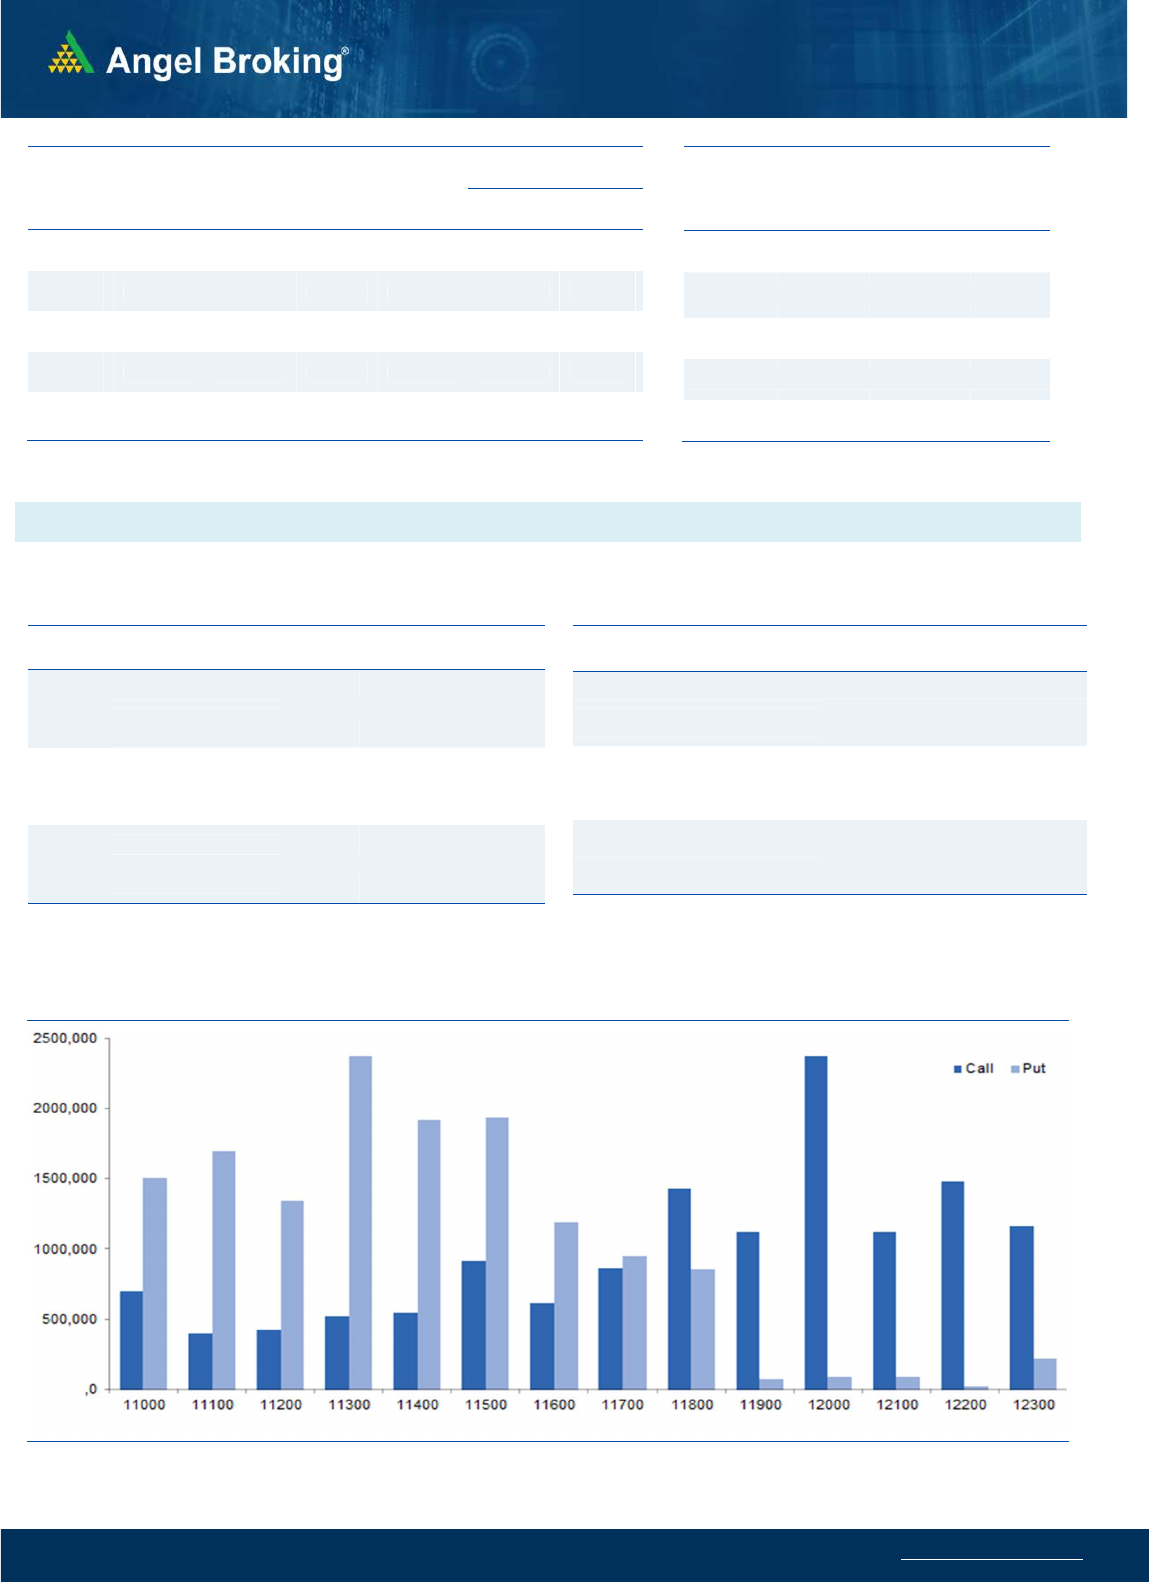
The banking index started the week with a good bump up in
tandem with the benchmark. During the initial hours, the lead got
extended as some of the heavyweight banking stocks attracted
tremendous buying interest. This resulted in a strong breakout
beyond the 24000 mark. At the mid session, the BANKNIFTY
dipped a bit; but the overall undercurrent is so strong, the small
decline immediately got bought into to eventually end the day
with sizable gains over three percent.
Since the last 3-4 days we are observing an interesting
development, where the recent leaders like IT and RIL have taken
a back step and financial space has taken a charge. Earlier
banking stocks were not letting Nifty go higher; but now if Nifty
has to surpass the 12000 mark, the BANKNIFTY will dominate the
move. Yesterday’s close above 24000 is a sign of strength and
hence, any decline towards 24100 – 23900 should now be
construed as a buying opportunity. On the higher side, we expect
it to continue its march towards 24500 – 24700 levels.
Key Levels
Support 1 – 24100 Resistance 1 – 24500
Support 2 – 23900 Resistance 2 – 24700
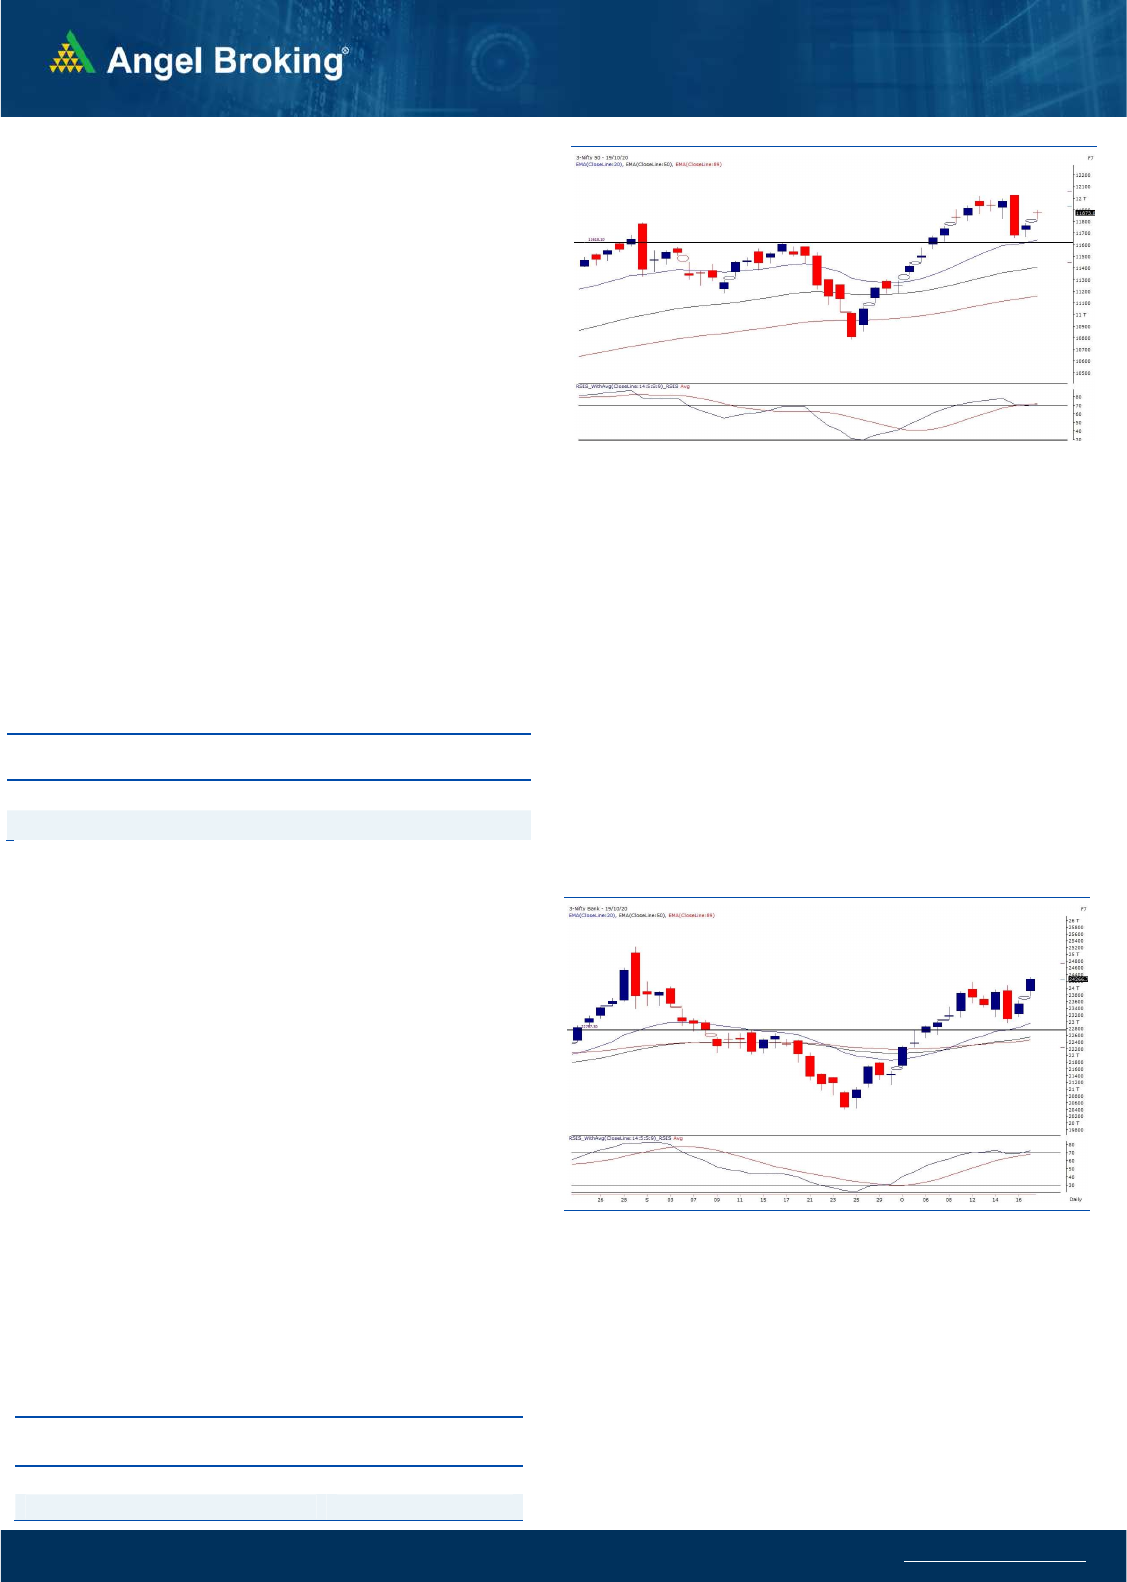
Exhibit 1: Nifty Daily Chart
Se
nsex
(
40432)
/ Nifty
(
11873
)
The Asian markets were trading with a positive bias yesterday
morning which led to an optimistic sentiment an hence, our
markets too started the week with a gap up. Nifty then
consolidated within a range throughout the day and ended with
gains of almost a percent at 11873.
We had a good start for the week led by the Banking space which
too started the day on a positive note. During the day, the Banking
index led the momentum and posted gains of over 3 percent while
the recent outperforming IT sector, Auto stocks and the index
heavyweight RIL took a backseat. Some other sectors such as
Metals and FMCG too traded with a positive bias and hence, it
could be said that it was a day with a sector specific momentum.
Post the hiccup seen in the last week, the Nifty is back to the safer
zone and the immediate support base has now shifted higher at
11780-11820. On the higher side, the resistance is seen around the
12000 mark and once this is taken out, our markets would again
gear for the next leg of the rally. Traders are advised to trade with a
positive bias and look for such sectors which are in momentum and
are providing good trading opportunities.
.Key Levels
Support 1 – 11820 Resistance 1 – 11950
Support 2 – 11780 Resistance2 – 12000
Exhibit 2: Nifty Bank Daily Chart

www.angelbroking.com
Technical & Derivatives Report
October 20, 2020
Nifty Vs OI
10800
11000
11200
11400
11600
11800
12000
12200
,0
2,000
4,000
6,000
8,000
10,000
12,000
14,000
9/30 10/5 10/7 10/9 10/13 10/15
(`000)
Openinterest Nifty
Vie
w
s
We started of the week with an upside gap.During the
day, index corrected towards 11800 but fresh demard
was seen around this zone. Nifty then consolidated to
eventually conclude the day tad above 11850.
FIIs were net buyers in the cash segment to the tune of
Rs. 1657 crores. In index future segment, they bought
worth Rs. 141 crores with rise in open interest,
indicating some long formation in yesterday’s session.
Last weeks correction was mainly due to unwinding. In
yesterday’s recovery, we saw addition of fresh longs
especially in BankNifty. For the entire October series,
we witnessed strong outperformace by the banking
index and yesterday we finally saw it surpassing the
hurdle around 24000. Considring the options activity,
we may soon see extention of yesterday’s rally towards
24500-24700. In case of Nifty, good amount of writing
was seen in 11800 put strikes, which is a positive
development. Hence, any declines towards 11800 mark
shall be an opportunity to add longs.
C
o
mme
n
t
s
The Nifty futures open interest has increased by 0.27%
Bank Nifty futures open interest has increased by 4.03%
as market closed at 11873.05 levels.
The Nifty October future closed with a premium of 16.35
point against a premium of 2.70 point in last trading
session. The November series closed at a premium of
40.90 point.
The INDIA VIX has increased from 21.64 to 21.82.
At the same time, the PCR-OI of Nifty increased from
1.31 to 1.35.
Few of the liquid counters where we have seen high
cost of carry are IBULHSGFIN, PNB, NTPC, HAVELLS,
HDFCLIFE and BANKBARODA.
OI Gainers
SCRIP OI
OI
CHG. (%)
PRICE
PRICE
CHG. (%)
MINDTREE 1810400 37.90 1341.75 0.49
AMBUJACEM 23256000 28.32 247.60 -0.24
COLPAL 2731400 23.40 1476.70 2.82
ACC 2723000 16.67 1562.65 0.16
M&MFIN 18043116 16.11 129.95 3.61
UPL 15440100 14.29 463.45 -0.67
FEDERALBNK 88850500 12.16 56.20 7.63
L&TFH 29586800 11.19 63.30 3.42
OI Losers
SCRIP OI
OI
CHG. (%)
PRICE
PRICE
CHG. (%)
GODREJPROP 826800 -13.59 900.95 3.83
IOC 54970800 -8.64 76.80 3.49
COFORGE 449250 -7.85 2543.55 -0.42
TATAMOTORS 75656100 -6.36 128.25 0.51
INFY 36397200 -5.65 1125.90 0.18
SRF 602500 -4.55 4450.60 -0.10
COALINDIA 49284000 -3.96 114.70 2.81
JUBLFOOD 1792000 -3.91 2248.00 -3.06
Put-Call Ratio
SCRIP PCR-OI PCR-VOL
NIFTY 1.35 0.91
BANKNIFTY 1.15 0.76
RELIANCE 0.47 0.42
ICICIBANK 0.86 0.49
INFY 0.37 0.41
Historical Volatility
SCRIP HV
UPL 58.86
MINDTREE 60.59
JSWSTEEL 58.01
CUMMINSIND 41.34
VOLTAS 43.69
www.angelbroking.com
Technical & Derivatives Report
October 20, 2020
Note: Above mentioned Bullish or Bearish Spreads in Nifty (October Series) are given as an information and not as a recommendation.
Nifty Spot =
11873.05
FII Statistics for October 19, 2020
Detail Buy
Net Contracts
Open Interest
Sell
Value
(in Cr.)
Change
INDEX
FUTURES
3729.54 3588.72 140.82
142472 11575.76 1.70
INDEX
OPTIONS
198110.28 198145.12 (34.84) 950458 77341.24 5.59
STOCK
FUTURES
14712.14 15357.06 (644.92) 1125585 80540.53 0.86
STOCK
OPTIONS
6833.19 6874.34 (41.15) 106269 8345.96 2.25
Total 223385.15
223965.24
(580.09) 2324784
177803.49
2.86
Turnover on October 19, 2020
Instrument
No. of
Contracts
Turnover
( in Cr. )
Change
(%)
Index Futures
4,74,726 32729.19 -24.03
Index Options
1,75,66,909 12,54,660.23 -77.59
Stock Futures
7,23,284 55917.39 -10.06
Stock Options
12,46,592 1,05,193.16 -12.72
Total 2,00,11,511 14,48,499.97 -75.13
Bull-Call Spreads
Action Strike Price Risk Reward BEP
Buy 11900 132.95
47.20 52.80 11947.20
Sell 12000 85.75
Buy 11900 132.95
82.50 117.50 11982.50
Sell 12100 50.45
Buy 12000 85.75
35.30 64.70 12035.30
Sell 12100 50.45
Bear-Put Spreads
Action Strike Price Risk Reward BEP
Buy 11900 143.85
39.45 60.55 11860.55
Sell 11800 104.40
Buy 11900 143.85
68.25 131.75 11831.75
Sell 11700 75.60
Buy 11800 104.40
28.80 71.20 11771.20
Sell 11700 75.60
Nifty Put-Call Analysis

www.angelbroking.com
Technical & Derivatives Report
October 20, 2020
Da
ily
Pivot Level
s for
Nifty Constituents
Scrips
S2
S1
PIVOT
R1
R2
ADANIPORTS
341
344
348
352
356
ASIANPAINT 2,045 2,058
2,069
2,081
2,092
AXISBANK
469
481
488
500
508
BAJAJ-AUTO 2,906 2,943
3,007
3,045
3,109
BAJFINANCE 3,155 3,211
3,253
3,309
3,351
BAJAJFINSV 5,869 5,925
5,981
6,038
6,094
BPCL
338
343
345
349
352
BHARTIARTL
388
393
399
404
409
BRITANNIA 3,714 3,743
3,769
3,798
3,824
CIPLA
748
756
770
778
792
COALINDIA
110
112
114
116
118
DIVISLAB 2,980 3,037
3,142
3,199
3,304
DRREDDY 4,932 4,995
5,105
5,168
5,278
EICHERMOT 2,126 2,162
2,221
2,257
2,316
GAIL
83
85
86
89
90
GRASIM
752
762
772
783
793
HCLTECH
818
831
846
860
875
HDFCBANK 1,168 1,186
1,210
1,228
1,253
HDFCLIFE
560
565
570
575
580
HDFC 1,961 1,996
2,018
2,053
2,075
HEROMOTOCO 3,151 3,200
3,279
3,328
3,407
HINDALCO
175
179
181
185
188
HINDUNILVR 2,139 2,158
2,172
2,191
2,205
ICICIBANK
395
406
412
424
430
IOC
73
75
76
78
79
INDUSINDBK
597
612
621
636
646
INFY 1,103 1,114
1,127
1,138
1,150
ITC
165
167
168
169
171
JSW STEEL
303
308
313
319
324
KOTAKBANK 1,317 1,347
1,363
1,393
1,410
LT
876
889
898
911
920
M&M
583
590
602
610
622
MARUTI 6,731 6,791
6,886
6,946
7,041
NESTLEIND 15,146
15,619
15,899
16,372
16,652
NTPC
79
80
82
83
84
ONGC
66
68
69
71
72
POWERGRID
158
159
161
162
164
RELIANCE 2,113 2,145
2,187
2,218
2,260
SBILIFE
787
793
801
806
814
SHREECEM 20,797
20,950
21,175
21,327
21,553
SBIN
193
199
202
207
210
SUNPHARMA
475
479
485
489
495
TCS 2,663 2,687
2,731
2,755
2,798
TATAMOTORS
126
127
129
130
131
TATASTEEL
388
392
396
400
404
TECHM
807
816
826
835
845
TITAN 1,204 1,216
1,226
1,238
1,247
ULTRACEMCO 4,425 4,470
4,509
4,554
4,594
UPL
435
449
462
476
489
WIPRO
335
339
343
347
351

www.angelbroking.com
Technical & Derivatives Report
October 20, 2020
*
Research Team Tel: 022 – 39357600 (Extn. 6844) Website: www.angelbroking.com
For Technical Queries E-mail: technicalresearch-cso@angelbroking.com
DISCLAIMER
Angel Broking Limited (hereinafter referred to as “Angel”) is a registered Member of National Stock Exchange of India Limited,
Bombay Stock Exchange Limited and Metropolitan Stock Exchange Limited. It is also registered as a Depository Participant with CDSL
and Portfolio Manager and Investment Adviser with SEBI. It also has registration with AMFI as a Mutual Fund Distributor. Angel
Broking Limited is a registered entity with SEBI for Research Analyst in terms of SEBI (Research Analyst) Regulations, 2014 vide
registration number INH000000164. Angel or its associates has not been debarred/ suspended by SEBI or any other regulatory
authority for accessing /dealing in securities Market. Angel or its associates/analyst has not received any compensation / managed
or co-managed public offering of securities of the company covered by Analyst during the past twelve months.
This document is solely for the personal information of the recipient, and must not be singularly used as the basis of any investment
decision. Nothing in this document should be construed as investment or financial advice. Each recipient of this document should
make such investigations as they deem necessary to arrive at an independent evaluation of an investment in the securities of the
companies referred to in this document (including the merits and risks involved), and should consult their own advisors to determine
the merits and risks of such an investment.
Reports based on technical and derivative analysis center on studying charts of a stock's price movement, outstanding positions and
trading volume, as opposed to focusing on a company's fundamentals and, as such, may not match with a report on a company's
fundamentals. Investors are advised to refer the Fundamental and Technical Research Reports available on our website to evaluate
the contrary view, if any.
The information in this document has been printed on the basis of publicly available information, internal data and other reliable
sources believed to be true, but we do not represent that it is accurate or complete and it should not be relied on as such, as this
document is for general guidance only. Angel Broking Limited or any of its affiliates/ group companies shall not be in any way
responsible for any loss or damage that may arise to any person from any inadvertent error in the information contained in this
report. Angel Broking Limited has not independently verified all the information contained within this document. Accordingly, we
cannot testify, nor make any representation or warranty, express or implied, to the accuracy, contents or data contained within this
document. While Angel Broking Limited endeavors to update on a reasonable basis the information discussed in this material, there
may be regulatory, compliance, or other reasons that prevent us from doing so.
This document is being supplied to you solely for your information, and its contents, information or data may not be reproduced,
redistributed or passed on, directly or indirectly.
Technical and Derivatives Team:
Sameet Chavan Chief Analyst - Technical & Derivatives sameet.chavan@angelbroking.com
Ruchit Jain Senior Analyst - Technical & Derivatives ruchit.jain@angelbroking.com
Rajesh Bhosale Technical Analyst rajesh.bhosle@angelbroking.com
Sneha Seth Derivatives Analyst sneha.seth@angelbroking.com
