www.angelbroking.com
Technical & Derivatives Report
June 19, 2020
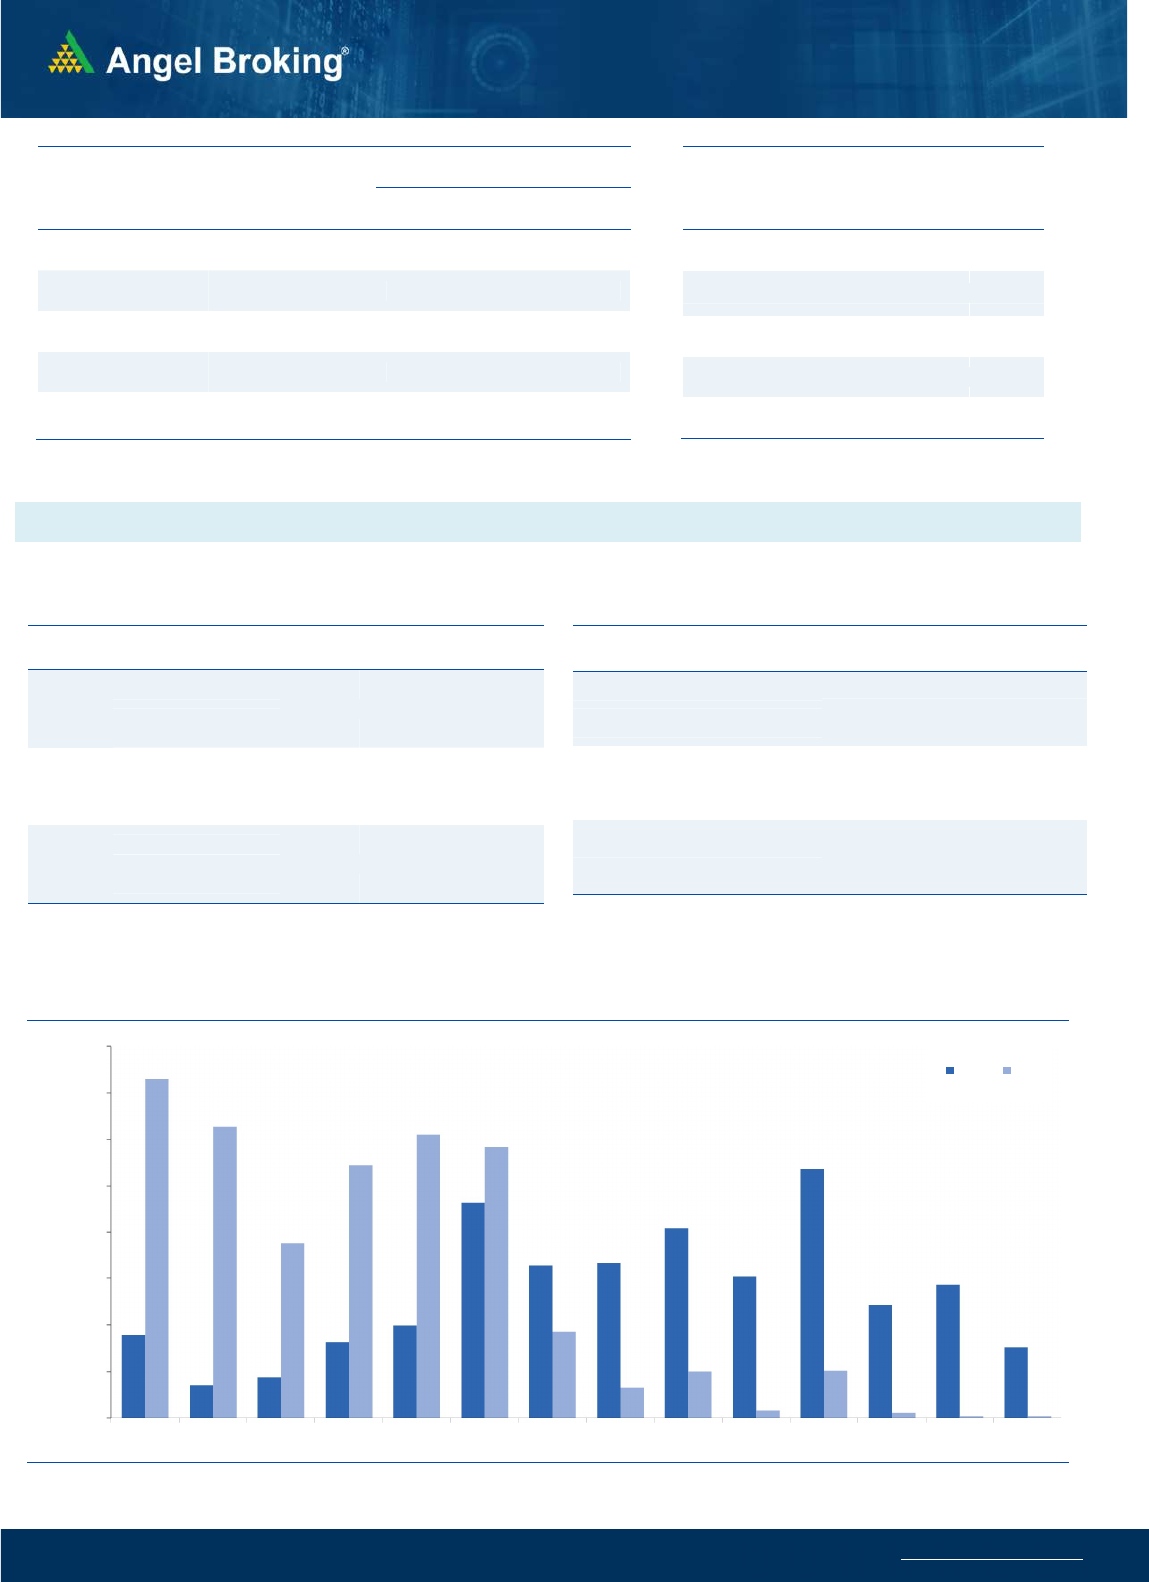
Nifty Bank Outlook - (20956)
In yesterday's session, the Bank Nifty index started trading for the
session on a flat note. The index took support near the 20000
mark and saw a gradual pullback move till noon. However, in the
last couple of hours of the trade, the index rallied sharply and
continued the momentum till the end to close tad below the
21000 mark.
The Bank Nifty rallied by almost 1000 points from its day's low led
by the index heavyweights such as HDFC Bank, Kotak Bank, SBI
and ICICI Bank. As mentioned in our earlier report, the '200 SMA'
support on the hourly chart has played its role well and now the
momentum has resumed in the index. The index seem to have
started the next leg of upmove post the retracement and hence,
traders are advised to continue to trade with a positive bias. The
immediate supports for the index are now placed around 20600
followed by 20000 whereas intraday resistance is seen around
21670.
Key Levels
Support 1 – 20600 Resistance 1 – 21500
Support 2 – 20000 Resistance 2 – 21670
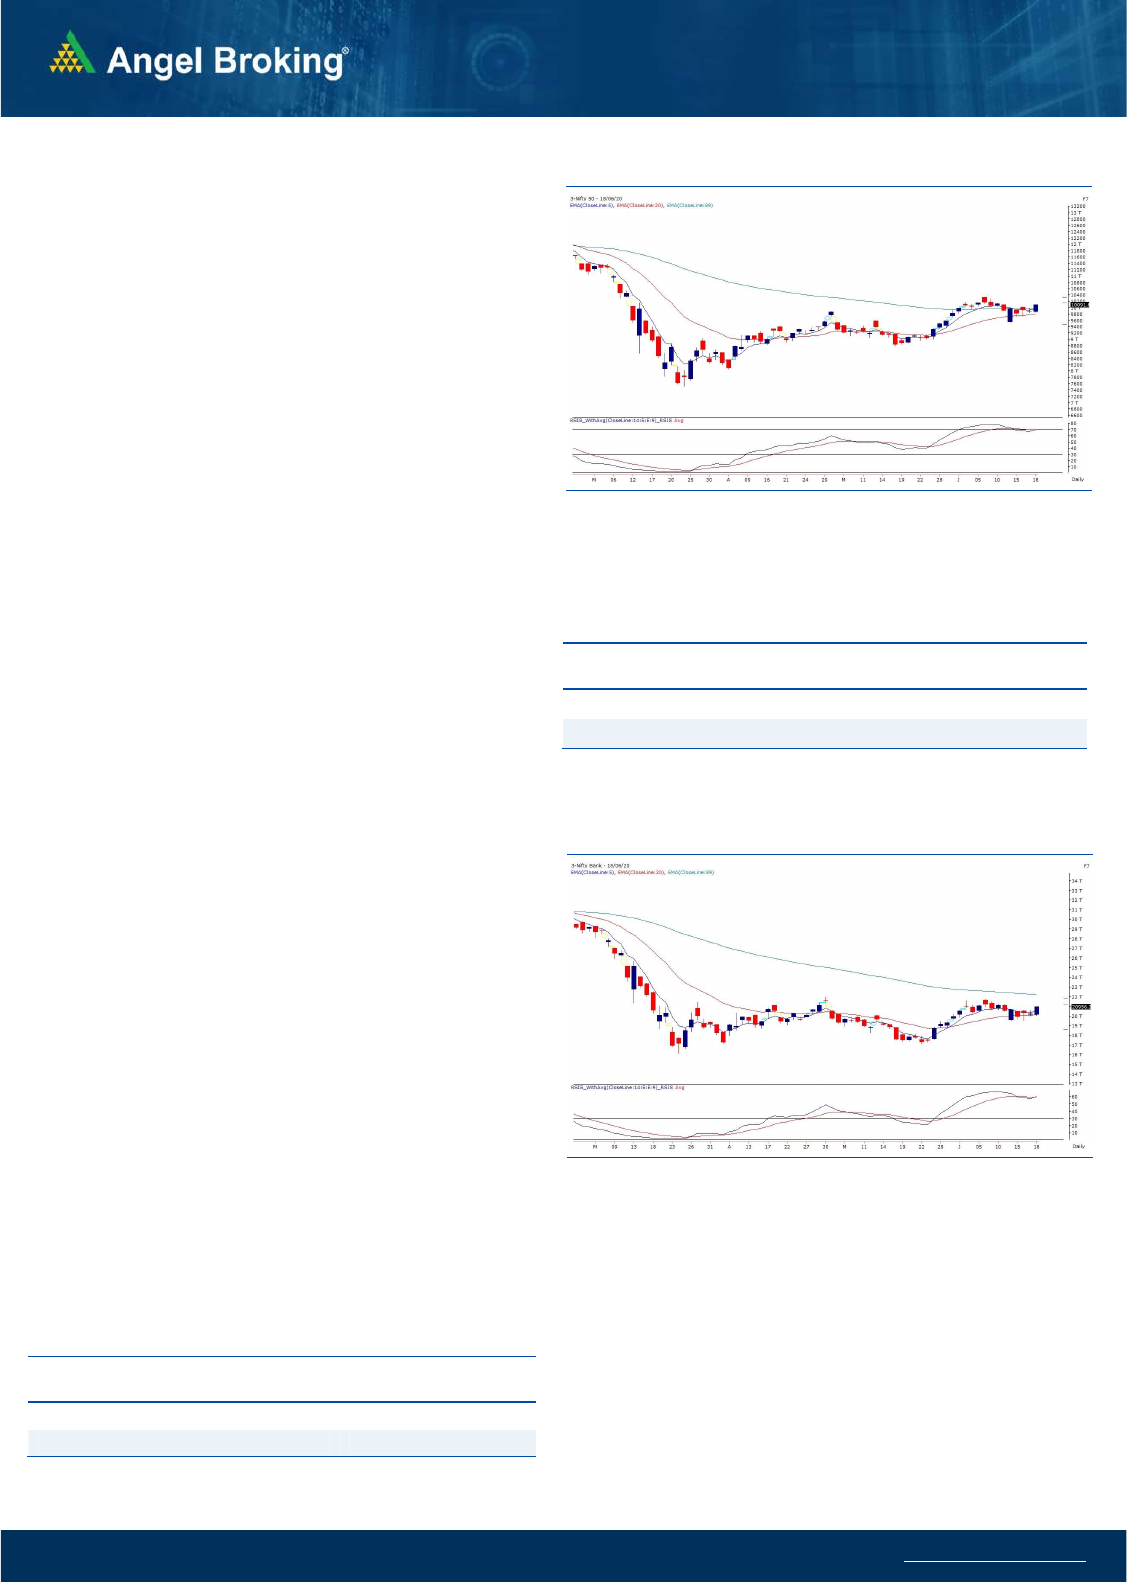
Exhibit 1: Nifty Daily Chart
Sensex (34208) / Nifty (10092)
Our markets were undergoing some stressful atmosphere ever
since the news came out of the scuffle at the India-China border
on Tuesday. Hence, we could see our markets struggling at higher
levels and were trading around the lower end of the consolidation
range. Yesterday morning, it was surprising to see that we started
on a flat note despite Global markets were trading strongly in red
and SGX Nifty too indicated a gap down opening below 9800.
Throughout the day, we maintained our positive posture and with
the help of strong surge in the latter half, the Nifty managed to
clock handsome gains over two percent.
If we refer to our yesterday’s commentary, despite we were
struggling, we remained hopeful and expected markets to make a
move in the upward direction. To add to our conviction, we
needed a strong close beyond 10000-10050 levels, which got
confirmed in the last hour surge. Since yesterday’s move was a
broad based one and is mainly driven by the financial stocks, we
consider this a healthy up move. Hence, we continue to remain
sanguine and expect the rally to extend towards 10150-10200
levels in today’s session.
Exhibit 2: Nifty Bank Daily Chart
On the flipside, 10050 followed by 10000 would now provide
decent support. Traders are advised to focus on individual stocks
especially from the broader market, who are providing better
trading opportunities.
Key Levels
Support 1 – 10050 Resistance 1 – 10150
Support 2 – 10000 Resistance 2 – 10200

www.angelbroking.com
Technical & Derivatives Report
June 19, 2020
Nifty Vs OI
9600
9700
9800
9900
10000
10100
10200
10300
10,000
10,500
11,000
11,500
12,000
12,500
6/1 6/2 6/3 6/4 6/5 6/8 6/9 6/106/116/126/156/166/16
(`000)
Openinterest Nifty
V
iew
s
Nifty started trading for the weekly expiry session on a
flat note around 9850. However, after trading in a
range for the major part witnessed strong buying in
the penultimate hour to end with gains of 2.13% at
10091.65.
FIIs were net buyers in the cash market segment to the
tune of Rs. 367 crores. In index futures, they bought
worth 172 crores with a decrease in open interest
indicating short covering in yesterday’s upmove
.
If we look at the options data of the coming week
which is the monthly expiry, open interest addition has
been seen in 9900-9800 put options which indicates
that the support has probably shifted higher from
9500 to 9800 now. Since there’s long build up seen in
futures segment, we expect the index to continue the
upmove towards 10300-10500 zone. Hence, traders
are advised to trade with a positive bias and use any
decline as a buying opportunity.
C
o
mme
n
t
s
The Nifty futures open interest has decreased by 2.73%
Bank Nifty futures open interest has increased by 13.56%
as market closed at 10091.65 levels.
The Nifty June future closed with a discount of 19.75
point against a discount of 26.6 point in last trading
session. The July series closed at a discount of 40 point.
The INDIA VIX has decreased from 33.35 to 31.46
At the same time, the PCR-OI of Nifty increased from 1.23
to 1.61.
Few of the liquid counters where we have seen high cost
of carry are JUSTDIAL, ADANIENT, ESCORTS, GMRINFRA
and BHEL.
OI Gainers
SCRIP OI
OI
CHG. (%)
PRICE
PRICE
CHG. (%)
MUTHOOTFIN 3771000 108.46 1175.85 15.82
BHEL 72494200 43.58 31.75 15.79
IGL 9043375 21.80 449.65 -5.35
MANAPPURAM 18606000 20.80 149.10 4.55
L&TFH 28984800 13.87 63.85 4.32
CUMMINSIND 1425300 13.17 369.65 -3.77
BATAINDIA 1415150 11.48 1314.70 -0.16
ZEEL 33112900 11.28 174.40 5.68
OI Losers
SCRIP OI
OI
CHG. (%)
PRICE
PRICE
CHG. (%)
IDEA 232988000 -10.04 9.75 -1.52
ESCORTS 3240600 -9.66 981.50 -0.93
AMARAJABAT 1340600 -6.94 679.40 1.08
CHOLAFIN 7240000 -6.58 178.00 5.46
SUNTV 4617000 -6.44 395.35 2.67
TATACHEM 2001800 -6.12 314.20 0.41
SBIN 125403000 -5.98 179.65 4.02
NMDC 27683100 -5.78 82.55 -3.11
Put-Call Ratio
SCRIP PCR-OI PCR-VOL
NIFTY 1.61 0.94
BANKNIFTY 1.48 0.69
RELIANCE 0.85 0.58
ICICIBANK 0.69 0.58
INFY 0.61 0.60
Historical Volatility
SCRIP HV
MUTHOOTFIN 67.21
BHEL 70.71
COALINDIA 47.02
BEL 61.69
BAJAJFINSV 70.35
www.angelbroking.com
Technical & Derivatives Report
June 19, 2020
Note: Above mentioned Bullish or Bearish Spreads in Nifty (June Series) are given as an information and not as a recommendation.
Nifty Spot =
10091.65
FII Statistics for June 18, 2020
Detail Buy Sell Net
Open Interest
Contracts
Value
(in Cr.)
Change
(%)
INDEX
FUTURES
5971.06
5798.96
172.10
116019
7550.54
(2.97)
INDEX
OPTIONS
479978.99
479241.58
737.41
744581
51490.59
(11.72)
STOCK
FUTURES
16363.27
15133.37
1229.90
1563475
85404.62
(0.39)
STOCK
OPTIONS
5089.24
5041.11
48.13
105758
5878.22
(1.05)
Total 507402.56
505215.02
2187.54
2529833
150323.97
(4.15)
Turnover on June 18, 2020
Instrument
No. of
Contracts
Turnover
( in Cr. )
Change
(%)
Index Futures 6,86,030 37008.24 -3.91
Index Options 6,26,34,944
32,23,002.16 112.46
Stock Futures 9,71,122 52562.33 8.07
Stock Options 11,97,919 71088.72 11.18
Total 6,54,90,015
33,83,661.45 102.85
Bull-Call Spreads
Action Strike Price Risk Reward BEP
Buy 10100 152.05
46.75 53.25 10146.75
Sell 10200 105.30
Buy 10100 152.05
82.40 117.60 10182.40
Sell 10300 69.65
Buy 10200 105.30
35.65 64.35 10235.65
Sell 10300 69.65
Bear-Put Spreads
Action Strike Price Risk Reward BEP
Buy 10100 180.20
41.55 58.45 10058.45
Sell 10000 138.65
Buy 10100 180.20
72.80 127.20 10027.20
Sell 9900 107.40
Buy 10000 138.65
31.25 68.75 9968.75
Sell 9900 107.40
Nifty Put-Call Analysis
,0
500,000
1000,000
1500,000
2000,000
2500,000
3000,000
3500,000
4000,000
9500 9600 9700 9800 9900 10000 10100 10200 10300 10400 10500 10600 10700 10800
Call Put

www.angelbroking.com
Technical & Derivatives Report
June 19, 2020
Daily Pivot Levels for Nifty Constituents
Scrips
S2
S1
PIVOT
R1
R2
ADANIPORTS
331
337
341
348
352
ASIANPAINT 1,574 1,586
1,599
1,611
1,624
AXISBANK
375
390
399
414
423
BAJAJ-AUTO 2,623 2,651
2,674
2,702
2,725
BAJFINANCE 2,312 2,419
2,480
2,587
2,649
BAJAJFINSV 4,839 5,133
5,316
5,611
5,793
BPCL
352
361
369
378
386
BHARTIARTL
549
555
564
570
579
INFRATEL
201
205
210
214
218
BRITANNIA 3,339 3,372
3,414
3,447
3,490
CIPLA
633
637
641
646
649
COALINDIA
124
131
135
142
147
DRREDDY 3,957 3,982
4,017
4,042
4,078
EICHERMOT 16,399
16,757
16,969
17,327
17,539
GAIL
94
96
97
99
100
GRASIM
569
583
593
608
618
HCLTECH
564
571
578
585
591
HDFCBANK
953
986
1,006
1,039
1,059
HDFC 1,756 1,806
1,837
1,888
1,919
HEROMOTOCO
2,325
2,345
2,362
2,383
2,400
HINDALCO
146
148
150
152
154
HINDUNILVR 2,037 2,051
2,068
2,082
2,099
ICICIBANK
330
341
348
359
365
IOC
83
84
85
86
86
INDUSINDBK
474
487
495
507
516
INFY
702
708
712
718
723
ITC
178
182
185
189
192
JSW STEEL
186
190
192
196
198
KOTAKBANK 1,199 1,251
1,281
1,333
1,362
LT
864
880
890
906
916
M&M
486
496
503
513
519
MARUTI 5,587 5,651
5,704
5,768
5,821
NESTLEIND 15,932
16,056
16,178
16,301
16,423
NTPC
88
90
92
95
97
ONGC
81
82
83
84
85
POWERGRID
157
161
164
168
171
RELIANCE 1,583 1,619
1,642
1,679
1,702
SHREECEM 21,169
21,518
21,758
22,107
22,347
SBIN
168
174
177
183
187
SUNPHARMA
480
482
485
488
491
TCS 2,007 2,022
2,041
2,056
2,075
TATAMOTORS
93
95
96
98
99
TATASTEEL
303
310
31
5
323
327
TECHM
527
531
536
540
545
TITAN
943
960
970
986
997
ULTRACEMCO 3,729 3,787
3,834
3,892
3,939
UPL
418
423
427
432
437
VEDANTA
100
103
106
109
111
WIPRO
213
215
217
220
222
ZEEL
162
168
172
178
182

www.angelbroking.com
Technical & Derivatives Report
June 19, 2020
*
Research Team Tel: 022 – 39357600 (Extn. 6844) Website: www.angelbroking.com
For Technical & Derivatives Queries E-mail: technicalresearch-cso@angelbroking.com
DISCLAIMER
Angel Broking Limited (hereinafter referred to as “Angel”) is a registered Member of National Stock Exchange of India Limited, Bombay
Stock Exchange Limited and Metropolitan Stock Exchange Limited. It is also registered as a Depository Participant with CDSL and
Portfolio Manager and Investment Adviser with SEBI. It also has registration with AMFI as a Mutual Fund Distributor. Angel Broking
Limited is a registered entity with SEBI for Research Analyst in terms of SEBI (Research Analyst) Regulations, 2014 vide registration
number INH000000164. Angel or its associates has not been debarred/ suspended by SEBI or any other regulatory authority for
accessing /dealing in securities Market. Angel or its associates/analyst has not received any compensation / managed or co-managed
public offering of securities of the company covered by Analyst during the past twelve months.
This document is solely for the personal information of the recipient, and must not be singularly used as the basis of any investment
decision. Nothing in this document should be construed as investment or financial advice. Each recipient of this document should make
such investigations as they deem necessary to arrive at an independent evaluation of an investment in the securities of the companies
referred to in this document (including the merits and risks involved), and should consult their own advisors to determine the merits
and risks of such an investment.
Reports based on technical and derivative analysis center on studying charts of a stock's price movement, outstanding positions and
trading volume, as opposed to focusing on a company's fundamentals and, as such, may not match with a report on a company's
fundamentals. Investors are advised to refer the Fundamental and Technical Research Reports available on our website to evaluate the
contrary view, if any.
The information in this document has been printed on the basis of publicly available information, internal data and other reliable
sources believed to be true, but we do not represent that it is accurate or complete and it should not be relied on as such, as this
document is for general guidance only. Angel Broking Limited or any of its affiliates/ group companies shall not be in any way
responsible for any loss or damage that may arise to any person from any inadvertent error in the information contained in this report.
Angel Broking Limited has not independently verified all the information contained within this document. Accordingly, we cannot
testify, nor make any representation or warranty, express or implied, to the accuracy, contents or data contained within this document.
While Angel Broking Limited endeavors to update on a reasonable basis the information discussed in this material, there may be
regulatory, compliance, or other reasons that prevent us from doing so.
This document is being supplied to you solely for your information, and its contents, information or data may not be reproduced,
redistributed or passed on, directly or indirectly.
Technical and Derivatives Team:
Sameet Chavan Chief Analyst - Technical & Derivatives sameet.chavan@angelbroking.com
Ruchit Jain Senior Analyst - Technical & Derivatives ruchit.jain@angelbroking.com
Rajesh Bhosale Technical Analyst rajesh.bhosle@angelbroking.com
Sneha Seth Derivatives Analyst sneha.seth@angelbroking.com