www.angelbroking.com
Technical & Derivatives Report
June 18, 2020
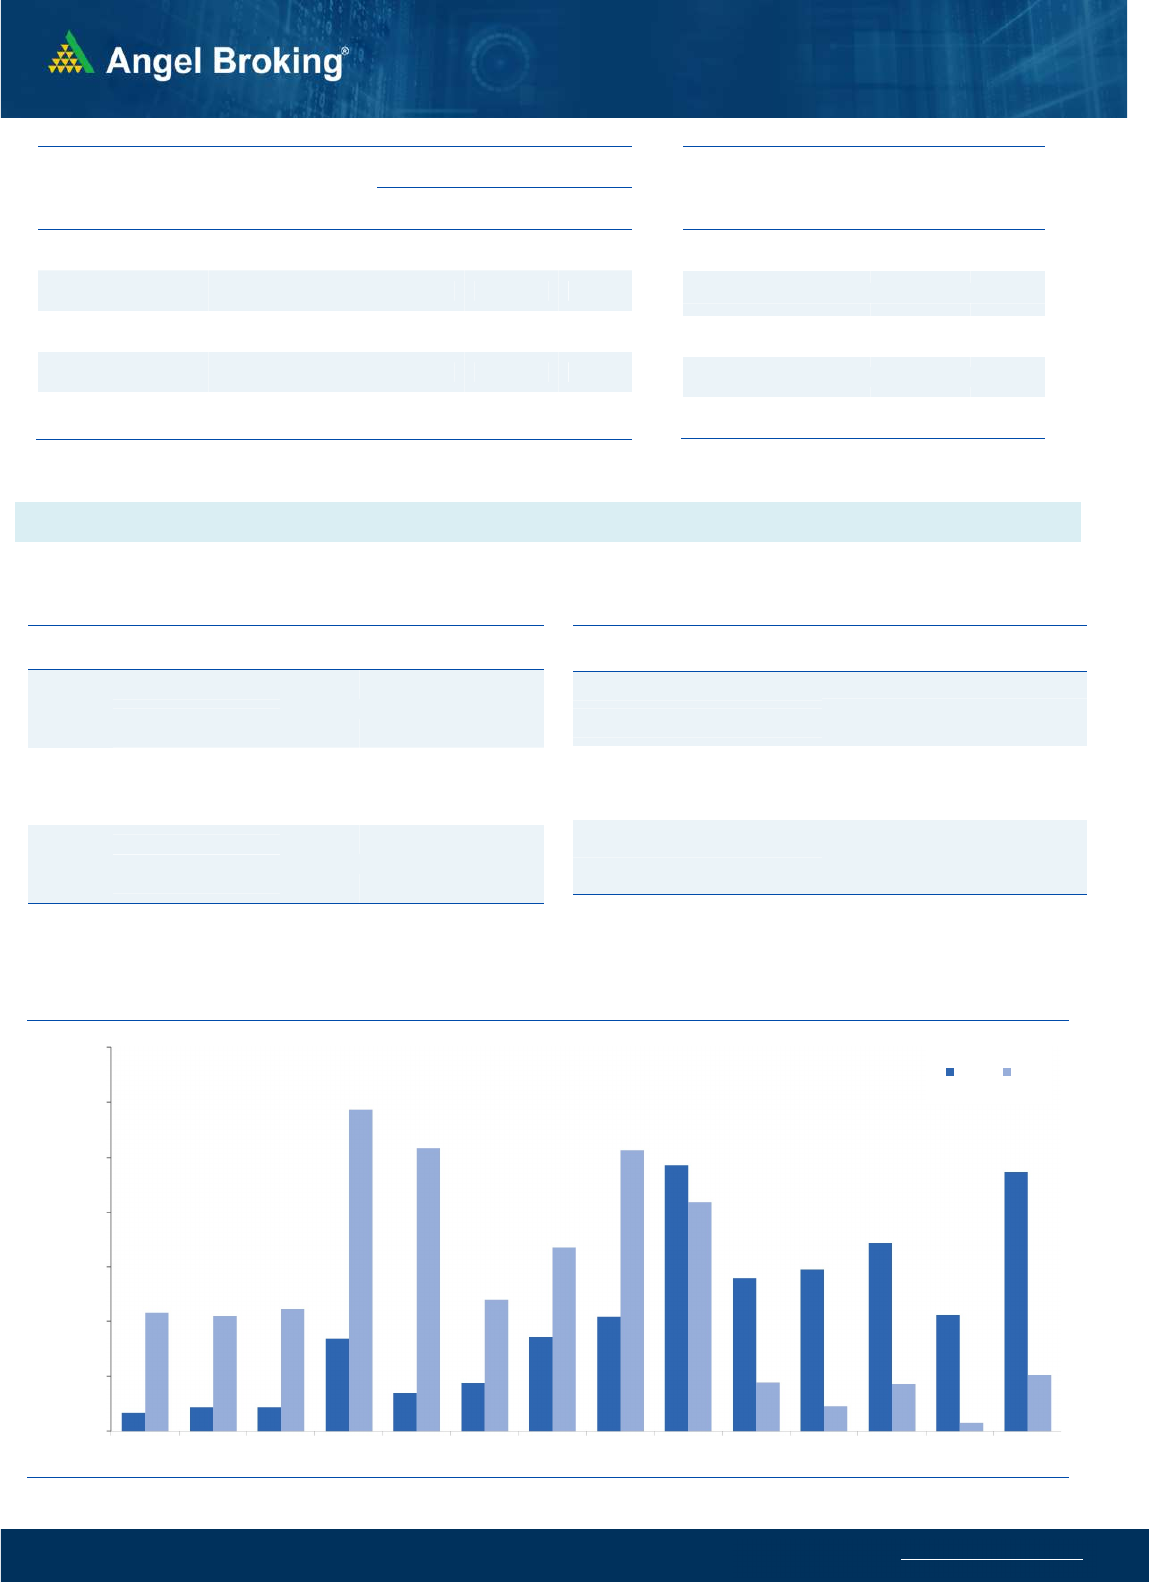
Nifty Bank Outlook - (20202)
The Bank NIfty index opened marginally negative in yesterday's
session and then oscillated within a range throughout the day to
end around 20200 with loss of about half a percent.
It was a day of consolidation and hence nothing much changed
on the charts with respect to the short term trend. As mentioned
earlier, the support for Bank NIfty is placed around 19500, its 200
SMA on the hourly charts. On the flipside, the
immediate resistance is around 20600-20750 and a move above
the same could then lead to an upmove. Within this range, traders
should look to trade with a stock specific approach.
Key Levels
Support 1 – 19700 Resistance 1 – 20600
Support 2 – 19500 Resistance 2 – 20750
Exhibit 1: Nifty Daily Chart
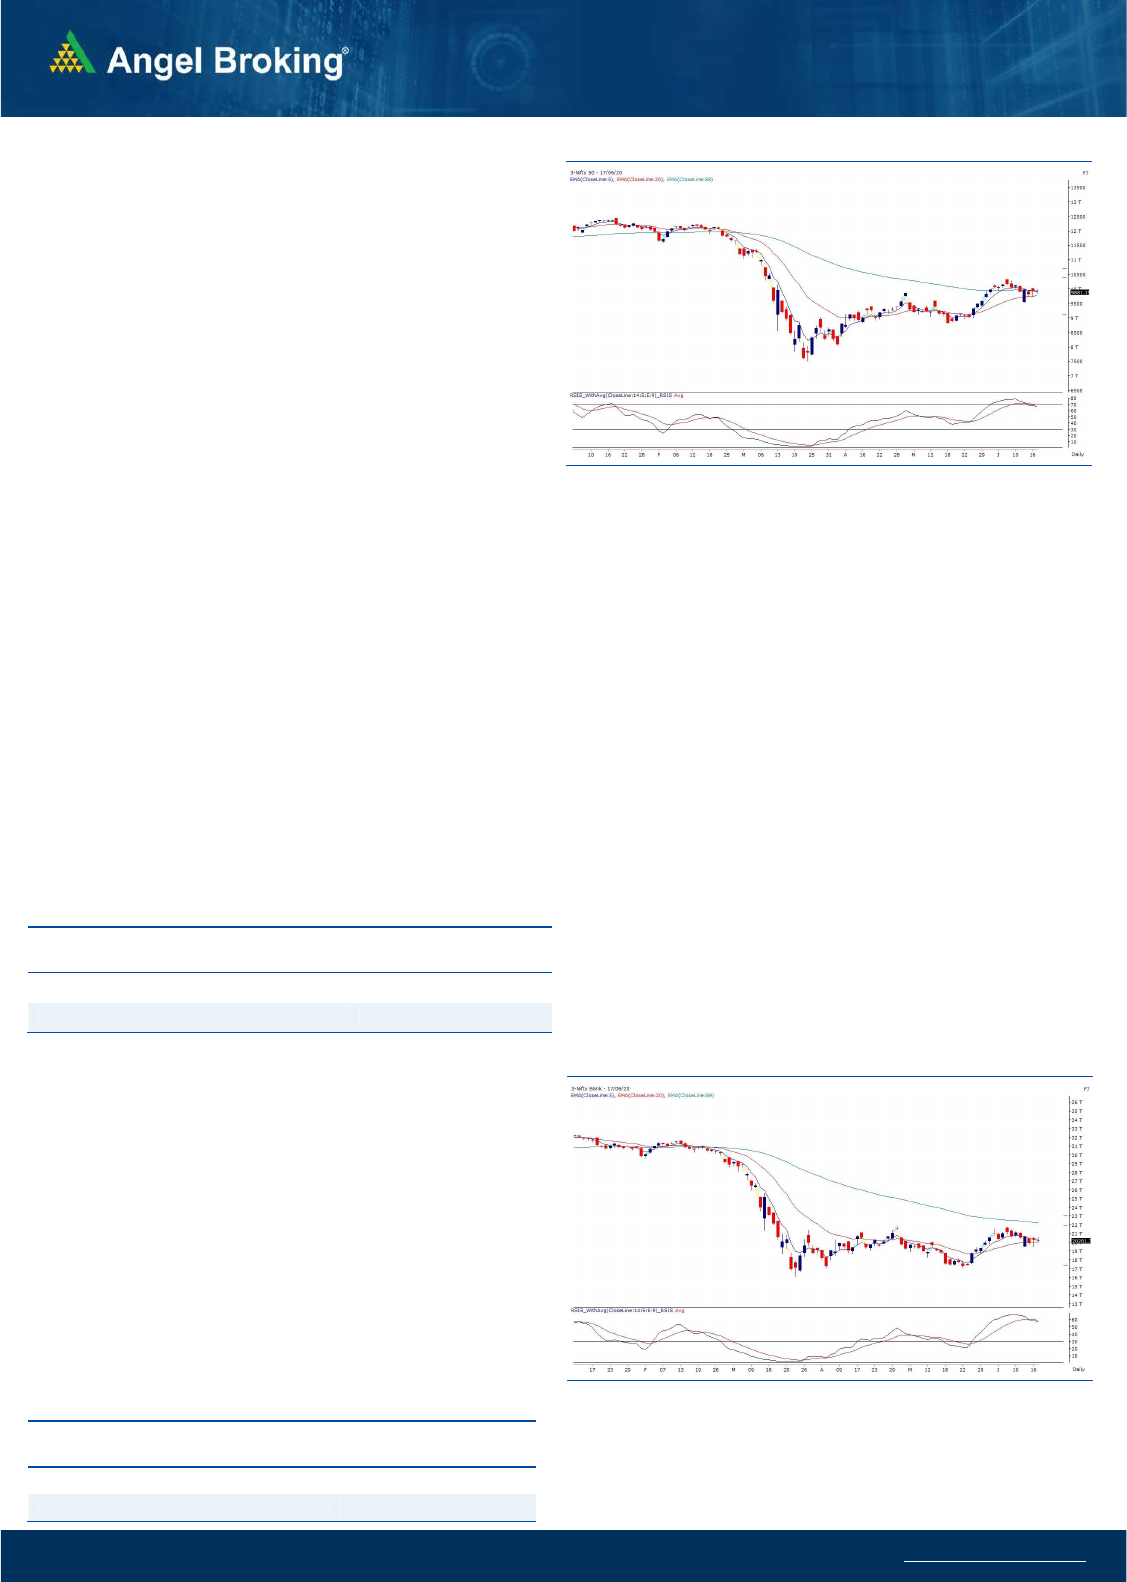
Sensex (33508) / Nifty (9881)
After Tuesday’s wild swings, our markets started slightly lower on
the back of sluggish negative cues. However, the initial decline
was immediately bought into and thereafter index slipped into a
consolidation mode. In the midst of this, index slowly and
gradually moved towards the 10000 mark. However, once again
we failed to sustain at higher levels and saw a decent dip in last
one hour of trade to conclude with nominal cut.
The entire world is already fighting with the pandemic since last
few months and we are obviously not spared with it. Somehow
market already seems to have discounted it and has seen some
smart recovery in last couple of months. But now, tensions at the
India-China border is keeping our market on it’s toes. This is
clearly getting reflected in prices, the way market is behaving since
last couple of days. Technically speaking, Nifty is struggling to
surpass the sturdy wall at 10000 and at the same time, 9800-9700
has become a key support zone. Any negative development on
the domestic as well as global front, will lead to a breakdown
below these levels. However until then, there is still a ray of hope
and a move beyond 10000 would strengthen the upside rally. Let
see how things pan out over the next few days.
Although we are still a bit hopeful, we advise traders to stay light
in the range of 10000-9700. A breakout in either direction would
trigger a trended move and accordingly one should then be
prepared with the next plan of action.
Key Levels
Support 1 – 9800 Resistance 1 – 10020
Support 2 – 9700 Resistance 2 – 10050
Exhibit 2: Nifty Bank Daily Chart

www.angelbroking.com
Technical & Derivatives Report
June 18, 2020
Nifty Vs OI
9600
9700
9800
9900
10000
10100
10200
10300
10,000
10,500
11,000
11,500
12,000
12,500
6/1 6/2 6/3 6/4 6/5 6/8 6/9 6/106/116/126/156/166/16
(`000)
Openinterest Nifty
V
ie
w
s
Yesterday, Nifty started on a marginal negative note
and then consolidated in a range. Nifty ended with loss
of 0.33% at 9881.15.
FIIs were net sellers in the cash market segment to the
tune of Rs. 487 crores. In index futures, they bought
worth 266 crores with a decrease in open interest
indicating short position covered in yesterday’s session.
The indices oscillated within a range ahead of the
weekly F&O expiry. FII's were net sellers in the cash
segment while they covered some of their short
positions in index futures segment. In the options
segment, 10000 call option has seen good amount of
interest addition in last couple of sessions indicating a
resistance at this level. On the flip side, 9500 is seen as
the immediate support as per options data. Traders are
advised to avoid aggressive longs until the index
surpass the resistance of 10000.
C
o
mme
n
t
s
The Nifty futures open interest has increased by 1.04%
Bank Nifty futures open interest has increased by 8.80%
as market closed at 9881.15 levels.
The Nifty June future closed with a discount of 26.6 point
against a discount of 16.15 point in last trading session.
The July series closed at a discount of 41.25 point.
The INDIA VIX has increased from 32.96 to 33.35
At the same time, the PCR-OI of Nifty decreased from
1.28 to 1.23.
Few of the liquid counters where we have seen high cost
of carry are IDEA, IDFCFIRSTB, BHEL, JINDALSTEL and
KOTAKBANK.
OI Gainers
SCRIP OI
OI
CHG. (%)
PRICE
PRICE
CHG. (%)
ESCORTS 3587100 44.04 999.80 4.18
INFRATEL 12438000 20.26 206.25 -4.41
CHOLAFIN 7750000 12.56 168.20 7.88
PIDILITIND 3219500 11.77 1432.15 0.14
PNB 77200500 11.32 33.15 0.15
SRTRANSFIN 2907300 10.52 648.05 -0.94
EXIDEIND 9052900 10.10 147.95 -1.96
HINDPETRO 18383100 8.97 214.10 2.19
OI Losers
SCRIP OI
OI
CHG. (%)
PRICE
PRICE
CHG. (%)
RECLTD 17898000 -8.89 106.05 -1.17
SBILIFE 5458500 -4.96 772.05 1.07
ADANIPOWER 33050000 -4.89 36.80 0.41
UJJIVAN 3051000 -4.45 198.05 0.28
JINDALSTEL 19215000 -4.12 140.00 -2.40
JUBLFOOD 2735500 -3.76 1660.25 -1.66
CADILAHC 7220400 -3.50 364.50 1.15
SUNTV 4935000 -3.45 385.55 2.75
Put-Call Ratio
SCRIP PCR-OI PCR-VOL
NIFTY 1.23 0.84
BANKNIFTY 0.94 0.88
RELIANCE 0.71 0.56
ICICIBANK 0.65 0.66
INFY 0.53 0.48
Historical Volatility
SCRIP HV
CHOLAFIN 88.31
MARUTI 57.58
BHARTIARTL 52.35
MOTHERSUMI 86.79
ESCORTS 68.46
www.angelbroking.com
Technical & Derivatives Report
June 18, 2020
Note: Above mentioned Bullish or Bearish Spreads in Nifty (June Series) are given as an information and not as a recommendation.
Nifty Spot =
9881.15
FII Statistics for June 17, 2020
Detail Buy Sell Net
Open Interest
Contracts
Value
(in Cr.)
Change
(%)
INDEX
FUTURES
6624.02
6358.00
266.02
119576
7747.65
(3.43)
INDEX
OPTIONS
333697.70
334616.91
(919.21) 843438
55968.96
1.79
STOCK
FUTURES
15245.78
14693.28
552.50
1569566
83928.79
1.30
STOCK
OPTIONS
4481.41
4451.77
29.64
106875
5876.38
0.30
Total 360048.91
360119.96
(71.05) 2639455
153521.78
1.19
Turnover on June 17, 2020
Instrument
No. of
Contracts
Turnover
( in Cr. )
Change
(%)
Index Futures 7,28,735 38512.95 -20.50
Index Options 2,77,52,585
15,16,961.33 0.45
Stock Futures 9,22,206 48638.71 -13.12
Stock Options 11,02,924 63941.67 -17.60
Total 3,05,06,450
16,68,054.66 -1.43
Bull-Call Spreads
Action Strike Price Risk Reward BEP
Buy 9900 177.30
47.10 52.90 9947.10
Sell 10000 130.20
Buy 9900 177.30
84.30 115.70 9984.30
Sell 10100 93.00
Buy 10000 130.20
37.20 62.80 10037.20
Sell 10100 93.00
Bear-Put Spreads
Action Strike Price Risk Reward BEP
Buy 9900 223.15
44.50 55.50 9855.50
Sell 9800 178.65
Buy 9900 223.15
79.00 121.00 9821.00
Sell 9700 144.15
Buy 9800 178.65
34.50 65.50 9765.50
Sell 9700 144.15
Nifty Put-Call Analysis
,0
500,000
1000,000
1500,000
2000,000
2500,000
3000,000
3500,000
9200 9300 9400 9500 9600 9700 9800 9900 10000 10100 10200 10300 10400 10500
Call Put

www.angelbroking.com
Technical & Derivatives Report
June 18, 2020
Daily Pivot Levels for Nifty Constituents
Scrips
S2
S1
PIVOT
R1
R2
ADANIPORTS
333
337
342
346
351
ASIANPAINT 1,571 1,583
1,603
1,615
1,635
AXISBANK
365
377
388
400
410
BAJAJ-AUTO 2,637 2,663
2,700
2,727
2,764
BAJFINANCE 2,291 2,344
2,384
2,437
2,477
BAJAJFINSV 4,936 4,987
5,058
5,109
5,180
BPCL
353
359
363
368
372
BHARTIARTL
532
548
557
572
581
INFRATEL
198
202
209
214
221
BRITANNIA 3,317 3,359
3,397
3,439
3,477
CIPLA
631
636
640
644
649
COALINDIA
126
128
131
133
136
DRREDDY 3,929 3,957
4,000
4,028
4,071
EICHERMOT 16,359
16,578
16,769
16,988
17,179
GAIL
94
95
97
97
99
GRASIM
571
577
587
594
604
HCLTECH
568
572
577
581
586
HDFCBANK
958
969
984
994
1,009
HDFC 1,748 1,771
1,809
1,833
1,870
HEROMOTOCO
2,316
2,340
2,365
2,389
2,414
HINDALCO
144
146
149
151
154
HINDUNILVR 2,043 2,061
2,080
2,097
2,117
ICICIBANK
328
335
343
350
358
IOC
83
84
85
86
87
INDUSINDBK
453
472
487
506
521
INFY
692
698
704
710
716
ITC
178
180
182
184
187
JSW STEEL
182
187
191
196
199
KOTAKBANK 1,207 1,225
1,255
1,274
1,303
LT
870
877
889
896
907
M&M
486
492
498
504
511
MARUTI 5,293 5,510
5,662
5,878
6,030
NESTLEIND 15,926
16,062
16,251
16,387
16,576
NTPC
90
91
92
93
94
ONGC
83
83
84
85
86
POWERGRID
156
158
160
161
163
RELIANCE 1,584 1,600
1,618
1,633
1,651
SHREECEM 21,178
21,407
21,743
21,972
22,308
SBIN
166
169
173
176
180
SUNPHARMA
474
480
485
491
495
TCS 2,012 2,030
2,044
2,062
2,077
TATAMOTORS
90
93
95
97
99
TATASTEEL
300
304
309
314
319
TECHM
520
528
536
544
553
TITAN
933
948
961
975
988
ULTRACEMCO 3,656 3,732
3,789
3,865
3,922
UPL
403
412
418
427
433
VEDANTA
100
101
103
104
105
WIPRO
208
213
216
221
224
ZEEL
158
161
165
169
173

www.angelbroking.com
Technical & Derivatives Report
June 18, 2020
*
Research Team Tel: 022 – 39357600 (Extn. 6844) Website: www.angelbroking.com
For Technical & Derivatives Queries E-mail: technicalresearch-cso@angelbroking.com
DISCLAIMER
Angel Broking Limited (hereinafter referred to as “Angel”) is a registered Member of National Stock Exchange of India Limited, Bombay
Stock Exchange Limited and Metropolitan Stock Exchange Limited. It is also registered as a Depository Participant with CDSL and
Portfolio Manager and Investment Adviser with SEBI. It also has registration with AMFI as a Mutual Fund Distributor. Angel Broking
Limited is a registered entity with SEBI for Research Analyst in terms of SEBI (Research Analyst) Regulations, 2014 vide registration
number INH000000164. Angel or its associates has not been debarred/ suspended by SEBI or any other regulatory authority for
accessing /dealing in securities Market. Angel or its associates/analyst has not received any compensation / managed or co-managed
public offering of securities of the company covered by Analyst during the past twelve months.
This document is solely for the personal information of the recipient, and must not be singularly used as the basis of any investment
decision. Nothing in this document should be construed as investment or financial advice. Each recipient of this document should make
such investigations as they deem necessary to arrive at an independent evaluation of an investment in the securities of the companies
referred to in this document (including the merits and risks involved), and should consult their own advisors to determine the merits
and risks of such an investment.
Reports based on technical and derivative analysis center on studying charts of a stock's price movement, outstanding positions and
trading volume, as opposed to focusing on a company's fundamentals and, as such, may not match with a report on a company's
fundamentals. Investors are advised to refer the Fundamental and Technical Research Reports available on our website to evaluate the
contrary view, if any.
The information in this document has been printed on the basis of publicly available information, internal data and other reliable
sources believed to be true, but we do not represent that it is accurate or complete and it should not be relied on as such, as this
document is for general guidance only. Angel Broking Limited or any of its affiliates/ group companies shall not be in any way
responsible for any loss or damage that may arise to any person from any inadvertent error in the information contained in this report.
Angel Broking Limited has not independently verified all the information contained within this document. Accordingly, we cannot
testify, nor make any representation or warranty, express or implied, to the accuracy, contents or data contained within this document.
While Angel Broking Limited endeavors to update on a reasonable basis the information discussed in this material, there may be
regulatory, compliance, or other reasons that prevent us from doing so.
This document is being supplied to you solely for your information, and its contents, information or data may not be reproduced,
redistributed or passed on, directly or indirectly.
Technical and Derivatives Team:
Sameet Chavan Chief Analyst - Technical & Derivatives sameet.chavan@angelbroking.com
Ruchit Jain Senior Analyst - Technical & Derivatives ruchit.jain@angelbroking.com
Rajesh Bhosale Technical Analyst rajesh.bhosle@angelbroking.com
Sneha Seth Derivatives Analyst sneha.seth@angelbroking.com