www.angelbroking.com
January 18, 2021
Technical & Derivatives Report
Nifty
Bank Out
look
-
(
32247)
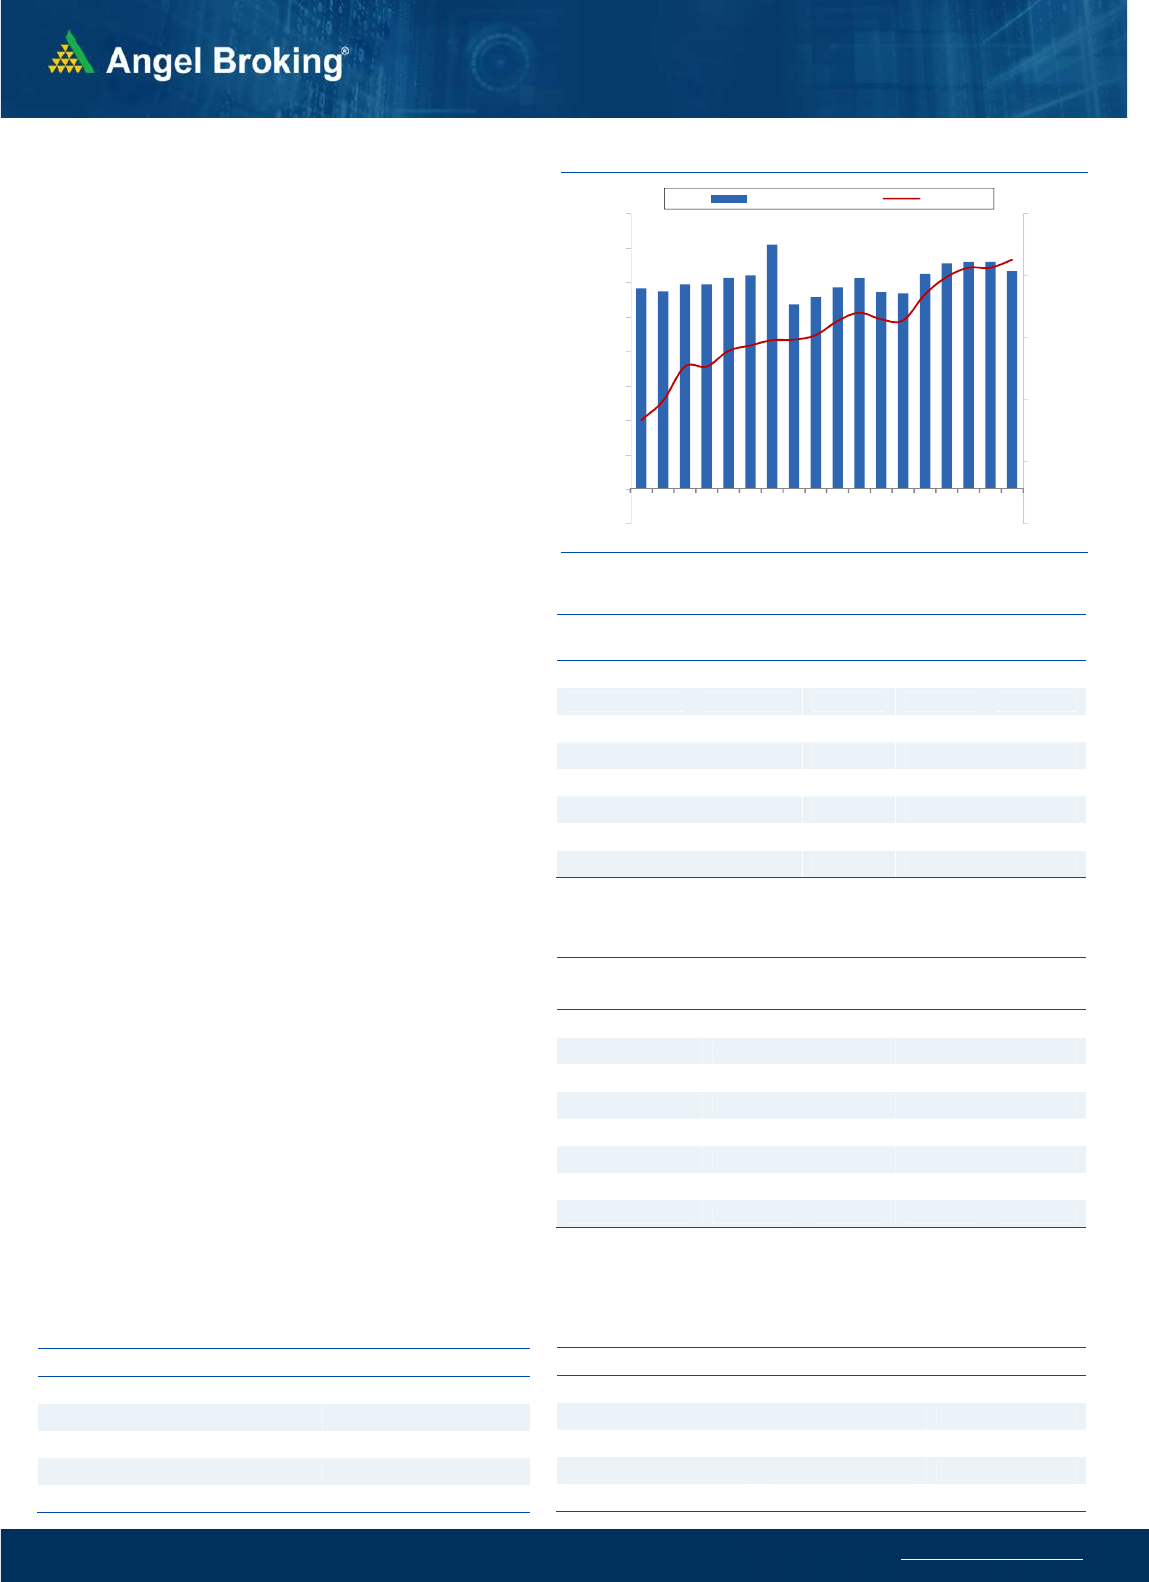
On Friday, Bank Nifty started on a negative note and from the
word go it started to moved lower. During the day it tested levels
around 32000 however some bounce in the last hour resulted
prices to erase some loss and eventually end with loss of 0.84%
at 32247.
During the last week, we mentioned resistance for Bank Index
around the all time high levels around 32600 levels and in spite
prices slightly breaking above it we did not witnessed follow up
buying. Infact we witnessed profit booking on Friday, going
ahead we sense the lackluster move may continue or we may
even see price wise correction as long we don't see prices
breaking above 32600 - 32700 on a sustained basis. On the flip
side, immediate support is now placed around 32000 - 31750
levels. Traders are advised to stay light and avoid aggressive
bets.
Key Levels
Support 1 – 32000 Resistance 1 – 32600
Support 2 – 31750 Resistance 2 – 32700
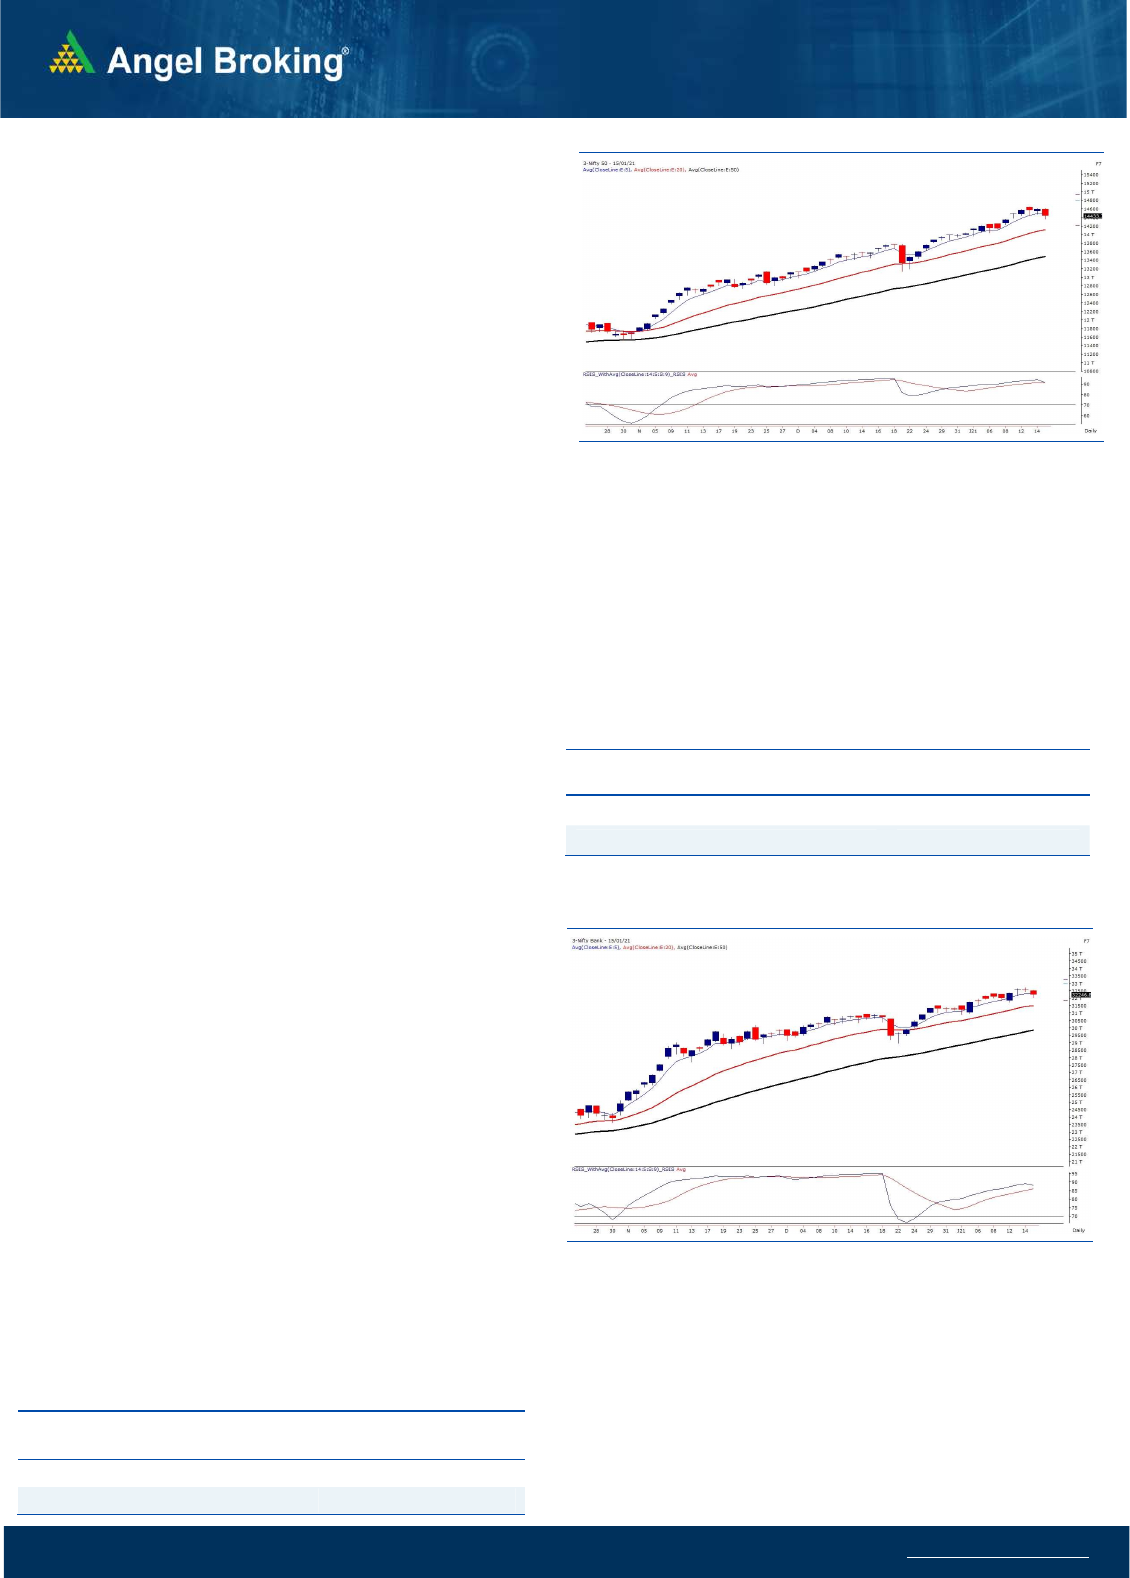
Exhibit 1: Nifty Daily Chart
Se
nsex
(
49035)
/ Nifty
(
14434
)
Second week of the new calendar year started with a good bump
up at fresh record high tad below the 14500 mark on Monday. In
the initial hour, we witnessed a small bout of correction; but similar
to recent trend, the intraday decline was bought into and the index
thereafter once again resumed its upward trajectory. The similar
price movement was continued for following three sessions.
However, on Friday, there was some sustained profit booking seen
to conclude the week tad below the Monday’s opening point.
The bulls are continuing with their strong hold on the market and
barring single day of sharp correction last month, the relentless
rally resumed to clock fresh record highs day by day. In our intra-
week commentary, we had mentioned how 2.30 factor played out
well since last few days. There was a typical pattern when we see
some price decline in the first half and buying emerges in the latter
half to hit new record highs. But this winning streak finally got
snapped on Friday when market corrected further after 2-2.30.
Although it’s just a one day activity and still no major damage
done, we expect 14650 to act as an immediate resistance now. On
the daily chart, Nifty closed below 5-day EMA for the first time in
the recent past, which is a first sign of weakness. Hence, in this
week, the extension of profit booking cannot be ruled out. The
moment we see Nifty sliding below 14380, we expect the Nifty to
slide towards 14250-14100 levels.
In fact, stock specific the fatigue was seen in so many counters
from Wednesday itself. The major banking index is at its previous
record highs and the Nifty Midcap 50 index, which is at crucial
Fibonacci ratios, may provide this much awaited corrective move.
Let see how things pan out in the early part of this week. Since the
overall trend has been strongly bullish, even if the correction
comes, one needs to go one at a time rather than projecting bigger
downside targets. Traders are advised to stay light and avoid
aggressive leveraged positions.
Key Levels
Support 1 – 14380 Resistance 1 – 14600
Support 2 – 14250 Resistance2 – 14650
Exhibit 2: Nifty Bank Daily Chart
www.angelbroking.com
Technical & Derivatives Report
January 18, 2021
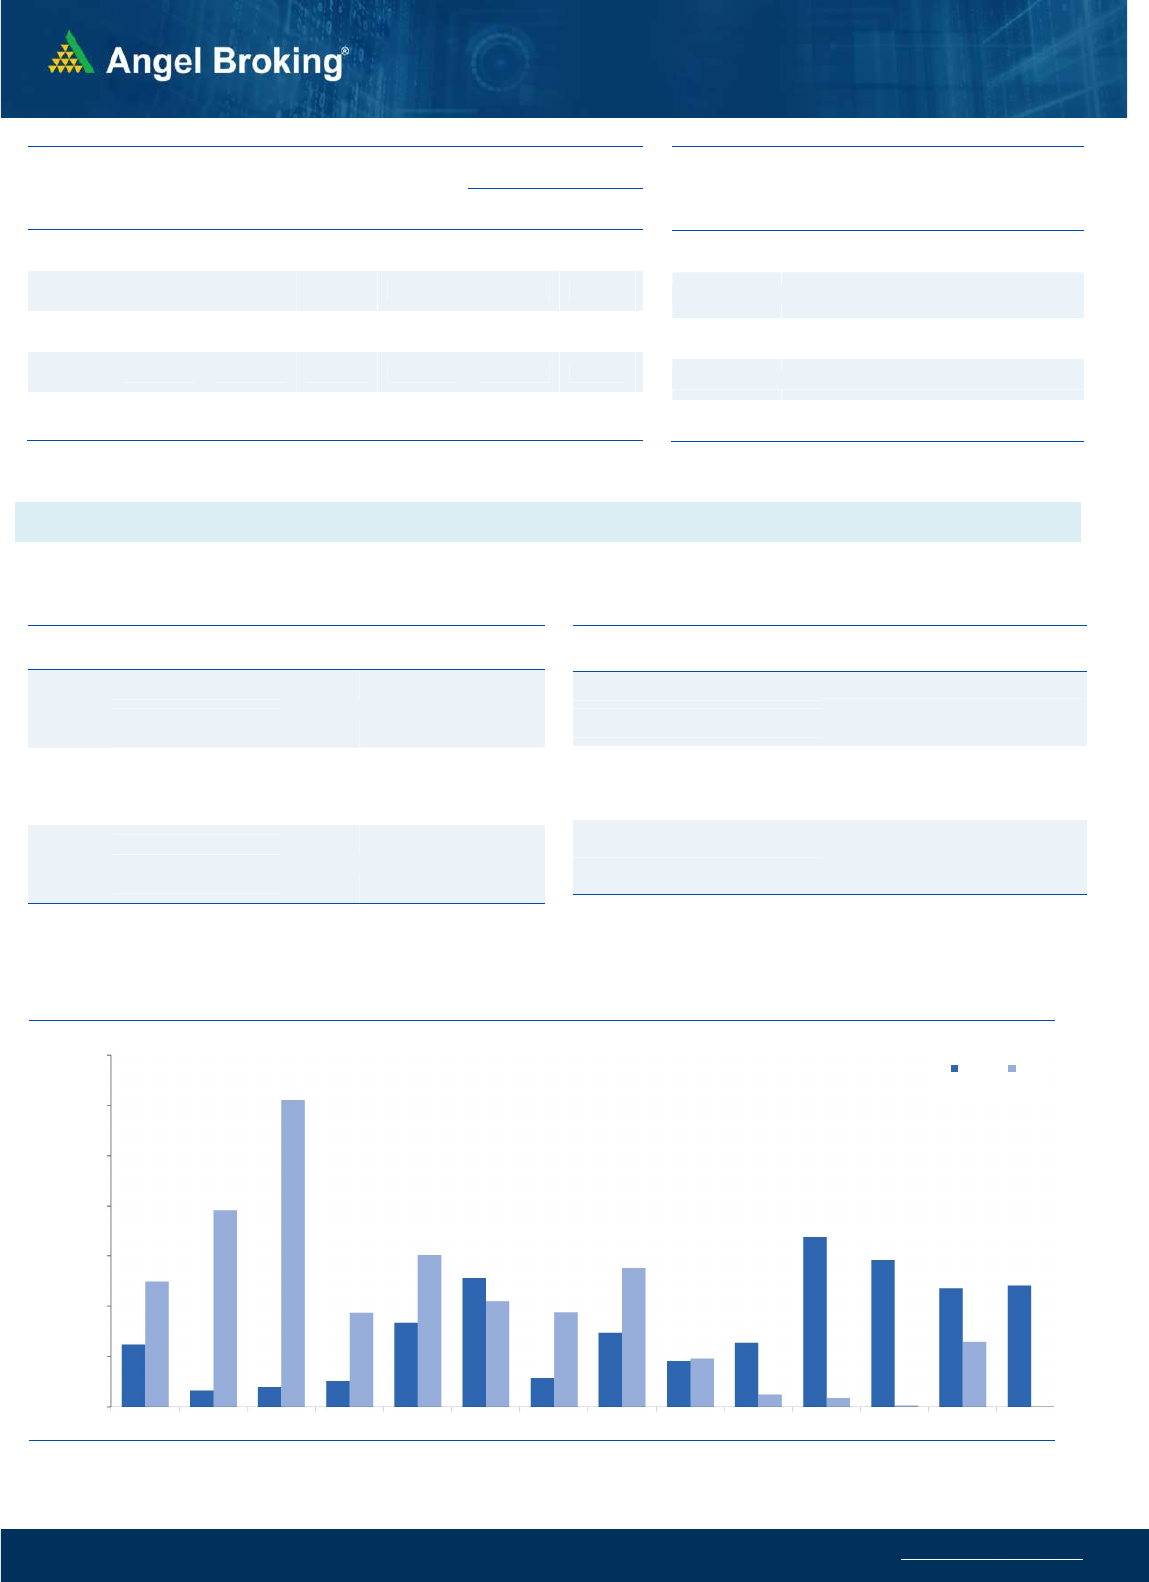
Nifty Vs OI
12500
13000
13500
14000
14500
15000
,0
2,000
4,000
6,000
8,000
10,000
12,000
14,000
16,000
18,000
12/21 12/24 12/28 12/30 1/1 1/5 1/7 1/11 1/13
(`000)
Openinterest Nifty
View
We began the week on a cheerful note and saw follow-up
buying to extend the up move beyond 14650 mark.
Around this levels, we found some parameters like PCR-OI
and FIIs ‘Long short Ratio’ hinting market in the
overbought zone. As anticipated, we witnessed decent
profit booking at the higher level which led weekly closing
below 14450 mark.
FIIs were net buyers in the cash segment to the tune of
Rs. 971 crore. In index future segment, they sold worth Rs.
1063 crores with decent rise in open interest indicating
short formation in Friday’s session.
Last week, we saw mixed activity in terms of open
interest in index futures segment. The PCR-OI surged to
1.80 on Tuesday, which clearly suggested market was
overbought. From the next trading sessions, strong
writing was observed in 14600-14700 call options. On
Friday, we also saw good amount of writing in 14500
strikes. In case of puts, hardly any meaningful build-up
was seen during the week. The Volatility index surged
more than 16% last week, which is certainly not good
for Bull’s. Considering the overall development seen in
F&O space, we expect some follow-up selling in the
coming week as well. Hence, traders are advised
lightening up their longs and prefer buying slightly
OTM puts in case of any pullback around 14500-14550
.
C
o
mme
n
t
s
The Nifty futures open interest has decreased by 2.59%
Bank Nifty futures open interest has increased by 4.35%
as market closed at 14433.70 levels.
The Nifty January future closed with a premium of 24.80
point against a premium of 32.50 point in last trading
session. The February series closed at a premium of
59.60 point.
The INDIA VIX increased from 23.02 to 24.10.
At the same time, the PCR-OI of Nifty decreased from
1.47 to 1.19.
Few of the liquid counters where we have seen high cost
of carry are IDEA, MRF, APOLLOTYRE, HINDPETRO,
NMDC and LALPATHLAB.
OI Gainers
SCRIP OI
OI
CHG. (%)
PRICE
PRICE
CHG. (%)
SAIL 179322000 121.34 70.15 4.37
HDFCAMC 366000 24.15 3244.30 -2.29
CADILAHC 11708400 11.57 487.80 -3.45
L&TFH 33465600 11.38 105.25 -2.08
ICICIPRULI 4726500 9.41 499.70 -1.89
VOLTAS 2263000 9.27 887.55 -2.48
APOLLOTYRE 13175000 9.15 183.30 -3.58
HINDALCO 24944300 9.12 253.35 -2.79
OI Losers
SCRIP OI
OI
CHG. (%)
PRICE
PRICE
CHG. (%)
GAIL 31073400 -13.89 138.50 -3.98
UPL 16896100 -9.07 522.55 2.42
RECLTD 13962000 -7.62 145.40 1.04
AARTIIND 399075 -7.31 1256.50 -0.94
RAMCOCEM 1394000 -7.08 822.45 -2.07
BHEL 117747000 -6.38 39.40 -2.24
BANKBARODA 63121500 -5.67 75.15 -1.25
GODREJCP 4141000 -5.61 780.10 -0.17
Put-Call Ratio
SCRIP PCR-OI PCR-VOL
NIFTY 1.19 1.02
BANKNIFTY 0.88 1.12
RELIANCE 0.49 0.47
ICICIBANK 0.55 0.47
INFY 0.36 0.37
Historical Volatility
SCRIP HV
TECHM 44.48
TATAMOTORS 68.40
IDEA 121.80
HCLTECH 44.14
WIPRO 43.03
www.angelbroking.com
Technical & Derivatives Report
January 18, 2021
Note: Above mentioned Bullish or Bearish Spreads in Nifty (January Series) are given as an information and not as a recommendation.
Nifty Spot =
14433.70
FII Statistics for January 15, 2020
Detail Buy
Net Contracts
Open Interest
Sell
Value
(in Cr.)
Change
INDEX
FUTURES
3779.34 4842.66 (1063.32) 124590 12557.91 2.19
INDEX
OPTIONS
293136.97 292519.75 617.22
836448 82997.52 18.98
STOCK
FUTURES
14230.07 15162.14 (932.07) 1226596 101767.48 0.14
STOCK
OPTIONS
10901.01 11165.22 (264.21) 182548 15194.96 6.42
Total 322047.39
323689.77
(1642.38) 2370182
212517.87
6.70
Turnover on January 15, 2020
Instrume
nt
No. of
Contracts
Turnover
( in Cr. )
Change
(%)
Index Futures 4,11,549 38891.62 42.87
Index Options 2,09,97,097
19,72,045.30 29.52
Stock Futures 9,20,211 82647.95 13.03
Stock Options 19,55,065 1,82,212.06 21.47
Total 2,42,83,922
22,75,796.93 28.36
Bull-Call Spreads
Action Strike Price Risk Reward BEP
Buy 14500 191.60
50.20 49.80 14550.20
Sell 14600 141.40
Buy 14500 191.60
89.65 110.35 14589.65
Sell 14700 101.95
Buy 14600 141.40
39.45 60.55 14639.45
Sell 14700 101.95
Bear-Put Spreads
Action Strike Price Risk Reward BEP
Buy 14400 84.35
16.00 84.00 14384.00
Sell 14300 68.35
Buy 14400 84.35
29.10 170.90 14370.90
Sell 14200 55.25
Buy 14300 68.35
13.10 86.90 14286.90
Sell 14200 55.25
Nifty Put-Call Analysis
,0
500,000
1000,000
1500,000
2000,000
2500,000
3000,000
3500,000
13500
13600
13700
13800
13900
14000
14100
14200
14300
14400
14500
14600
14700
14800
Call Put

www.angelbroking.com
Technical & Derivatives Report
January 18, 2021
Da
ily
Pivot Level
s for
Nifty Constituents
Scrips
S2
S1
PIVOT
R1
R2
ADANIPORTS
514
521
531
538
548
ASIANPAINT 2,530 2,560
2,611
2,642
2,692
AXISBANK
662
669
676
682
689
BAJAJ-AUTO 3,499 3,540
3,581
3,622
3,663
BAJFINANCE 4,800 4,842
4,884
4,926
4,969
BAJAJFINSV 8,475 8,555
8,691
8,772
8,907
BPCL
400
407
418
426
437
BHARTIARTL
586
594
602
611
619
BRITANNIA 3,508 3,558
3,622
3,672
3,736
CIPLA
806
815
830
839
854
COALINDIA
139
141
144
146
150
DIVISLAB 3,550 3,598
3,680
3,727
3,810
DRREDDY 5,122 5,167
5,241
5,287
5,361
EICHERMOT 2,804 2,831
2,866
2,893
2,928
GAIL
131
135
140
144
150
GRASIM
987
1,010
1,025
1,048
1,062
HCLTECH
940
965
1,009
1,034
1,078
HDFCBANK 1,434 1,451
1,461
1,477
1,488
HDFCLIFE
693
699
708
714
723
HDFC 2,573 2,603
2,646
2,676
2,718
HEROMOTOCO 3,119 3,161
3,216
3,258
3,313
HINDALCO
244
249
256
261
268
HINDUNILVR 2,303 2,327
2,367
2,391
2,431
ICICIBANK
536
539
545
549
555
IOC
99
100
102
103
105
INDUSINDBK
938
952
967
981
997
INFY 1,325 1,335
1,350
1,360
1,374
ITC
209
213
216
221
223
JSW STEEL
385
389
396
401
407
KOTAKBANK 1,824 1,844
1,874
1,894
1,924
LT 1,322 1,338
1,361
1,377
1,401
M&M
802
811
824
833
847
MARUTI 7,862 7,943
8,081
8,163
8,301
NESTLEIND 17,512
17,673
17,961
18,122
18,410
NTPC
98
99
101
103
105
ONGC
97
99
103
105
108
POWERGRID
201
202
204
205
207
RELIANCE 1,890 1,914
1,944
1,967
1,998
SBILIFE
888
899
914
926
941
SHREECEM 23,859
24,136
24,490
24,768
25,122
SBIN
296
300
305
309
315
SUNPHARMA
588
596
606
615
625
TCS 3,175 3,204
3,239
3,268
3,303
TATAMOTORS
234
247
256
269
278
TATASTEEL
685
695
708
719
732
TECHM
964
986
1,024
1,046
1,084
TITAN 1,448 1,463
1,486
1,500
1,524
ULTRACEMCO 5,281 5,366
5,512
5,597
5,743
UPL
504
513
521
530
537
WIPRO
422
430
445
453
468

www.angelbroking.com
Technical & Derivatives Report
January 18, 2021
*
Research Team Tel: 022 – 39357600 (Extn. 6844) Website: www.angelbroking.com
For Technical Queries E-mail: technicalresearch-cso@angelbroking.com
DISCLAIMER
Angel Broking Limited (hereinafter referred to as “Angel”) is a registered Member of National Stock Exchange of India Limited,
Bombay Stock Exchange Limited and Metropolitan Stock Exchange Limited. It is also registered as a Depository Participant with CDSL
and Portfolio Manager and Investment Adviser with SEBI. It also has registration with AMFI as a Mutual Fund Distributor. Angel
Broking Limited is a registered entity with SEBI for Research Analyst in terms of SEBI (Research Analyst) Regulations, 2014 vide
registration number INH000000164. Angel or its associates has not been debarred/ suspended by SEBI or any other regulatory
authority for accessing /dealing in securities Market. Angel or its associates/analyst has not received any compensation / managed
or co-managed public offering of securities of the company covered by Analyst during the past twelve months.
This document is solely for the personal information of the recipient, and must not be singularly used as the basis of any investment
decision. Nothing in this document should be construed as investment or financial advice. Each recipient of this document should
make such investigations as they deem necessary to arrive at an independent evaluation of an investment in the securities of the
companies referred to in this document (including the merits and risks involved), and should consult their own advisors to determine
the merits and risks of such an investment.
Reports based on technical and derivative analysis center on studying charts of a stock's price movement, outstanding positions and
trading volume, as opposed to focusing on a company's fundamentals and, as such, may not match with a report on a company's
fundamentals. Investors are advised to refer the Fundamental and Technical Research Reports available on our website to evaluate
the contrary view, if any.
The information in this document has been printed on the basis of publicly available information, internal data and other reliable
sources believed to be true, but we do not represent that it is accurate or complete and it should not be relied on as such, as this
document is for general guidance only. Angel Broking Limited or any of its affiliates/ group companies shall not be in any way
responsible for any loss or damage that may arise to any person from any inadvertent error in the information contained in this
report. Angel Broking Limited has not independently verified all the information contained within this document. Accordingly, we
cannot testify, nor make any representation or warranty, express or implied, to the accuracy, contents or data contained within this
document. While Angel Broking Limited endeavors to update on a reasonable basis the information discussed in this material, there
may be regulatory, compliance, or other reasons that prevent us from doing so.
This document is being supplied to you solely for your information, and its contents, information or data may not be reproduced,
redistributed or passed on, directly or indirectly.
Technical and Derivatives Team:
Sameet Chavan Chief Analyst - Technical & Derivatives sameet.chavan@angelbroking.com
Ruchit Jain Senior Analyst - Technical & Derivatives ruchit.jain@angelbroking.com
Rajesh Bhosale Technical Analyst rajesh.bhosle@angelbroking.com
Sneha Seth Derivatives Analyst sneha.seth@angelbroking.com
