www.angelbroking.com
Technical & Derivatives Report
June 17, 2020
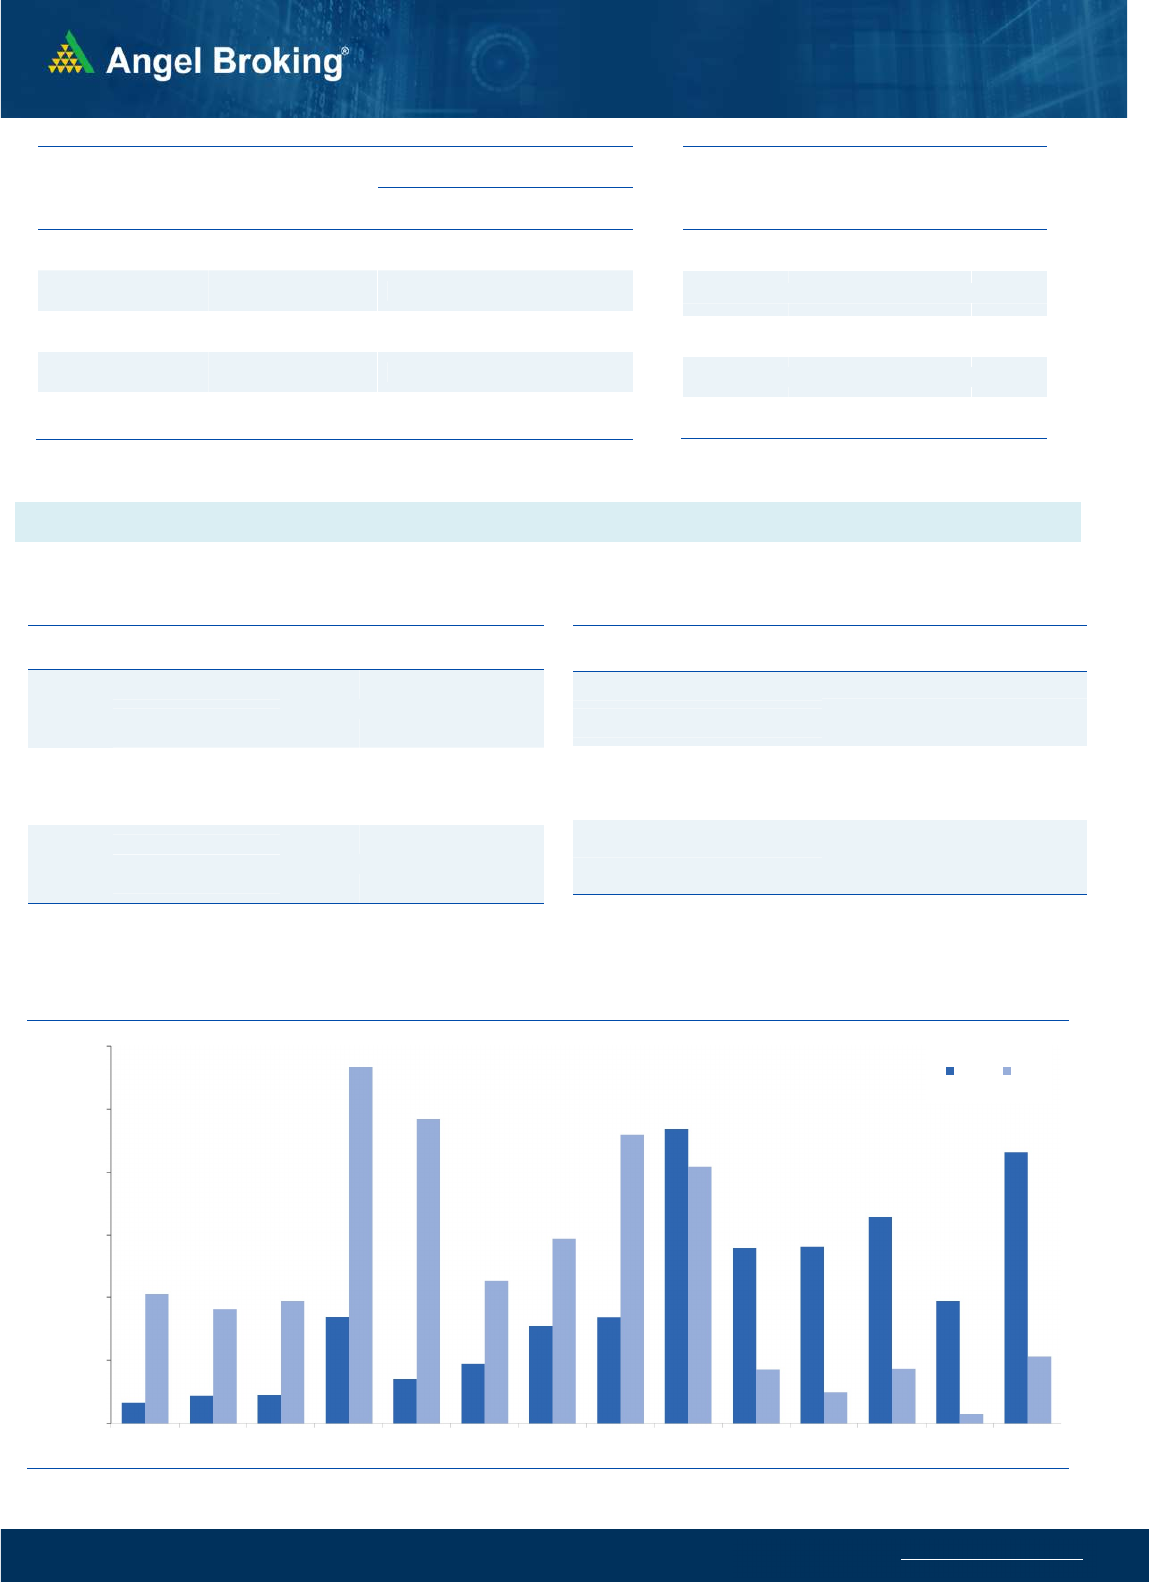
Nifty
Bank Out
look
-
(
20297
)
The Bank Nifty index too opened positive at 20500, but it
gradually crept lower and then it dipped sharply post the news of
violent face-off of Indian soldiers with Chinese troops. However,
post that initial sharp reaction, the index recovered from the low
of about 19500 and ended the day with gains of around 2 percent
at 20300.
Although we saw a sharp reaction to the above news, the index
again witnessed some buying interest at lower levels led by the
index heavyweights such as HDFC Bank, ICICI Bank and Kotak
Bank. The index has formed a support in the range of 19500-
19700 in last three sessions which is around the '200 SMA' on the
hourly chart. One should avoid forming any short positions till this
support is intact. Infact, we have witnessed some buying interest
in this range and hence, traders should look for stock specific
buying opportunities and trade with a positive bias. The
immediate resistance for Bank Nifty is seen in the range of 20650-
20750.
Key Levels
Support 1 – 19700 Resistance 1 – 20650
Support 2 – 19500 Resistance 2 – 20750
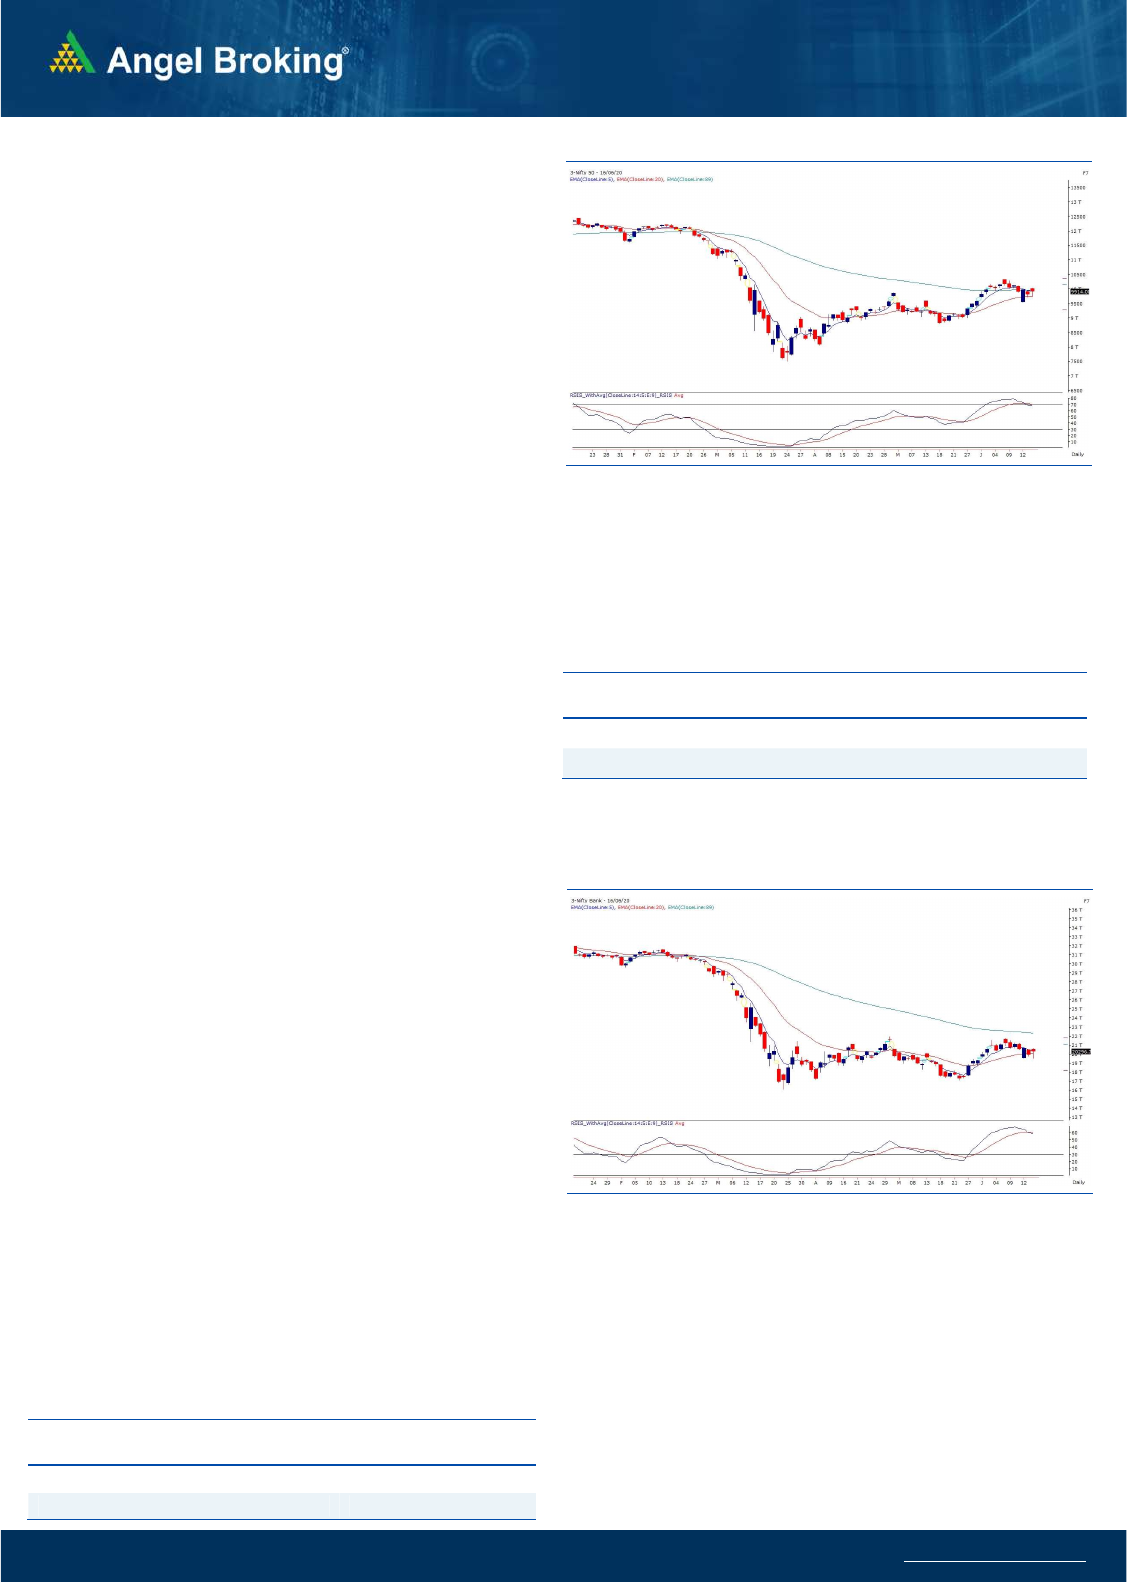
Exhibit 1: Nifty Daily Chart
Sensex (33605) / Nifty (9914)
When we closed on Monday, DOW future was trading deeply in
red and there was complete turnaround seen overnight. US
markets saw v-shaped recovery to close well inside the positive
territory and yesterday morning too the DOW future started with
a bang. Undoubtedly we had to follow these cues and as a result,
we started with a good bump up at the opening beyond the
10000 mark. Post this, market consolidated and looked a bit
uncomfortable at higher levels.
Finally at the midst of the day, we got to know why markets were
struggling. They probably had some hints about what happened
at INDIA-CHINA border Monday night. The moment the news was
out of ‘Face-off’, our markets took a nosedive and within no time,
we were considerably off highs. As we all know, market never
accept such geopolitical uncertainty. Fortunately, after the initial
knee jerk reaction, market stabilised and then gave a steady
recovery to conclude the day tad above 9900. At the opening,
things were very much in line with our expectations, as we had
mentioned about the cluster of supports for DOW JONES and
DAX, while they were falling on Monday. But due to some tension
at the domestic front, we failed to sustain at higher levels. Despite
all this, we managed to reclaim a key level and if there is no further
escalation with respect to our geopolitical concerns, we would
again start moving in tandem with global peers.
Exhibit 2: Nifty Bank Daily Chart
Hence, we still remain hopeful and now with yesterday’s see-saw,
the sacrosanct support can be seen in the zone of 9700-9500. On
the flipside, the next leg of the rally will get unfolded once Nifty
confirms a breakout beyond 10020-10050 levels.
Key Levels
Support 1 – 9700 Resistance 1 – 10020
Support 2 – 9500 Resistance 2 – 10050

www.angelbroking.com
Technical & Derivatives Report
June 17, 2020
Nifty Vs OI
9600
9700
9800
9900
10000
10100
10200
10300
10,000
10,500
11,000
11,500
12,000
12,500
6/1 6/2 6/3 6/4 6/5 6/8 6/9 6/10 6/11 6/12 6/15 6/16
(`000)
Openinterest Nifty
V
iew
s
Nifty witnessed a big gap up opening however it was
followed by a volatile session as we witnessed swings
on both the side of trend. Nifty eventually ended with
gains of a percent at 9914.
FIIs were net sellers in the cash market segment to the
tune of Rs. 1479 crores. In index futures, they bought
worth 114 crores with no relevant change in open
interest.
Post a gap up opening, the indices traded with higher
volatility yesterday due to the news of India-China
border face-off. This led to some uncertainty due to
which we saw unwinding of positions in Nifty as well as
Bank Nifty. FII’s were net sellers in the cash segment
while they formed marginal longs in index futures
segment. Their ‘Long Short Ratio’ is around 48 percent
now. In options segment, 10000-10200 call options
witnessed addition of open interest indicating
resistance in this range. On the flipside, 9500 is the
immediate support for the index. Considering the open
interest build-up in the weekly as well as the monthly
expiry, it seems the index would oscillate within the
broad range of 9500-10200. Within this broad range,
traders are advised to trade with a stock specific
approach as there could be opportunities to trade on
both sides of trade.
C
o
mm
e
n
t
s
The Nifty futures open interest has decreased by 2.79%
Bank Nifty futures open interest has decreased by 8.44%
as market closed at 9914 levels.
The Nifty June future closed with a discount of 16.15
point against a premium of 0.05 point in last trading
session. The July series closed at a discount of 36.4 point.
The INDIA VIX has increased from 32.57 to 32.96
At the same time, the PCR-OI of Nifty decreased from
1.34 to 1.28.
Few of the liquid counters where we have seen high cost
of carry are IDEA, ADANIENT, L&TFH, EQUITAS and
JINDALSTEL.
OI Gainers
SCRIP OI
OI
CHG. (%)
PRICE
PRICE
CHG. (%)
JINDALSTEL 20040000 27.85 143.50 5.69
TATAMOTORS 91166400 15.12 94.75 -5.82
AXISBANK 69598800 12.21 381.55 -1.94
BALKRISIND 1480000 11.92 1199.20 4.98
GODREJPROP 436800 10.89 818.15 0.05
BATAINDIA 1191300 5.97 1330.35 -0.70
L&TFH 25234800 5.95 61.20 -1.13
PVR 1671600 5.58 989.75 -3.59
OI Losers
SCRIP OI
OI
CHG. (%)
PRICE
PRICE
CHG. (%)
UBL 1061200 -11.76 1004.45 0.01
TORNTPOWER 1608000 -7.75 324.75 -0.32
IDEA 264096000 -7.13 9.75 -3.45
NIITTECH 411000 -6.16 1347.15 0.85
VOLTAS 3605000 -5.31 549.60 0.27
LICHSGFIN 7106500 -5.18 283.90 5.51
BHEL 46668200 -5.16 28.35 -2.74
TATASTEEL 23225900 -4.90 308.95 1.24
Put-Call Ratio
SCRIP PCR-OI PCR-VOL
NIFTY 1.28 1.06
BANKNIFTY 0.86 0.96
RELIANCE 0.71 0.52
ICICIBANK 0.64 0.70
INFY 0.52 0.51
Historical Volatility
SCRIP HV
HDFCBANK 44.85
GODREJCP 48.35
BALKRISIND 61.88
LICHSGFIN 67.70
TATAMOTORS 77.32
www.angelbroking.com
Technical & Derivatives Report
June 17, 2020
Note: Above mentioned Bullish or Bearish Spreads in Nifty (June Series) are given as an information and not as a recommendation.
Nifty Spot =
9914
FII Statistics for June 16, 2020
Detail Buy Sell Net
Open Interest
Contracts
Value
(in Cr.)
Change
(%)
INDEX
FUTURES
7999.56
7885.61
113.95
123819
8134.51
0.19
INDEX
OPTIONS
312916.39
312885.76
30.63
828599
55428.90
2.86
STOCK
FUTURES
17100.98
16732.31
368.67
1549379
82304.40
0.60
STOCK
OPTIONS
6180.76
6217.35
(36.59) 106551
5856.64
0.38
Total 344197.69
343721.03
476.66
2608348
151724.45
1.28
Turnover on June 16, 2020
Instrument
No. of
Contracts
Turnover
( in Cr. )
Change
(%)
Index Futures 9,01,556 48443.74 22.73
Index Options 2,66,32,072
15,10,220.83 45.31
Stock Futures 10,81,590 55981.35 5.29
Stock Options 13,75,680 77597.72 9.38
Total 2,99,90,898
16,92,243.64 40.68
Bull-Call Spreads
Action Strike Price Risk Reward BEP
Buy 9900 205.80
50.65 49.35 9950.65
Sell 10000 155.15
Buy 9900 205.80
92.05 107.95 9992.05
Sell 10100 113.75
Buy 10000 155.15
41.40 58.60 10041.40
Sell 10100 113.75
Bear-Put Spreads
Action Strike Price Risk Reward BEP
Buy 9900 209.95
40.25 59.75 9859.75
Sell 9800 169.70
Buy 9900 209.95
72.70 127.30 9827.30
Sell 9700 137.25
Buy 9800 169.70
32.45 67.55 9767.55
Sell 9700 137.25
Nifty Put-Call Analysis
,0
500,000
1000,000
1500,000
2000,000
2500,000
3000,000
9200 9300 9400 9500 9600 9700 9800 9900 10000 10100 10200 10300 10400 10500
Call Put

www.angelbroking.com
Technical & Derivatives Report
June 17, 2020
Daily Pivot Levels for Nifty Constituents
Scrips
S2
S1
PIVOT
R1
R2
ADANIPORTS
330
335
341
347
352
ASIANPAINT 1,591 1,606
1,623
1,639
1,656
AXISBANK
338
360
382
404
427
BAJAJ-AUTO 2,652 2,685
2,736
2,769
2,820
BAJFINANCE 2,198 2,282
2,368
2,452
2,539
BAJAJFINSV 4,837 4,983
5,126
5,272
5,416
BPCL
347
354
363
369
378
BHARTIARTL
525
535
547
557
569
INFRATEL
206
211
220
225
234
BRITANNIA 3,288 3,317
3,358
3,387
3,428
CIPLA
623
630
640
648
658
COALINDIA
126
129
132
134
137
DRREDDY 3,885 3,945
4,013
4,073
4,140
EICHERMOT 16,079
16,394
16,697
17,012
17,315
GAIL
92
95
98
101
105
GRASIM
567
578
591
602
616
HCLTECH
569
575
584
590
599
HDFCBANK
937
964
979
1,006
1,021
HDFC 1,742 1,782
1,808
1,848
1,874
HEROMOTOCO
2,322
2,359
2,397
2,434
2,473
HINDALCO
143
146
151
154
158
HINDUNILVR 2,021 2,049
2,084
2,112
2,147
ICICIBANK
317
330
339
352
361
IOC
81
83
86
87
90
INDUSINDBK
426
454
484
512
543
INFY
691
696
704
709
717
ITC
177
181
186
190
195
JSW STEEL
180
185
191
195
201
KOTAKBANK 1,213 1,245
1,270
1,302
1,328
LT
870
883
904
916
937
M&M
491
499
509
517
527
MARUTI 5,292 5,397
5,505
5,610
5,717
NESTLEIND 16,075
16,209
16,403
16,537
16,731
NTPC
91
92
93
95
96
ONGC
81
82
84
86
87
POWERGRID
159
161
163
165
168
RELIANCE 1,554 1,586
1,617
1,649
1,680
SHREECEM 21,410
21,761
22,150
22,501
22,890
SBIN
164
169
174
178
183
SUNPHARMA
467
475
484
492
501
TCS 2,007 2,027
2,050
2,070
2,093
TATAMOTORS
85
90
97
102
108
TATASTEEL
290
299
311
321
332
TECHM
515
524
540
550
566
TITAN
918
938
954
974
990
ULTRACEMCO 3,686 3,733
3,782
3,829
3,877
UPL
398
406
418
426
437
VEDANTA
100
102
104
106
108
WIPRO
205
209
213
217
222
ZEEL
155
159
166
170
177

www.angelbroking.com
Technical & Derivatives Report
June 17, 2020
*
Research Team Tel: 022 – 39357600 (Extn. 6844) Website: www.angelbroking.com
For Technical & Derivatives Queries E-mail: technic[email protected]
DISCLAIMER
Angel Broking Limited (hereinafter referred to as “Angel”) is a registered Member of National Stock Exchange of India Limited, Bombay
Stock Exchange Limited and Metropolitan Stock Exchange Limited. It is also registered as a Depository Participant with CDSL and
Portfolio Manager and Investment Adviser with SEBI. It also has registration with AMFI as a Mutual Fund Distributor. Angel Broking
Limited is a registered entity with SEBI for Research Analyst in terms of SEBI (Research Analyst) Regulations, 2014 vide registration
number INH000000164. Angel or its associates has not been debarred/ suspended by SEBI or any other regulatory authority for
accessing /dealing in securities Market. Angel or its associates/analyst has not received any compensation / managed or co-managed
public offering of securities of the company covered by Analyst during the past twelve months.
This document is solely for the personal information of the recipient, and must not be singularly used as the basis of any investment
decision. Nothing in this document should be construed as investment or financial advice. Each recipient of this document should make
such investigations as they deem necessary to arrive at an independent evaluation of an investment in the securities of the companies
referred to in this document (including the merits and risks involved), and should consult their own advisors to determine the merits
and risks of such an investment.
Reports based on technical and derivative analysis center on studying charts of a stock's price movement, outstanding positions and
trading volume, as opposed to focusing on a company's fundamentals and, as such, may not match with a report on a company's
fundamentals. Investors are advised to refer the Fundamental and Technical Research Reports available on our website to evaluate the
contrary view, if any.
The information in this document has been printed on the basis of publicly available information, internal data and other reliable
sources believed to be true, but we do not represent that it is accurate or complete and it should not be relied on as such, as this
document is for general guidance only. Angel Broking Limited or any of its affiliates/ group companies shall not be in any way
responsible for any loss or damage that may arise to any person from any inadvertent error in the information contained in this report.
Angel Broking Limited has not independently verified all the information contained within this document. Accordingly, we cannot
testify, nor make any representation or warranty, express or implied, to the accuracy, contents or data contained within this document.
While Angel Broking Limited endeavors to update on a reasonable basis the information discussed in this material, there may be
regulatory, compliance, or other reasons that prevent us from doing so.
This document is being supplied to you solely for your information, and its contents, information or data may not be reproduced,
redistributed or passed on, directly or indirectly.
Technical and Derivatives Team:
Sameet Chavan Chief Analyst - Technical & Derivatives sameet.chavan@angelbroking.com
Ruchit Jain Senior Analyst - Technical & Derivatives ruchit.jain@angelbroking.com
Rajesh Bhosale Technical Analyst rajesh.bhosle@angelbroking.com
Sneha Seth Derivatives Analyst sneha.seth@angelbroking.com