www.angelbroking.com
Technical & Derivatives Report
October 16, 2020
Nifty
Bank Out
look
-
(
23072
)
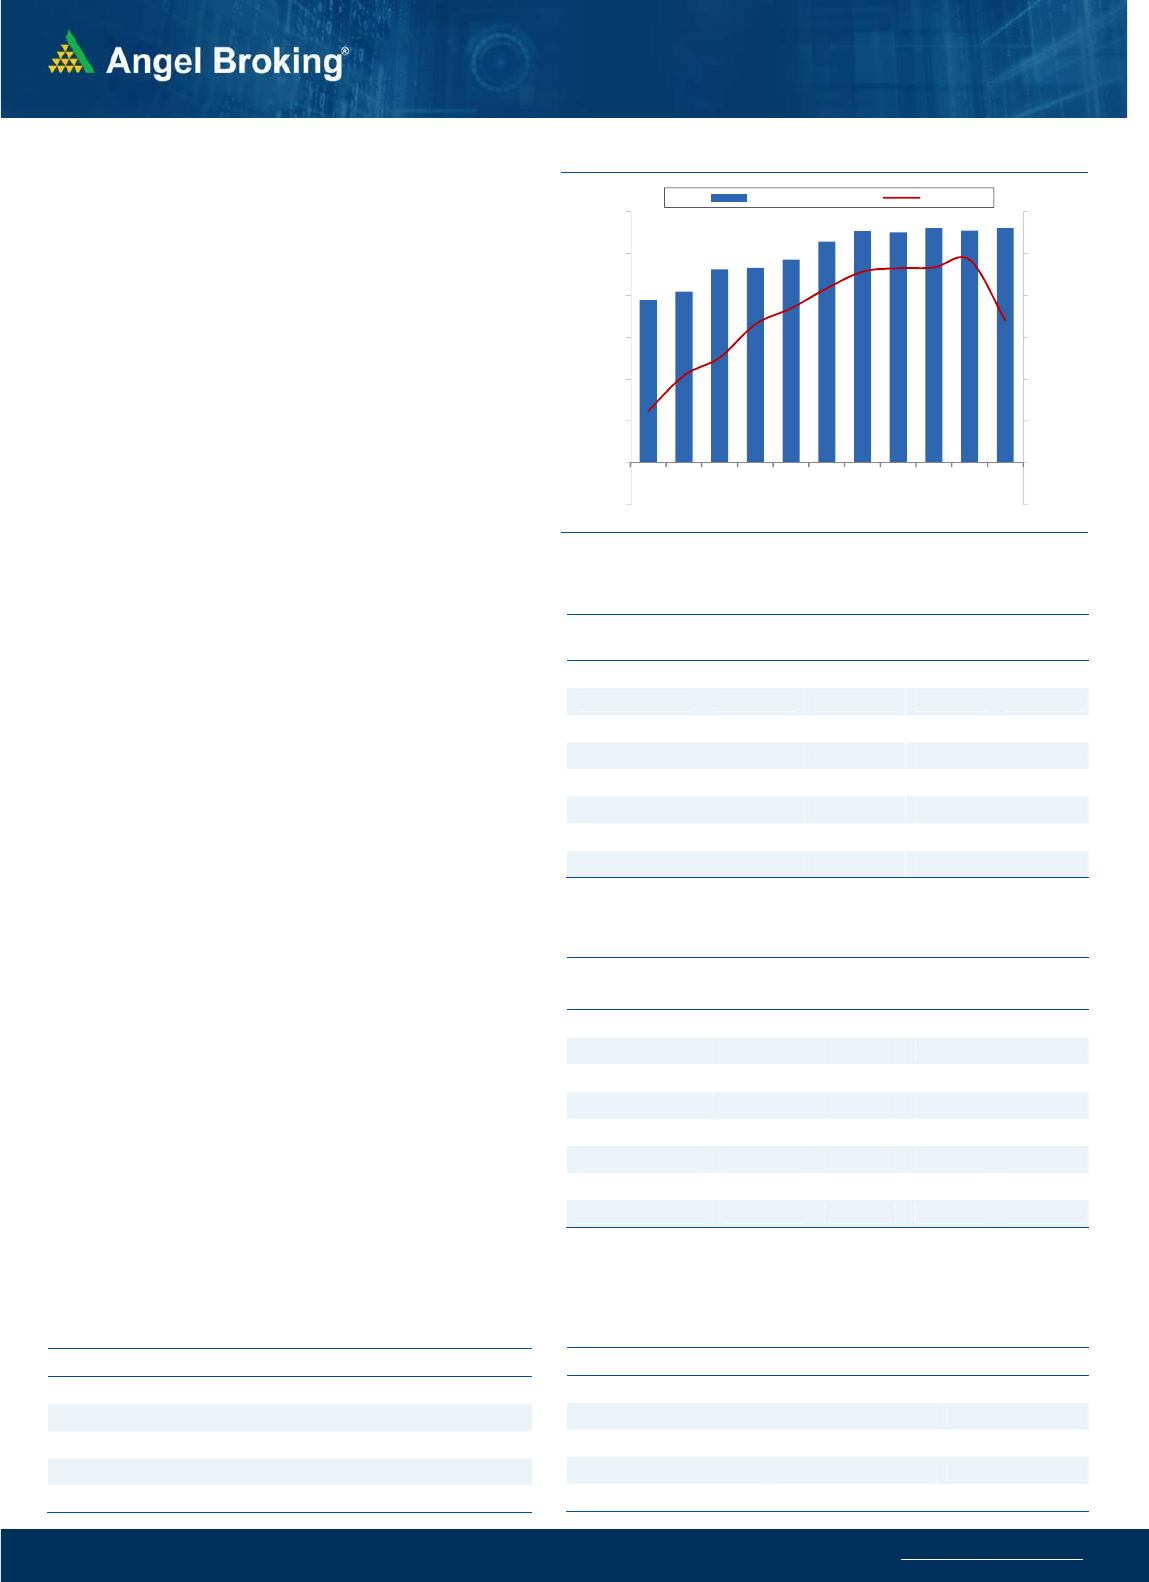
Bank Nifty started on a mild positive note and it then slipped lower
immediately in the first few minutes. This dip however got bought into
due to the rub-off effect from the previous session to surpass the
levels of 24000. However, the weakness in the global markets
triggered a sharp sell-off in the second half to eventually end with a
loss of 3.36% at 23072.
Yesterday's fall was unexpected especially after the strong upmove
seen during the last hours of the previous session. With yesterday's
fall, the prices have slipped below the previous session low and the
bulls have definitely lost the momentum. However with the last two
sessions strong swings on both sides the volatility has definitely
increased and it would be unwise to immediately take this as a
reversal. Since the fall has been triggered by a global scenario it would
be better to wait for further clarity and volatility to settle down. Hence,
traders are advised to avoid aggressive positions and better stay light.
The important levels to watch out for will be 22730 and 22310 as
support whereas on the flip side 23388 and 23630 is the immediate
resistance zone.
Key Levels
Support 1 – 22730 Resistance 1 – 23388
Support 2 – 22310 Resistance 2 – 23630
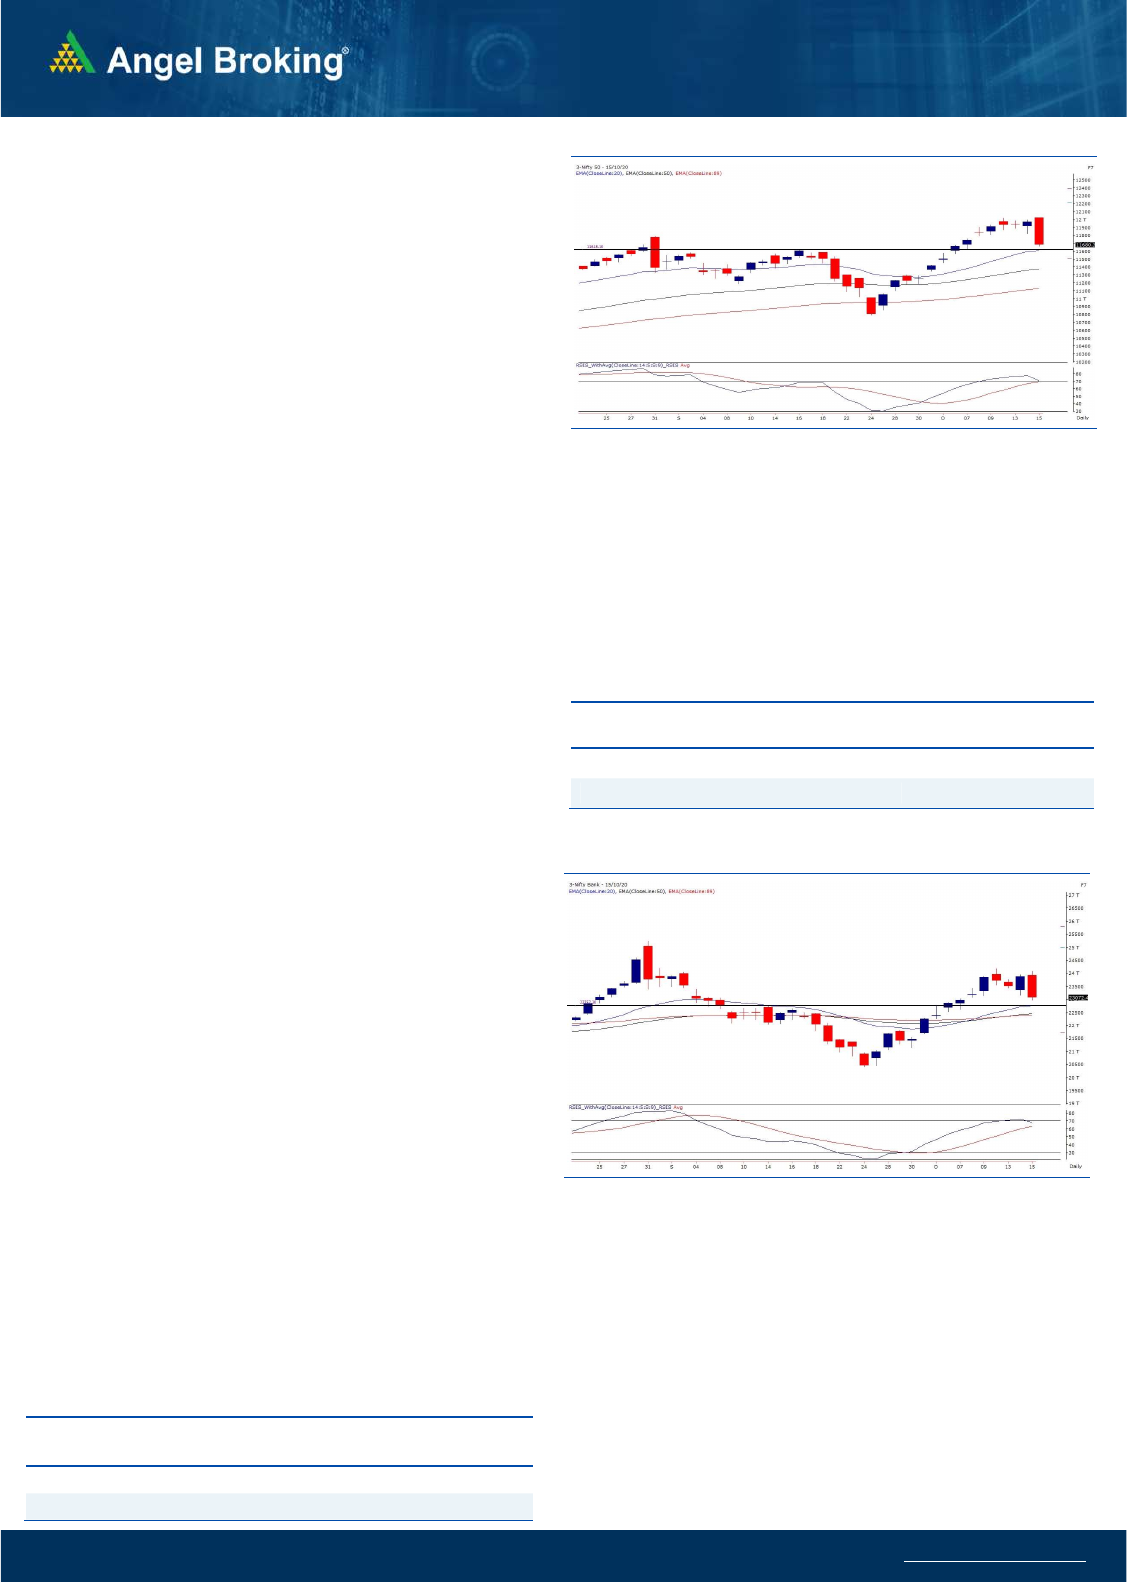
Exhibit 1: Nifty Daily Chart
Sensex (39728) / Nifty (11680)
Despite unfavorable global cues, we kick started the session at the seven
month high above 12000. However this gap up opening turned out to
be a formality as we came off sharply in the initial trades. Markets
stabilized from the hiccup; courtesy to complete recovery in banking
stocks. Once again, this rebound got sold into which then became a
nightmare for the bulls post the mid session as markets took a complete
nosedive on the fears of a second wave of coronavirus hitting major
European countries. This resulted in a similar trading session we
witnessed on 31st August to mark more than a couple of percent losses.
Wednesday’s smart recovery in the last hour was extremely encouraging
and suggested an extension of the move. But global sell off poured
complete water on this optimism and before anyone could realized, we
were back to sub-11700 levels. Now, purely looking at charts, this down
move should only be interpreted as a pull back towards the recent trend
line breakout points. This coincides with the 20-day EMA level of 11600.
Hence, all eyes would be on this level in the forthcoming session.
However, since the fall has to do with the global uncertainty, it would be
important to see how things pan out there and if things worsen, we may
see the market correcting further. A close below 11600 would result in
an extended fall towards 11450 – 11350 levels. And if things settle down
and Nifty manages to hold 11600, we may see our markets resuming
the recent uptrend. For the coming session, 11822 – 11900 is likely to
act as intraday resistances.
Exhibit 2: Nifty Bank Daily Chart
There are a lot of ifs and buts at the end of
yesterday
’s weak session and
hence, better to wait for further development to get the clear direction
for next few sessions. Sectorally, IT was one of the leading sectors in the
last few weeks but yesterday it was the first one to trigger the selloff.
Also, banking space disappointed yesterday after Wednesday’s
stupendous move. The midcap index continues to underperform and
yesterday, when stronger pockets gave up, the midcaps had to correct
sharply. At present, traders are advised to stay light and keep a close
track on all the above scenarios.
.Key Levels
Support 1 – 11600 Resistance 1 – 11822
Support 2 – 11540 Resistance2 – 11900
www.angelbroking.com
Technical & Derivatives Report
October
16, 2020
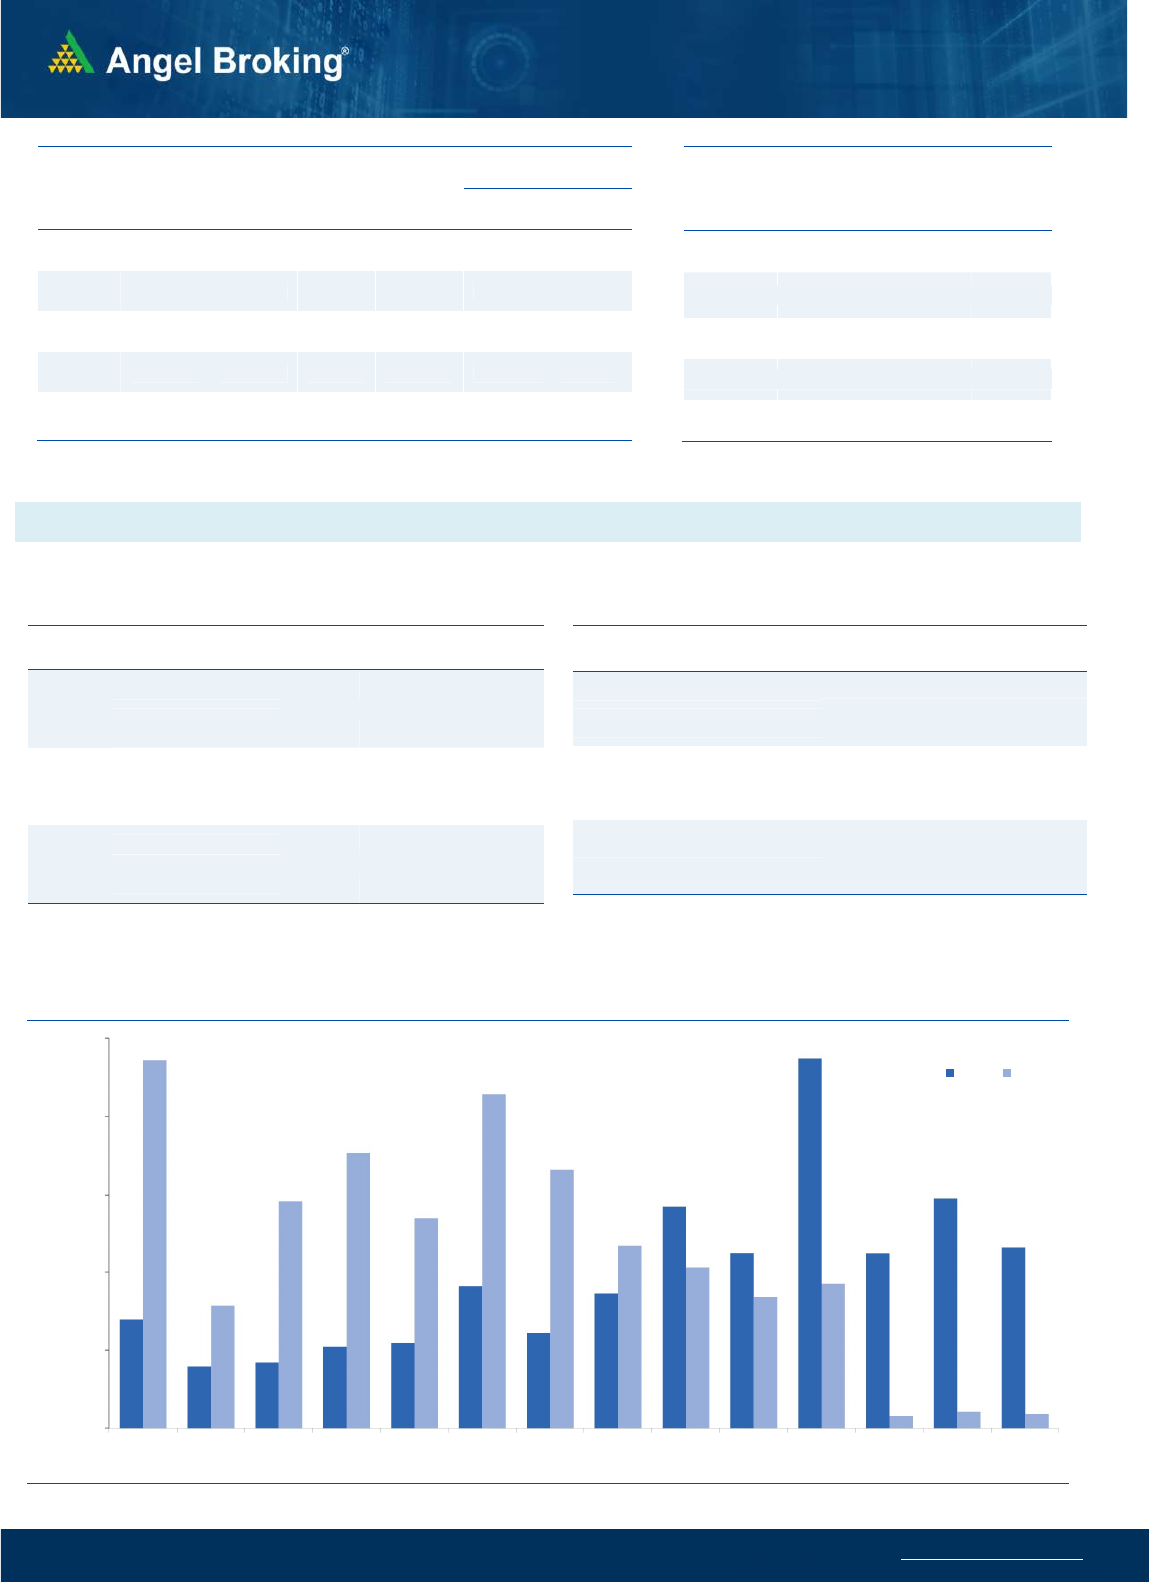
Nifty Vs OI
10800
11000
11200
11400
11600
11800
12000
12200
,0
2,000
4,000
6,000
8,000
10,000
12,000
14,000
9/30 10/5 10/7 10/9 10/13 10/15
(`000)
Openinterest Nifty
Vie
w
s
Post some recovery from the lower levels in the first half
of the session, our markets corrected sharply in the later
half and ended the weekly expiry with a sharp cut below
the 11700 mark.
FIIs were net sellers in the cash segment to the tune of
Rs. 605 crores. In index future segment, they sold worth
Rs. 107 crores with increase in open interest indicating
long unwinding and short formations in yesterday’s
session.
FII's turned net sellers in the cash segment while they
were sellers in the index futures segment too. India VIX
rose by over 9 percent to end above 22 mark. The data
indicates immediate supports around 11600 and 11500
while 11800 is the immediate resistance. Considering
the increase in volatility, traders are advised to avoid
aggressive positions and trade with a stock specific
approach.
C
o
mme
n
t
s
The Nifty futures open interest has increased by 1.00%
Bank Nifty futures open interest has decreased by 4.99%
as market closed at 11680.35 levels.
The Nifty October future closed with a premium of 5.20
point against a premium of 11.20 point in last trading
session. The November series closed at a premium of 33.4
point.
The INDIA VIX has increased from 20.21 to 22.06.
At the same time, the PCR-OI of Nifty decreased from
1.42 to 0.99.
Few of the liquid counters where we have seen high cost
of carry are MINDTREE, JINDALSTEL, GMRINFRA, VEDL
AND APOLLOTYRE.
OI Gainers
SCRIP OI
OI
CHG. (%)
PRICE
PRICE
CHG. (%)
GODREJPROP 907400 11.41 849.10 -3.27
ASHOKLEY 45432000 9.43 72.35 -1.29
BAJFINANCE 5212750 9.31 3214.70 -5.15
MANAPPURAM 17064000 5.49 159.30 -4.49
LT 16215650 5.03 888.80 -2.81
APOLLOHOSP 1734500 4.39 2182.60 -1.81
RECLTD 24390000 4.31 93.45 -2.20
GODREJCP 5762000 4.14 682.15 -2.57
OI Losers
SCRIP OI
OI
CHG. (%)
PRICE
PRICE
CHG. (%)
SRF 579250 -10.71 4351.65 -1.00
BATAINDIA 1512500 -9.98 1350.65 -1.07
MGL 1798200 -9.24 814.65 2.29
NAUKRI 690500 -9.14 3607.65 -3.95
ESCORTS 3066800 -8.26 1196.20 -3.37
IBULHSGFIN 16678000 -8.19 151.50 -3.24
HINDUNILVR 6043500 -7.77 2152.45 -0.31
TATASTEEL 24061800 -7.59 373.90 -0.89
Put-Call Ratio
SCRIP PCR-OI PCR-VOL
NIFTY 0.99 0.82
BANKNIFTY 0.62 0.82
RELIANCE 0.51 0.44
ICICIBANK 0.58 0.64
INFY 0.33 0.45
Historical Volatility
SCRIP HV
MINDTREE 60.15
TECHM 46.61
HDFCBANK 41.01
PETRONET 44.45
CADILAHC 43.60
www.angelbroking.com
Technical & Derivatives Report
October
16, 2020
Note: Above mentioned Bullish or Bearish Spreads in Nifty (October Series) are given as an information and not as a recommendation.
Nifty Spot =
11680.35
FII Statistics for October 15, 2020
Detail Buy
Net Contracts
Open Interest
Sell
Value
(in Cr.)
Change
INDEX
FUTURES
5820.83
5928.10
(107.27) 150964
11949.15
1.00
INDEX
OPTIONS
567108.24
565783.39
1324.85
825045
66885.49
(15.79)
STOCK
FUTURES
15853.80
15632.02
221.78
1119259
78308.50
(0.12)
STOCK
OPTIONS
8634.44
8775.16
(140.72) 103826
8083.73
2.15
Total 597417.31
596118.67
1298.64
2199094
165226.87
(6.48)
Turnover on October 15, 2020
Instrument
No. of
Contracts
Turnover
( in Cr. )
Change
(%)
Index Futures
6,09,860 43081.17 31.75
Index Options
8,09,40,551 55,98,986.00 160.78
Stock Futures
7,94,355 62169.59 14.73
Stock Options
13,67,537 1,20,525.78 22.18
Total 8,37,12,303 58,24,762.54 149.71
Bull-Call Spreads
Action Strike Price Risk Reward BEP
Buy 11700 170.95
47.45 52.55 11747.45
Sell 11800 123.50
Buy 11700 170.95
85.55 114.45 11785.55
Sell 11900 85.40
Buy 11800 123.50
38.10 61.90 11838.10
Sell 11900 85.40
Bear-Put Spreads
Action Strike Price Risk Reward BEP
Buy 11700 182.30
41.15 58.85 11658.85
Sell 11600 141.15
Buy 11700 182.30
73.60 126.40 11626.40
Sell 11500 108.70
Buy 11600 141.15
32.45 67.55 11567.55
Sell 11500 108.7
Nifty Put-Call Analysis
,0
500,000
1000,000
1500,000
2000,000
2500,000
11000 11100 11200 11300 11400 11500 11600 11700 11800 11900 12000 12100 12200 12300
Call Put

www.angelbroking.com
Technical & Derivatives Report
October
16, 2020
Da
ily
Pivot Level
s for
Nifty Constituents
Scrips
S2
S1
PIVOT
R1
R2
ADANIPORTS
333
338
346
351
359
ASIANPAINT 2,036 2,063
2,094
2,121
2,151
AXISBANK
446
454
468
476
490
BAJAJ-AUTO 2,948 2,988
3,059
3,098
3,170
BAJFINANCE 3,093 3,154
3,262
3,323
3,431
BAJAJFINSV 5,694 5,797
5,982
6,085
6,270
BPCL
316
322
330
335
344
BHARTIARTL
383
391
403
411
424
BRITANNIA 3,640 3,685
3,761
3,806
3,882
CIPLA
748
758
773
783
798
COALINDIA
108
109
111
112
114
DIVISLAB 2,997 3,054
3,102
3,159
3,207
DRREDDY 4,936 4,996
5,080
5,141
5,225
EICHERMOT 2,182 2,215
2,259
2,292
2,336
GAIL
81
82
83
84
85
GRASIM
732
741
754
764
777
HCLTECH
795
828
866
898
936
HDFCBANK 1,130 1,150
1,183
1,203
1,236
HDFCLIFE
551
556
565
570
579
HDFC 1,887 1,917
1,968
1,999
2,050
HEROMOTOCO 3,239 3,276
3,328
3,366
3,417
HINDALCO
168
171
175
177
181
HINDUNILVR 2,119 2,136
2,158
2,174
2,196
ICICIBANK
376
383
397
404
417
IOC
73
74
75
76
77
INDUSINDBK
569
583
608
623
647
INFY 1,035 1,072
1,129
1,165
1,222
ITC
163
164
166
167
169
JSW STEEL
284
288
293
296
301
KOTAKBANK 1,261 1,285
1,326
1,350
1,390
LT
864
876
898
910
931
M&M
603
610
621
629
640
MARUTI 6,741 6,817
6,933
7,009
7,126
NESTLEIND 15,425
15,514
15,651
15,740
15,877
NTPC
77
78
79
80
81
ONGC
64
65
67
68
70
POWERGRID
153
155
156
157
158
RELIANCE 2,136 2,171
2,231
2,266
2,326
SBILIFE
789
797
809
817
829
SHREECEM 20,048
20,345
20,802
21,100
21,557
SBIN
185
189
196
200
206
SUNPHARMA
479
485
495
500
510
TCS 2,664 2,702
2,765
2,803
2,866
TATAMOTORS
121
124
129
132
137
TATASTEEL
361
367
378
385
395
TECHM
774
793
826
845
877
TITAN 1,193 1,203
1,220
1,231
1,248
ULTRACEMCO 4,301 4,342
4,408
4,449
4,514
UPL
493
500
510
517
527
WIPRO
330
336
345
351
360

www.angelbroking.com
Technical & Derivatives Report
October
16, 2020
*
Research Team Tel: 022 – 39357600 (Extn. 6844) Website: www.angelbroking.com
For Technical Queries E-mail: technicalresearch-cso@angelbroking.com
For Derivatives Queries E-mail: derivatives.desk@angelbroking.com
DISCLAIMER
Angel Broking Limited (hereinafter referred to as “Angel”) is a registered Member of National Stock Exchange of India Limited, Bombay
Stock Exchange Limited and Metropolitan Stock Exchange Limited. It is also registered as a Depository Participant with CDSL and
Portfolio Manager and Investment Adviser with SEBI. It also has registration with AMFI as a Mutual Fund Distributor. Angel Broking
Limited is a registered entity with SEBI for Research Analyst in terms of SEBI (Research Analyst) Regulations, 2014 vide registration
number INH000000164. Angel or its associates has not been debarred/ suspended by SEBI or any other regulatory authority for
accessing /dealing in securities Market. Angel or its associates/analyst has not received any compensation / managed or co-managed
public offering of securities of the company covered by Analyst during the past twelve months.
This document is solely for the personal information of the recipient, and must not be singularly used as the basis of any investment
decision. Nothing in this document should be construed as investment or financial advice. Each recipient of this document should make
such investigations as they deem necessary to arrive at an independent evaluation of an investment in the securities of the companies
referred to in this document (including the merits and risks involved), and should consult their own advisors to determine the merits
and risks of such an investment.
Reports based on technical and derivative analysis center on studying charts of a stock's price movement, outstanding positions and
trading volume, as opposed to focusing on a company's fundamentals and, as such, may not match with a report on a company's
fundamentals. Investors are advised to refer the Fundamental and Technical Research Reports available on our website to evaluate the
contrary view, if any.
The information in this document has been printed on the basis of publicly available information, internal data and other reliable
sources believed to be true, but we do not represent that it is accurate or complete and it should not be relied on as such, as this
document is for general guidance only. Angel Broking Limited or any of its affiliates/ group companies shall not be in any way
responsible for any loss or damage that may arise to any person from any inadvertent error in the information contained in this report.
Angel Broking Limited has not independently verified all the information contained within this document. Accordingly, we cannot
testify, nor make any representation or warranty, express or implied, to the accuracy, contents or data contained within this document.
While Angel Broking Limited endeavors to update on a reasonable basis the information discussed in this material, there may be
regulatory, compliance, or other reasons that prevent us from doing so.
This document is being supplied to you solely for your information, and its contents, information or data may not be reproduced,
redistributed or passed on, directly or indirectly.
Technical and Derivatives Team:
Sameet Chavan Chief Analyst - Technical & Derivatives sameet.chavan@angelbroking.com
Ruchit Jain Senior Analyst - Technical & Derivatives ruchit.jain@angelbroking.com
Rajesh Bhosale Technical Analyst rajesh.bhosle@angelbroking.com
Sneha Seth Derivatives Analyst sneha.seth@angelbroking.com
