www.angelbroking.com
Technical & Derivatives Report
October 15, 2020
Nifty
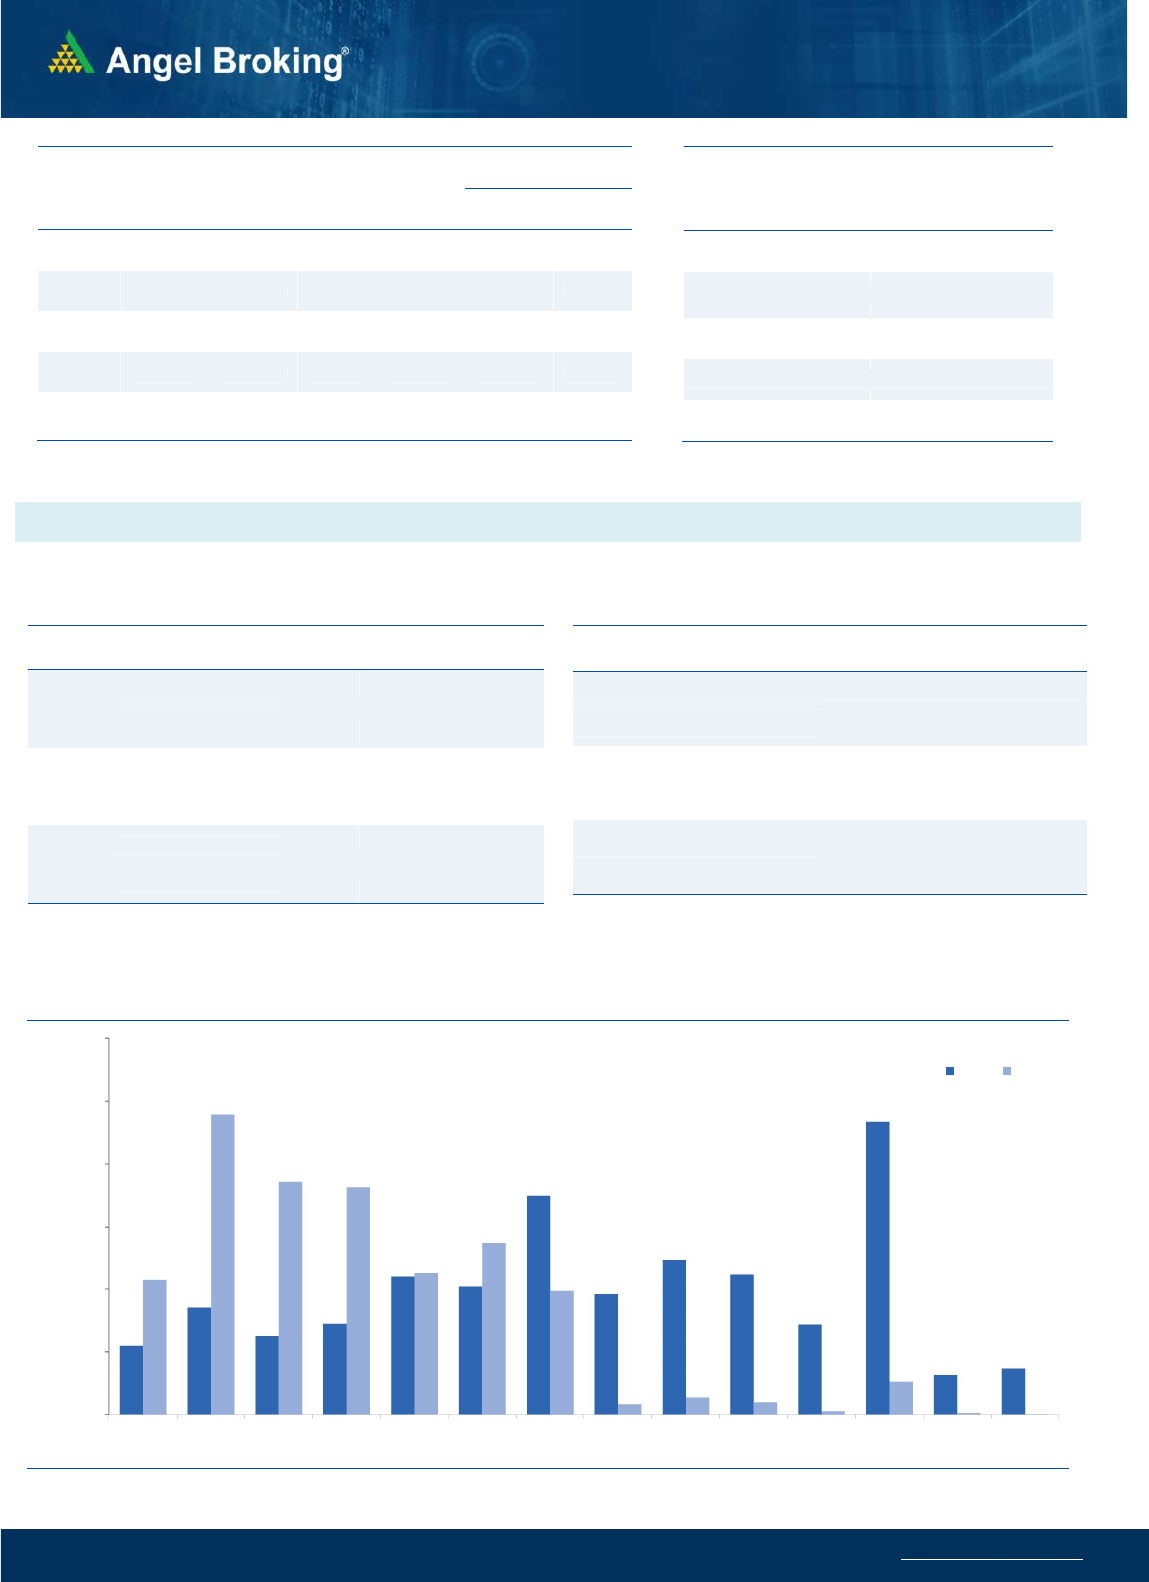
Bank Out
look
-
(
23875
)
Yesterday, Bank Nifty started with a gap down opening and
then it further slipped to test the levels of 23150. In the
penultimate hours however strong bounce back was seen
which not only recovered the entire loss but ended with strong
gains of 1.63% at 23874.65.
For the last two sessions, the bank nifty had a tepid move
however we maintained the positive stance and mentioned to
use such dips to enter long positions. This strategy worked well
and the way bank index moved during the last couple of hours
it indicates that prices have resumed the last two weeks upward
momentum. For the coming session, we sense the bank nifty to
test 24190 and then towards 24500 levels. On the flip side,
immediate support is placed around 23680 and 23600 levels.
Traders are advised to keep a positive approach and have a
stock specific long approach.
Key Levels
Support 1 – 23680 Resistance 1 – 24190
Support 2 – 23600 Resistance 2 – 24500
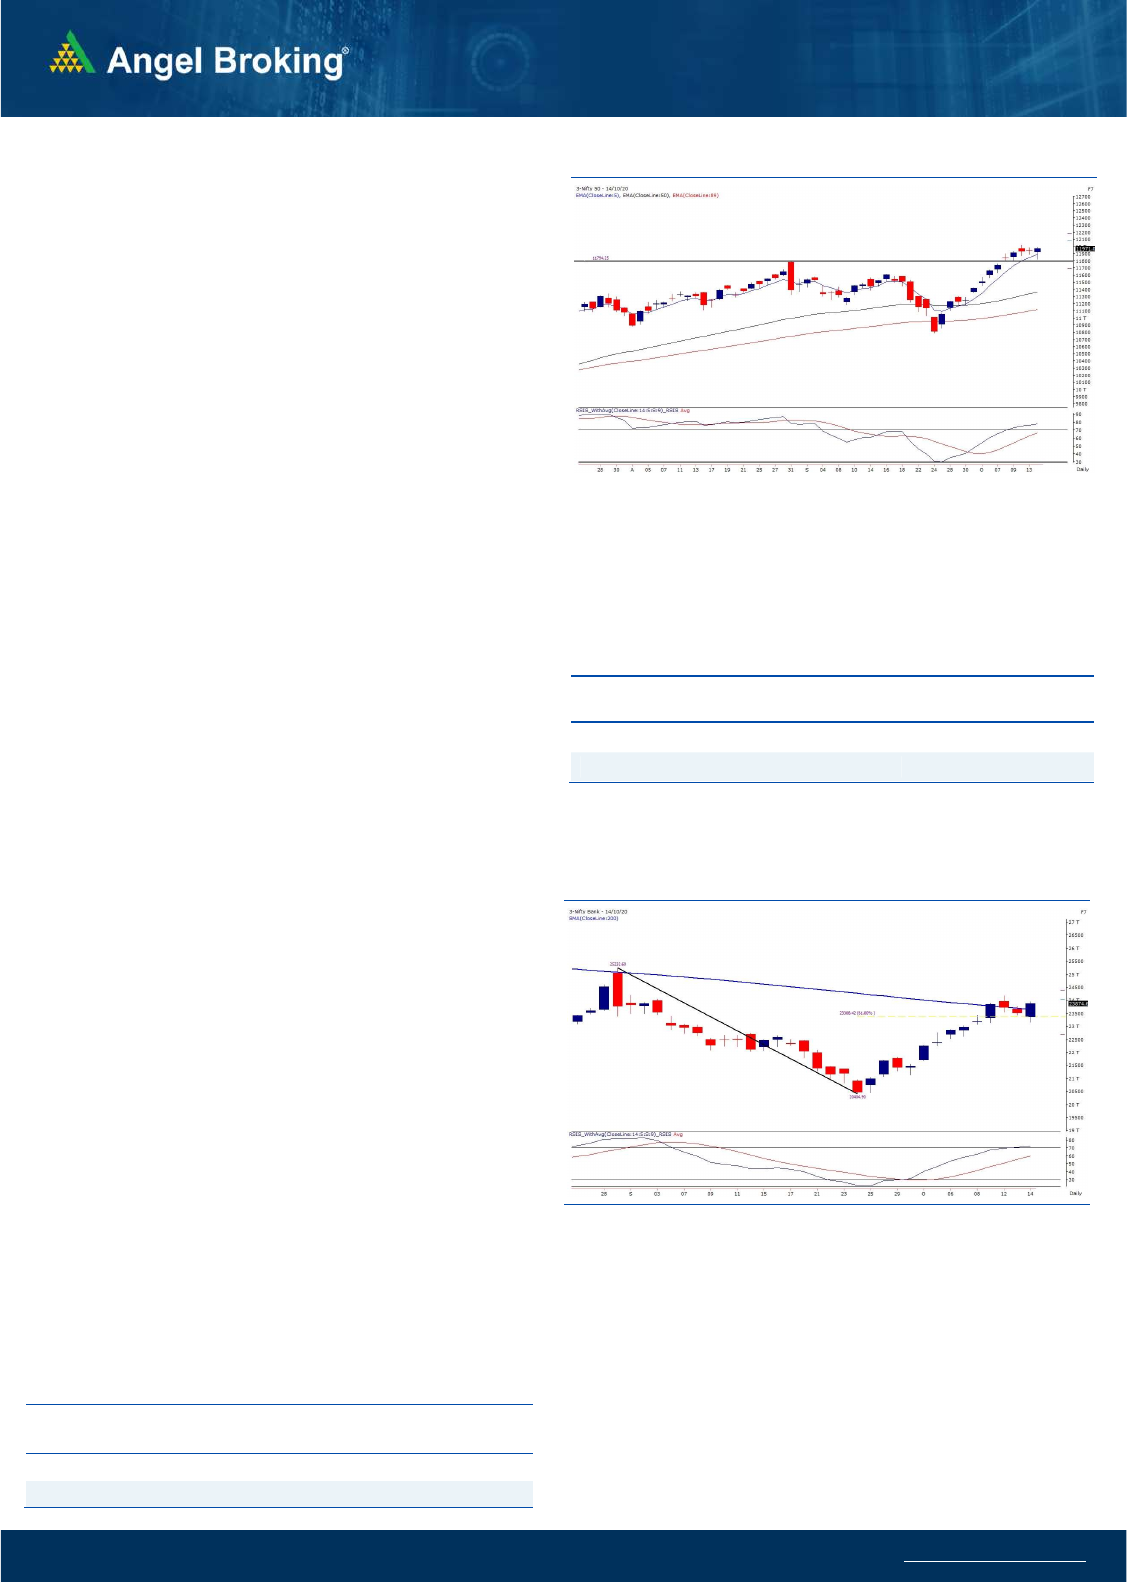
Exhibit 1: Nifty Daily Chart
Sensex (40795) / Nifty (11971)
Yesterday, global cues were a bit subdued early in the morning
and despite this, our markets opened lower and then extended
losses as the day progressed. The weakness was mainly led by the
IT counters, that were experiencing heavy profit taking after a
recent relentless run. Then banking joined hands to drag the
markets lower. But all of a sudden at the stroke of the penultimate
hour, markets just took off and financials were the major
charioteer to this late surge. Eventually, Nifty not only recouped
losses but also ended well inside the positive territory.
In last couple of days, markets cooled off a bit after reaching the
12000 mark; but with yesterday’s sharp recovery, 11800 has now
become a sacrosanct support. Nifty precisely attracted buyers in
the support area of 11867 - 11800 and fortunately, we managed
to participate in the sudden up move in the banking space. Now
the way banking index is shaped up, there is a high possibility
that we may see a convincing move beyond 12000 for Nifty
today. As far as levels are concerned, 12050-12100 are the next
levels to watch out for; whereas on the downside, 11900-11800
have become immediate supports.
Exhibit 2: Nifty Bank Daily Chart
Since last few days, we have been continuously mentioning how
broader market is quiet and remained unmoved in the recent
rally. But yesterday, in the last hour surge, midcap index too
participated well and a follow up in the coming session, would
certainly bode well for the bulls.
.Key Levels
Support 1 – 11900 Resistance 1 – 12050
Support 2 – 11800 Resistance2 – 12100

www.angelbroking.com
Technical & Derivatives Report
October 15, 2020
Nifty Vs OI
10800
11000
11200
11400
11600
11800
12000
12200
,0
2,000
4,000
6,000
8,000
10,000
12,000
14,000
9/30 10/1 10/5 10/6 10/7 10/8 10/9 10/1210/1310/14
(`000)
Openinterest Nifty
View
s
The indices corrected post opening and consolidated
with a negative bias for most part of the session.
However, the surge in the banking index led to an
upmove in the indices and Nifty posted gains of three-
tenths of a percent.
FIIs bought worth Rs.822 crores in cash segment. In
index future segment, they sold worth Rs. 714 crores
with decrease in open interest indicating long
unwinding and short formations in yesterday’s session.
The options data indicated a support around 11800
mark and Nifty traded above this support for most part
of the day. Finally, the support played its role and the
indices rallied in the last hour. FII's continued to buy
equities in the cash segment which is a positive sign. As
per the data, the support for the weekly expiry session
is placed around 11900 mark. On the flipside, if the
index sustains above 12000, then writers could unwind
their positions which would lead to further upmove.
Hence, traders are advised to trade with a positive bias
and look to buy at-the-money call option for the day.
The Bank Nifty index could show relative
outperformance and hence, traders can also look for
buying opportunities in this index.
C
o
mme
n
t
s
The Nifty futures open interest has decreased by 0.91%
Bank Nifty futures open interest has increased by 1.92%
as market closed at 11971.05 levels.
The Nifty October future closed with a premium of 11.20
point against a premium of 7.40 point in last trading
session. The November series closed at a premium of
34.25 point.
The INDIA VIX has decreased from 20.71 to 20.21.
At the same time, the PCR-OI of Nifty increased from 1.40
to 1.42.
Few of the liquid counters where we have seen high cost
of carry are SAIL, JINDALSTEL, SRTRANSFIN, PNB AND
RAMCOCEM.
OI Gainers
SCRIP OI
OI
CHG. (%)
PRICE
PRICE
CHG. (%)
NTPC 62511900 18.08 79.10 -4.22
GODREJCP 5533000 12.30 699.80 -2.03
RAMCOCEM 1618400 12.07 769.50 0.32
IDFCFIRSTB 163381000 11.66 31.25 -0.48
PVR 1916563 10.05 1245.60 0.21
MINDTREE 1929600 9.34 1552.00 -2.43
PNB 78372000 8.53 28.15 1.43
LICHSGFIN 11336000 8.44 286.45 -0.49
OI Losers
SCRIP OI
OI
CHG. (%)
PRICE
PRICE
CHG. (%)
HCLTECH 16759400 -7.95 890.45 -1.25
CADILAHC 6127000 -7.51 430.55 0.02
CANBK 18560000 -6.59 88.55 2.55
GLENMARK 7387600 -6.55 486.40 -1.08
MFSL 2189200 -6.18 595.90 1.85
ESCORTS 3342900 -5.97 1232.40 -0.65
TITAN 5637000 -5.36 1223.45 -0.51
SRF 648750 -5.01 4371.75 -0.05
Put-Call Ratio
SCRIP PCR-OI PCR-VOL
NIFTY 1.42 0.87
BANKNIFTY 0.93 0.80
RELIANCE 0.55 0.33
ICICIBANK 0.75 0.61
INFY 0.43 0.44
Historical Volatility
SCRIP HV
WIPRO 46.01
NTPC 39.54
COFORGE 69.20
NAUKRI 55.46
TATACONSUM 55.63
www.angelbroking.com
Technical & Derivatives Report
October 15, 2020
Note: Above mentioned Bullish or Bearish Spreads in Nifty (October Series) are given as an information and not as a recommendation.
Nifty Spot
=
11971.05
FII Statistics for October 14, 2020
Detail Buy
Net Contracts
Open Interest
Sell
Value
(in Cr.)
Change
INDEX
FUTURES
3530.49
4244.08
(713.59) 149471
12106.65
(1.03)
INDEX
OPTIONS
261880.03
259410.49
2469.54
979776
79015.76
1.66
STOCK
FUTURES
13344.76
13974.62
(629.86) 1120643
80572.77
(0.28)
STOCK
OPTIONS
6308.57
6241.82
66.75
101637
8212.17
3.08
Total 285063.85
283871.01
1192.84
2351527
179907.35
0.61
Turnover on October 14, 2020
Instrument
No. of
Contracts
Turnover
( in Cr. )
Change
(%)
Index Futures
4,69,318 32697.99 26.91
Index Options
3,00,67,075 21,47,054.57 56.42
Stock Futures
6,99,055 54185.77 -1.08
Stock Options
11,43,786 98646.43 3.06
Total 3,23,79,234 23,32,584.76 50.59
Bull-Call Spreads
Action Strike Price Risk Reward BEP
Buy 12000 154.25
46.60 53.40 12046.60
Sell 12100 107.65
Buy 12000 154.25
81.85 118.15 12081.85
Sell 12200 72.40
Buy 12100 107.65
35.25 64.75 12135.25
Sell 12200 72.40
Bear-Put Spreads
Action Strike Price Risk Reward BEP
Buy 12000 172.95
42.95 57.05 11957.05
Sell 11900 130.00
Buy 12000 172.95
77.90 122.10 11922.10
Sell 11800 95.05
Buy 11900 130.00
34.95 65.05 11865.05
Sell 11800 95.05
Nifty Put-Call Analysis
,0
500,000
1000,000
1500,000
2000,000
2500,000
3000,000
11400 11500 11600 11700 11800 11900 12000 12100 12200 12300 12400 12500 12600 12700
Call Put

www.angelbroking.com
Technical & Derivatives Report
October 15, 2020
Da
ily
Pivot Level
s for
Nifty Constituents
Scrips
S2
S1
PIVOT
R1
R2
ADANIPORTS
342
345
348
352
355
ASIANPAINT 2,040 2,056
2,071
2,086
2,101
AXISBANK
446
459
467
479
487
BAJAJ-AUTO 2,995 3,024
3,050
3,079
3,105
BAJFINANCE 3,179 3,276
3,329
3,425
3,479
BAJAJFINSV 5,743 5,922
6,033
6,212
6,323
BPCL
323
328
333
338
344
BHARTIARTL
406
410
415
418
423
BRITANNIA 3,715 3,753
3,777
3,814
3,839
CIPLA
753
767
781
795
809
COALINDIA
107
109
111
113
116
DIVISLAB 3,073 3,102
3,132
3,161
3,191
DRREDDY 5,016 5,069
5,145
5,198
5,273
EICHERMOT 2,160 2,207
2,237
2,284
2,314
GAIL
81
82
82
83
84
GRASIM
720
742
755
777
790
HCLTECH
866
878
894
907
923
HDFCBANK 1,1
62
1,187
1,200
1,225
1,239
HDFCLIFE
552
562
568
579
585
HDFC 1,893 1,936
1,963
2,006
2,033
HEROMOTOCO 3,242 3,276
3,305
3,339
3,368
HINDALCO
169
172
173
176
177
HINDUNILVR 2,117 2,138
2,151
2,172
2,185
ICICIBANK
381
394
402
414
422
IOC
73
74
75
76
77
INDUSINDBK
587
605
616
634
644
INFY 1,111 1,124
1,144
1,158
1,178
ITC
165
166
169
170
173
JSW STEEL
283
287
289
293
296
KOTAKBANK 1,311 1,332
1,345
1,366
1,379
LT
877
896
906
926
936
M&M
611
618
623
629
634
MARUTI 6,854 6,928
7,002
7,076
7,149
NESTLEIND 15,411
15,542
15,681
15,812
15,951
NTPC
75
77
80
82
85
ONGC
65
66
67
68
70
POWERGRID
154
155
158
160
163
RELIANCE 2,251 2,269
2,287
2,305
2,322
SBILIFE
763
787
800
824
837
SHREECEM 20,
367
20,752
21,036
21,420
21,704
SBIN
190
195
198
203
206
SUNPHARMA
487
495
501
509
515
TCS 2,759 2,784
2,813
2,839
2,868
TATAMOTORS
126
128
131
134
137
TATASTEEL
366
371
374
379
382
TECHM
828
838
856
867
884
TITAN 1,200 1,212 1,2
30
1,242
1,261
ULTRACEMCO 4,262 4,352
4,406
4,496
4,550
UPL
489
500
506
518
524
WIPRO
338
344
355
361
371

www.angelbroking.com
Technical & Derivatives Report
October 15, 2020
*
Research Team Tel: 022 – 39357600 (Extn. 6844) Website: www.angelbroking.com
For Technical Queries E-mail: technicalresearch-cso@angelbroking.com
DISCLAIMER
Angel Broking Limited (hereinafter referred to as “Angel”) is a registered Member of National Stock Exchange of India Limited, Bombay
Stock Exchange Limited and Metropolitan Stock Exchange Limited. It is also registered as a Depository Participant with CDSL and
Portfolio Manager and Investment Adviser with SEBI. It also has registration with AMFI as a Mutual Fund Distributor. Angel Broking
Limited is a registered entity with SEBI for Research Analyst in terms of SEBI (Research Analyst) Regulations, 2014 vide registration
number INH000000164. Angel or its associates has not been debarred/ suspended by SEBI or any other regulatory authority for
accessing /dealing in securities Market. Angel or its associates/analyst has not received any compensation / managed or co-managed
public offering of securities of the company covered by Analyst during the past twelve months.
This document is solely for the personal information of the recipient, and must not be singularly used as the basis of any investment
decision. Nothing in this document should be construed as investment or financial advice. Each recipient of this document should make
such investigations as they deem necessary to arrive at an independent evaluation of an investment in the securities of the companies
referred to in this document (including the merits and risks involved), and should consult their own advisors to determine the merits
and risks of such an investment.
Reports based on technical and derivative analysis center on studying charts of a stock's price movement, outstanding positions and
trading volume, as opposed to focusing on a company's fundamentals and, as such, may not match with a report on a company's
fundamentals. Investors are advised to refer the Fundamental and Technical Research Reports available on our website to evaluate the
contrary view, if any.
The information in this document has been printed on the basis of publicly available information, internal data and other reliable
sources believed to be true, but we do not represent that it is accurate or complete and it should not be relied on as such, as this
document is for general guidance only. Angel Broking Limited or any of its affiliates/ group companies shall not be in any way
responsible for any loss or damage that may arise to any person from any inadvertent error in the information contained in this report.
Angel Broking Limited has not independently verified all the information contained within this document. Accordingly, we cannot
testify, nor make any representation or warranty, express or implied, to the accuracy, contents or data contained within this document.
While Angel Broking Limited endeavors to update on a reasonable basis the information discussed in this material, there may be
regulatory, compliance, or other reasons that prevent us from doing so.
This document is being supplied to you solely for your information, and its contents, information or data may not be reproduced,
redistributed or passed on, directly or indirectly.
Technical and Derivatives Team:
Sameet Chavan Chief Analyst - Technical & Derivatives sameet.chavan@angelbroking.com
Ruchit Jain Senior Analyst - Technical & Derivatives ruchit.jain@angelbroking.com
Rajesh Bhosale Technical Analyst rajesh.bhosle@angelbroking.com
Sneha Seth Derivatives Analyst sneha.seth@angelbroking.com
