www.angelbroking.com
July 15
, 2021
Technical & Derivatives Report
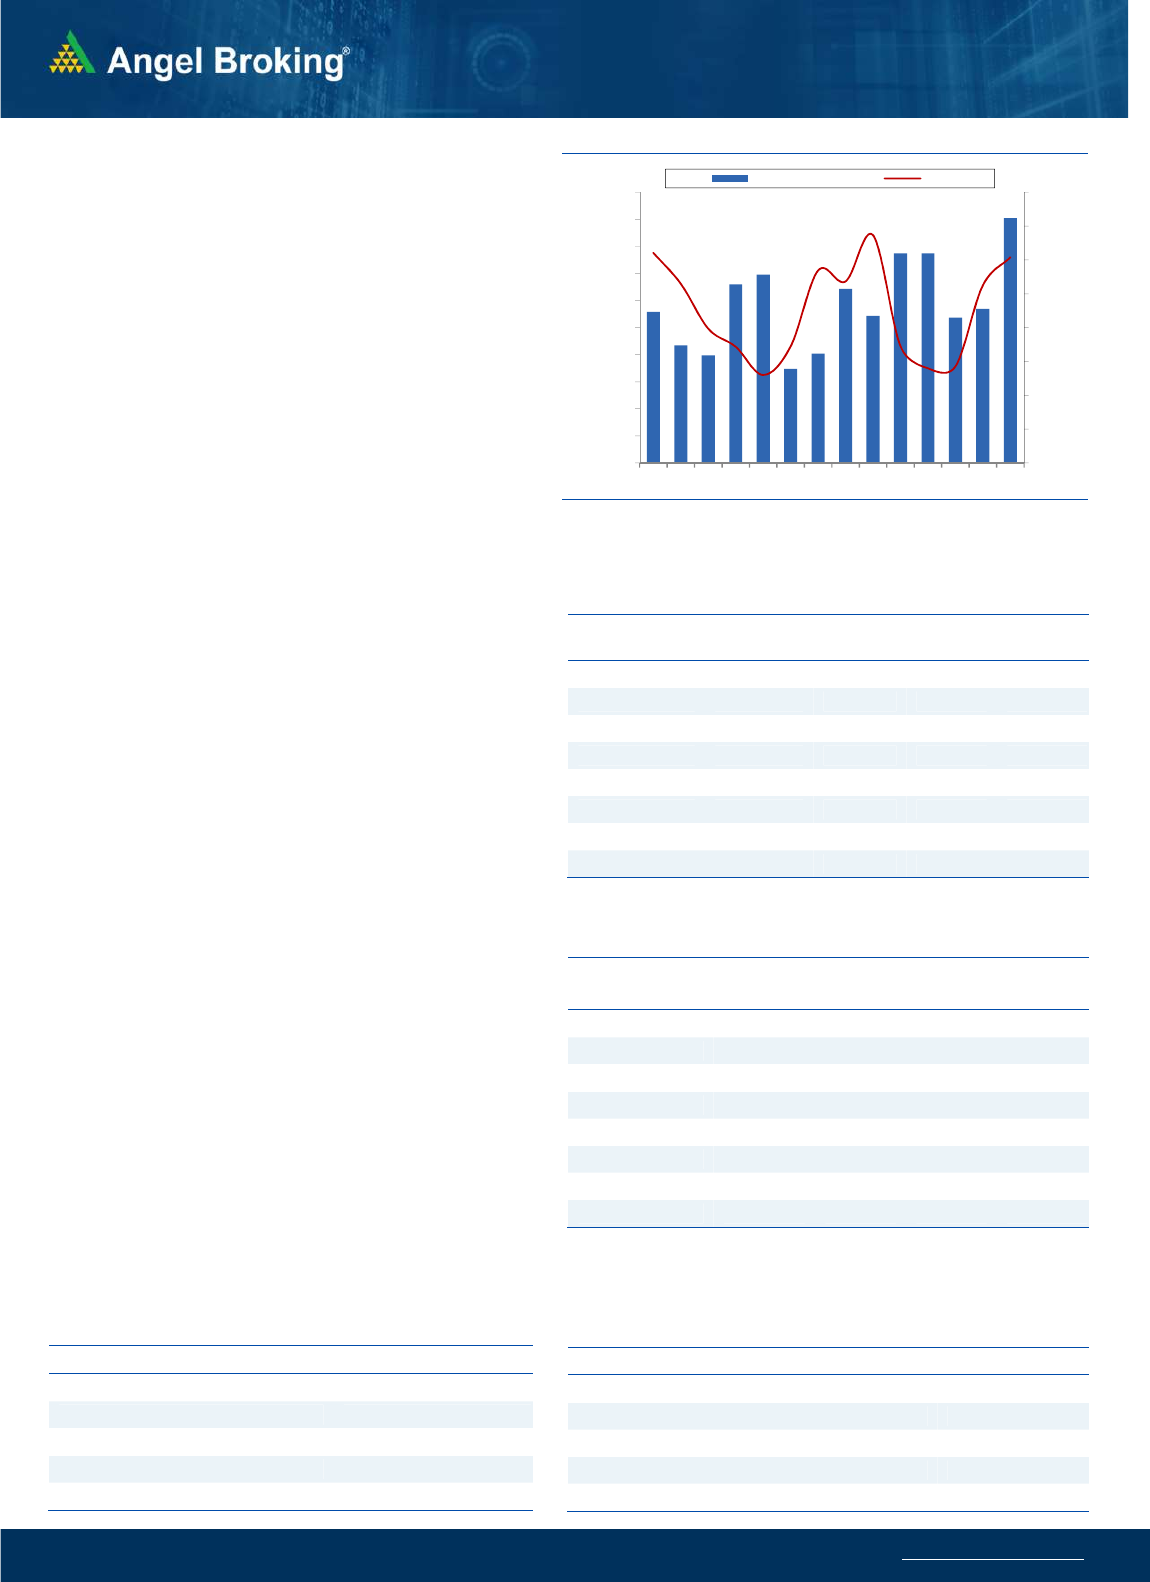
Nifty Bank Outlook
-
(3
5668
)
We had a dull start for the day in absent of any major trigger in the
global as well as domestic market. Post some hiccups in the initial
hour of trade, we witnessed smart buy interest to move towards
the recent upswing around 35800 mark. However, once again
attracted some profit booking at higher levels to eventually
conclude the day almost flat.
The banking index finally reclaim 35800 but failed to hold it on the
closing basis. However, the overall all chart structure still remains
optimistic and any sustainable move beyond 35800-36000 shall
fuel the next leg of rally towards the all-time highs. At this point in
time, all eyes on the banking index as follow-up activity in coming
sessions shall dictate the near term move. For today’s expiry, we
would suggest buying ATM call options in case the BankNifty
surpasses 35800.
Key Levels
Support 1 – 35400 Resistance 1 – 35800
Support 2 – 35250 Resistance 2 – 36000
Exhibit 1: Nifty Daily Chart
Exhibit 2: Nifty Bank Daily Chart
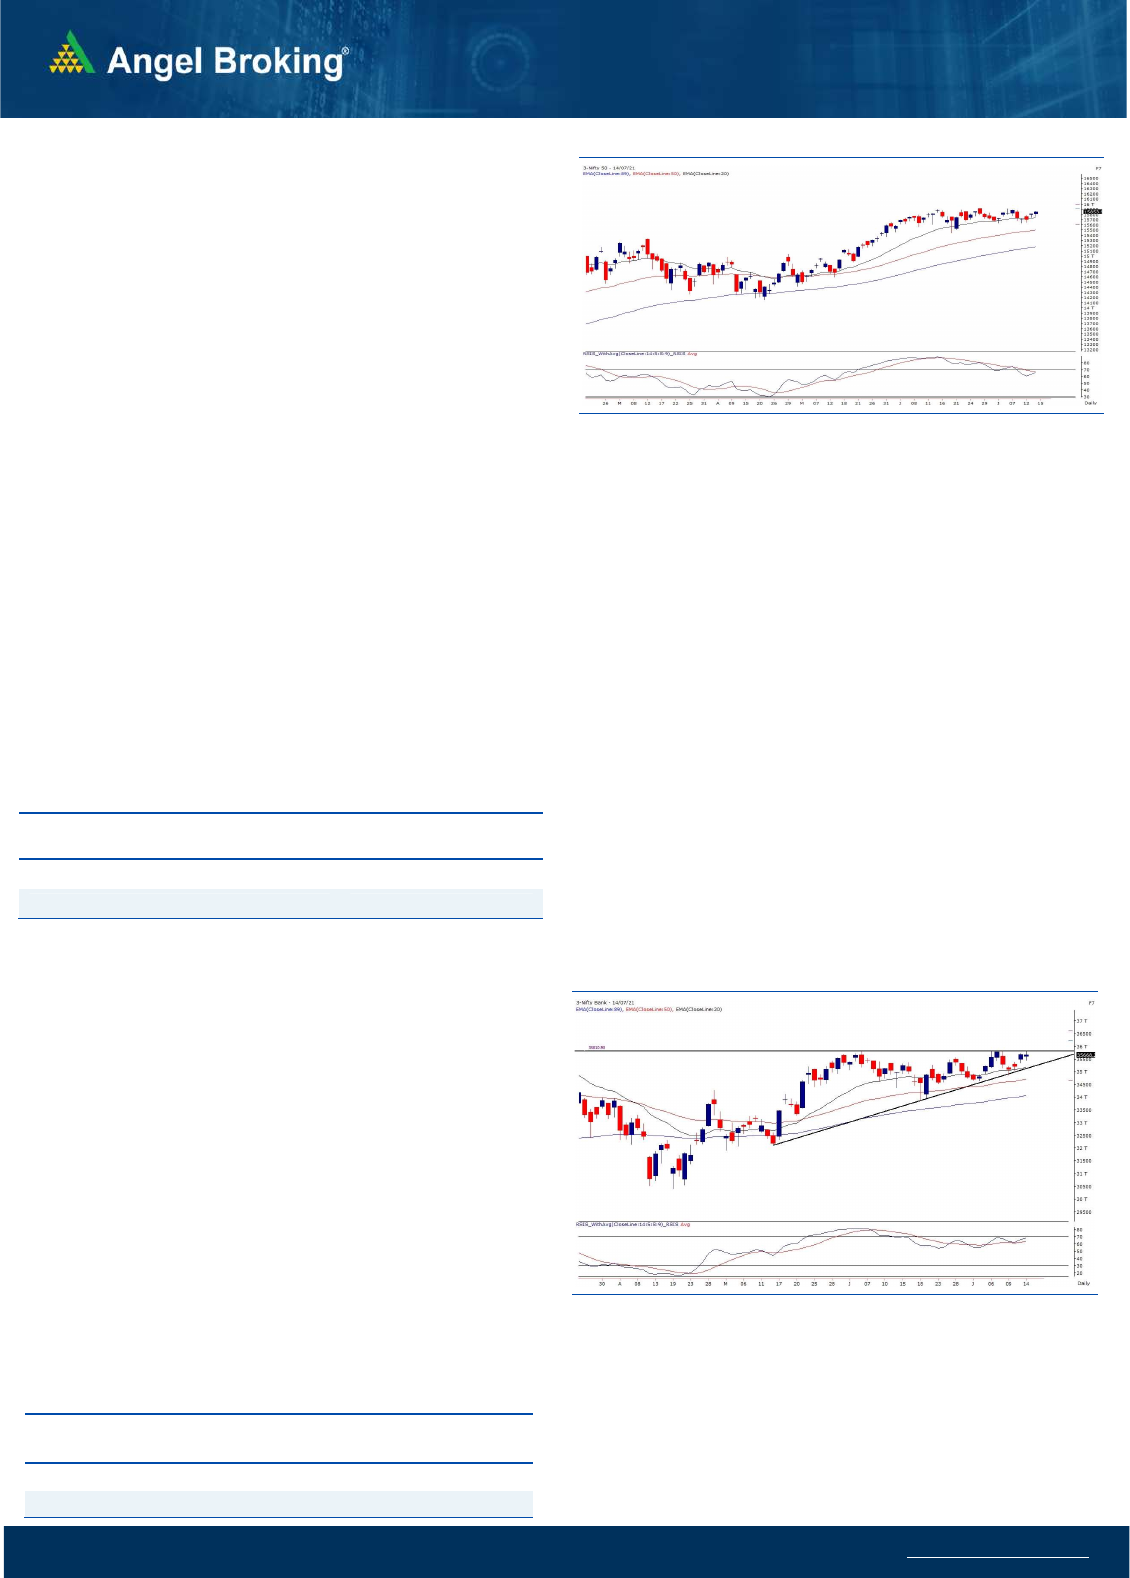
Sensex (52904) / Nifty (15854
)
We had a sluggish start yesterday on the back of muted global cues.
In the initial hour, Nifty corrected a bit to enter the sub-15800
territory. However, the intraday sheet anchor of 15750 provided solid
support to the benchmark, which resulted in a sustained up move for
the remaining part of the session. A smart surge in heavyweight IT
counters had the lion share in lifting the market higher from
important supports. Eventually Nifty managed to reclaim the 15850
mark on a closing basis.
Very seldom we witness such type of boredom in indices for a
continuous stretch of more than a month now. Nobody knows when
we would see indices coming out of this congestion zone. Yesterday,
if banking space had chipped in, we could have seen Nifty at new
high; but unfortunately this was not the case. For the coming session
15900 remains to be a sturdy wall and only a sustainable move
beyond this would conclude the slumber phase in our benchmark
indices. We reiterate, if this has to happen, BANKNIFTY needs to
contribute heavily.
Hence, all eyes on the important level of 35810; because a
sustainable move beyond this would confirm a breakout in this space,
which would then augur well for the market. On the lower side, 15750
– 15700 are to be seen as immediate support levels.
Key Levels
Support 1 – 15750 Resistance 1 – 15915
Support 2 – 15700 Resistance 2 – 16000
www.angelbroking.com
Technical & Derivatives Report
July 15
, 2021
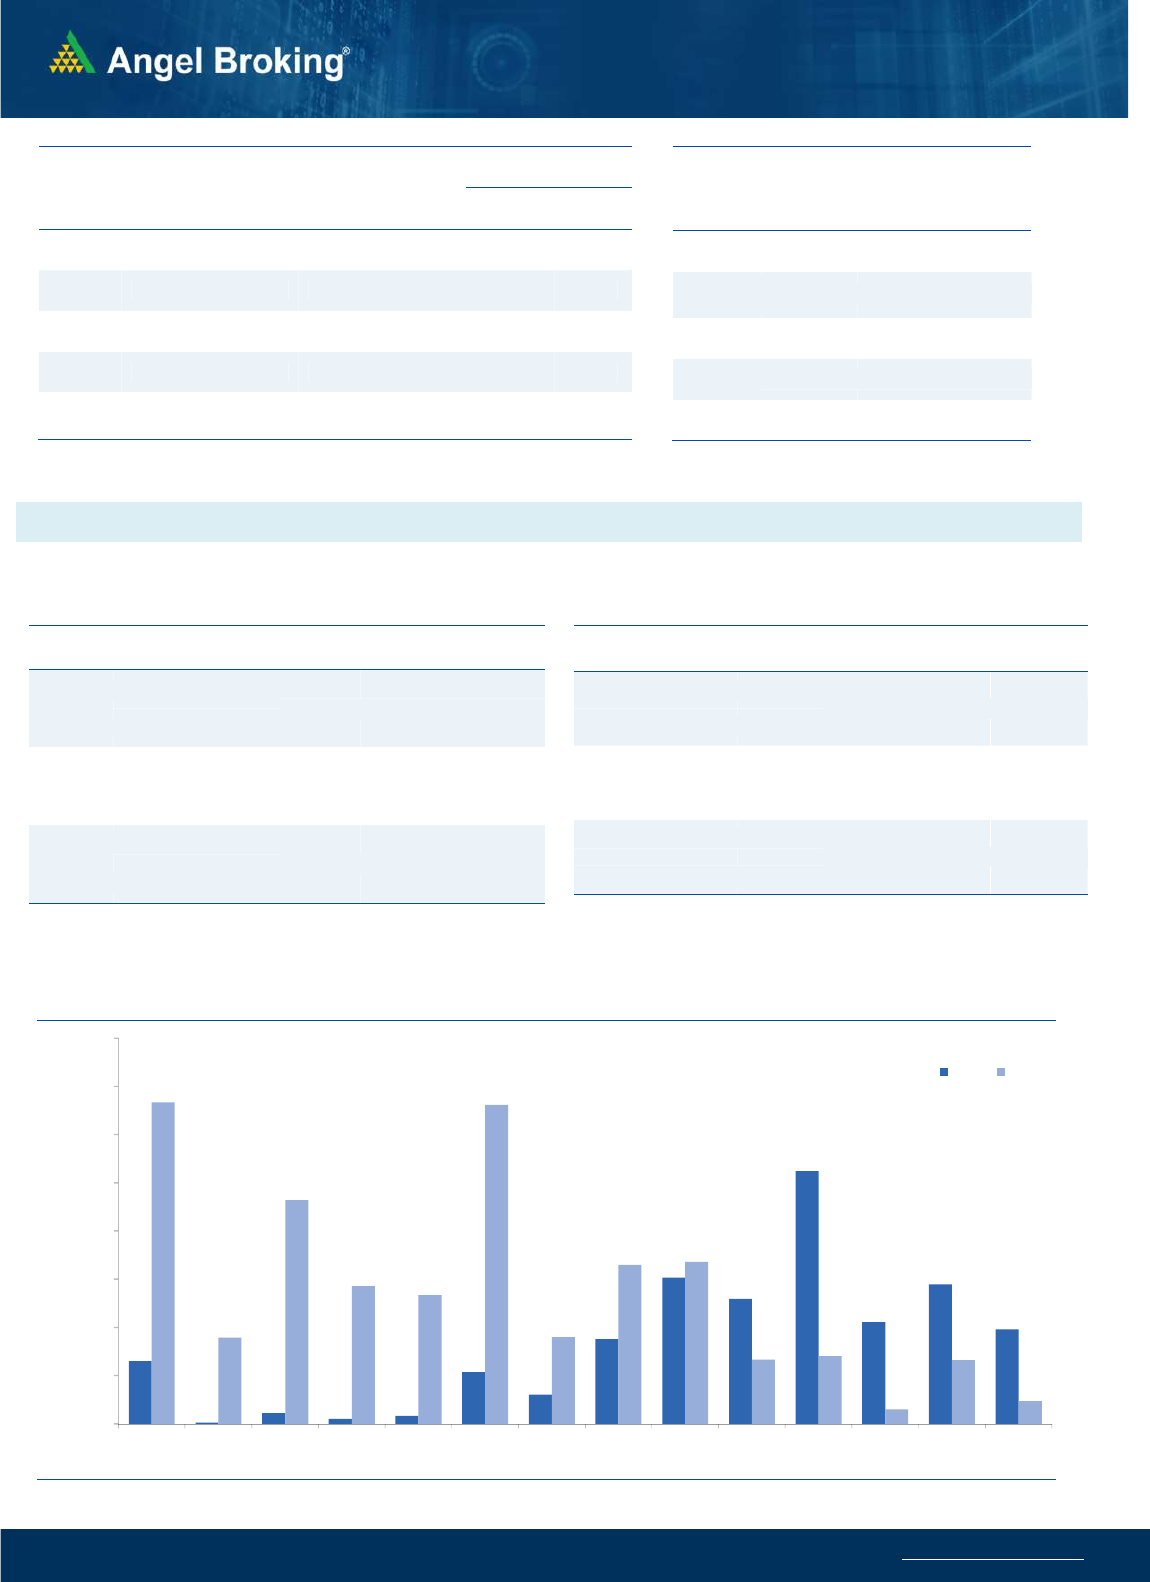
Nifty Vs OI
15550
15600
15650
15700
15750
15800
15850
15900
15950
95,000
96,000
97,000
98,000
99,000
100,000
101,000
102,000
103,000
104,000
105,000
6/25 6/29 7/1 7/5 7/7 7/9 7/13
(`000)
Openinterest Nifty
View
Our markets started the day on a flat note, but the
intraday dip witnessed some buying interest and we saw
a gradual upmove to end the day around 15850.
FIIs were net sellers in the cash segment to the tune of
Rs. 1304 crores. In index futures front, they bought worth
Rs 278 crores with increase in open interest indicating
long formations in yesterday’s session.
Nifty traded with a positive bias as some long formations
were seen in the index. Although FII's were net sellers in
the cash segment, they were buyers in the index futures
segment. During the week, initially call writers were
aggressively forming positions at 15800 strike, but as the
index surpassed that hurdle on Tuesday, they ran to cover
their positions. Now, 15800 put has highest open interest
indicating support level for the expiry day, while
resistances are seen at 15900 followed by 16000. One can
keep a close eye on BANKNIFTY and if the index sustains
above 35810 (spot level) for 5 - 10 mins, one can look to
buy ATM CALL for BANKNIFTY, because this
development will lead to a strong buying in the banking
space.
Comments
The Nifty futures open interest has increased by 3.33%.
Bank Nifty futures open interest has decreased by 1.57%
as market closed at 15853.95 levels.
The Nifty July future closed with a premium of 15.1 point
against a premium of 21.45 point in last trading session.
The August series closed at a premium of 48.4 point.
The INDIA VIX decreased from 12.62 to 12.59. At the
same time, the PCR-OI of Nifty increased from 1.10 to
1.23.
Few of the liquid counters where we have seen high cost
of carry are NMDC, IDEA, GRANULES, INDUSTOWER AND
TORNTPHARM.
OI Gainers
SCRIP OI
OI
CHG. (%)
PRICE
PRICE
CHG. (%)
MINDTREE 2956800 54.74 2703.05 8.46
IBULHSGFIN 35098200 22.65 270.45 -3.42
COROMANDEL 1008750 8.76 891.15 1.59
LTTS 553400 8.42 2910.95 3.01
ICICIGI 1084600 7.86 1531.65 -0.70
MARUTI 2221800 7.56 7326.80 -1.59
WIPRO 35915200 7.46 561.70 7.14
METROPOLIS 316000 6.54 2811.80 0.00
OI Losers
SCRIP OI
OI
CHG. (%)
PRICE
PRICE
CHG. (%)
MANAPPURAM 25098000 -7.86 186.05 0.51
GRANULES 14177850 -6.51 372.00 1.15
ASHOKLEY 36040500 -5.39 127.90 0.63
NMDC 83776800 -4.24 172.05 0.00
TRENT 1109975 -4.19 917.95 -0.97
LICHSGFIN 14782000 -4.10 471.55 1.85
SBILIFE 5453250 -3.98 1052.40 0.04
ADANIENT 15494000 -3.95 1402.00 -1.15
Put-Call Ratio
SCRIP PCR-OI PCR-VOL
NIFTY 1.23 0.94
BANKNIFTY 1.07 0.93
RELIANCE 0.42 0.33
ICICIBANK 0.76 0.59
INFY 0.50 0.38
Historical Volatility
SCRIP HV
MPHASIS 46.29
WIPRO 40.02
MINDTREE 49.09
LTI 45.60
COFORGE 59.83
www.angelbroking.com
Technical & Derivatives Report
July 15
, 2021
Note: Above mentioned Bullish or Bearish Spreads in Nifty (July Series) are given as an information and not as a recommendation.
Nifty Spot = 15853.95
FII Statistics for July 14, 2021
Detail Buy
Net Contracts
Open Interest
Sell
Value
(in Cr.)
Change
INDEX
FUTURES
3056.27
2778.49
277.78
138589
11312.46
2.94
INDEX
OPTIONS
411192.37
411092.20
100.17
1228582
109996.42
2.92
STOCK
FUTURES
10306.53
10261.73
44.80
1407675
112209.74
0.46
STOCK
OPTIONS
13217.48
13439.02
(221.54) 290569
23650.42
2.11
Total 437772.65
437571.44
201.21
3065415
257169.04
1.70
Turnover on July 14, 2021
Instru
ment
No. of
Contracts
Turnover
( in Cr. )
Change
(%)
Index Futures 2,15,180 18197.34 -20.06
Index
Options
4,59,84,081 45,66,676.64
23.26
Stock Futures 5,69,255 46990.23 4.65
Stock
Options
19,10,394 1,63,133.24 17.44
Total 4,86,78,910 47,94,997.45
22.59
Bull-Call Spreads
Action Strike Price Risk Reward BEP
Buy 15800 186.60
56.90 43.10 15856.90
Sell 15900 129.70
Buy 15800 186.60
101.75 98.25 15901.75
Sell 16000 84.85
Buy 15900 129.70
44.85 55.15 15944.85
Sell 16000 84.85
Bear-Put Spreads
Action Strike Price Risk Reward BEP
Buy 15800 117.80
32.20 67.80 15767.80
Sell 15700 85.60
Buy 15800 117.80
54.50 145.50 15745.50
Sell 15600 63.30
Buy 15700 85.60
22.30 77.70 15677.70
Sell 15600 63.30
Nifty Put-Call Analysis
,0
500,000
1000,000
1500,000
2000,000
2500,000
3000,000
3500,000
4000,000
15000 15100 15200 15300 15400 15500 15600 15700 15800 15900 16000 16100 16200 16300
Call Put

www.angelbroking.com
Technical & Derivatives Report
July 15
, 2021
Daily Pivot Levels for Nifty Constituents
Scrips
S2
S1
PIVOT
R1
R2
ADANIPORTS
685
691
701
707
718
ASIANPAINT 2,974 2,988
2,998
3,012
3,022
AXISBANK
760
765
769
774
779
BAJAJ-AUTO 3,903 3,928
3,966
3,991
4,029
BAJFINANCE 6,083 6,109
6,145
6,171
6,207
BAJAJFINSV 12,777
12,884
12,959
13,066
13,140
BPCL
445
447
450
452
455
BHARTIARTL
525
527
529
532
534
BRITANNIA 3,442 3,464
3,476
3,498
3,510
CIPLA
955
966
972
983
990
COALINDIA
146
147
148
149
150
DIVISLAB 4,547 4,585
4,623
4,662
4,700
DRREDDY 5,314 5,353
5,406
5,444
5,497
EICHERMOT 2,674 2,687
2,701
2,713
2,727
GRASIM 1,553 1,561
1,570
1,577
1,587
HCLTECH
959
974
984
999
1,008
HDFCBANK 1,483 1,491
1,499
1,507
1,515
HDFCLIFE
682
685
691
694
700
HDFC 2,502 2,516
2,531
2,545
2,560
HEROMOTOCO 2,882 2,891
2,906
2,915
2,930
HINDALCO
389
390
392
394
396
HINDUNILVR 2,389 2,402
2,422
2,434
2,454
ICICIBANK
654
659
664
669
673
IOC
106
106
107
108
109
INDUSINDBK 1,042 1,047
1,054
1,059
1,066
INFY 1,521 1,549
1,566
1,594
1,611
ITC
200
202
204
206
207
JSW STEEL
689
694
700
706
712
KOTAKBANK 1,725 1,737
1,747
1,759
1,770
LT 1,492 1,519
1,534
1,560
1,576
M&M
773
780
783
790
793
MARUTI 7,223 7,275
7,362
7,414
7,501
NESTLEIND 17,412
17,476
17,584
17,648
17,756
NTPC
119
120
121
121
122
ONGC
119
120
121
122
123
POWERGRID
227
228
230
231
233
RELIANCE 2,066 2,076
2,091
2,101
2,117
SBILIFE 1,040 1,046
1,053
1,060
1,067
SHREECEM 27,625
28,020
28,255
28,650
28,885
SBIN
424
428
430
433
436
SUNPHARMA
675
681
686
692
698
TCS 3,170 3,192
3,207
3,229
3,244
TATACONSUM
756
762
769
775
783
TATAMOTORS
306
308
311
312
315
TATASTEEL 1,208 1,227
1,237
1,255
1,266
TECHM 1,037 1,058
1,069
1,090
1,101
TITAN 1
,691
1,701
1,715
1,724
1,738
ULTRACEMCO 6,967 7,042
7,141
7,216
7,315
UPL
812
816
822
825
831
WIPRO
513
537
550
575
588

www.angelbroking.com
Technical & Derivatives Report
July 15
, 2021
*
Research Team Tel: 022 – 39357600 (Extn. 6844) Website: www.angelbroking.com
For Technical Queries E-mail: technicalresearch-cso@angelbroking.com
DISCLAIMER
Angel Broking Limited (hereinafter referred to as “Angel”) is a registered Member of National Stock Exchange of India Limited, Bombay
Stock Exchange Limited and Metropolitan Stock Exchange Limited. It is also registered as a Depository Participant with CDSL and
Portfolio Manager and Investment Adviser with SEBI. It also has registration with AMFI as a Mutual Fund Distributor. Angel Broking
Limited is a registered entity with SEBI for Research Analyst in terms of SEBI (Research Analyst) Regulations, 2014 vide registration
number INH000000164. Angel or its associates has not been debarred/ suspended by SEBI or any other regulatory authority for
accessing /dealing in securities Market. Angel or its associates/analyst has not received any compensation / managed or co-managed
public offering of securities of the company covered by Analyst during the past twelve months.
This document is solely for the personal information of the recipient, and must not be singularly used as the basis of any investment
decision. Nothing in this document should be construed as investment or financial advice. Each recipient of this document should make
such investigations as they deem necessary to arrive at an independent evaluation of an investment in the securities of the companies
referred to in this document (including the merits and risks involved), and should consult their own advisors to determine the merits
and risks of such an investment.
Reports based on technical and derivative analysis center on studying charts of a stock's price movement, outstanding positions and
trading volume, as opposed to focusing on a company's fundamentals and, as such, may not match with a report on a company's
fundamentals. Investors are advised to refer the Fundamental and Technical Research Reports available on our website to evaluate the
contrary view, if any.
The information in this document has been printed on the basis of publicly available information, internal data and other reliable
sources believed to be true, but we do not represent that it is accurate or complete and it should not be relied on as such, as this
document is for general guidance only. Angel Broking Limited or any of its affiliates/ group companies shall not be in any way
responsible for any loss or damage that may arise to any person from any inadvertent error in the information contained in this report.
Angel Broking Limited has not independently verified all the information contained within this document. Accordingly, we cannot
testify, nor make any representation or warranty, express or implied, to the accuracy, contents or data contained within this document.
While Angel Broking Limited endeavors to update on a reasonable basis the information discussed in this material, there may be
regulatory, compliance, or other reasons that prevent us from doing so.
This document is being supplied to you solely for your information, and its contents, information or data may not be reproduced,
redistributed or passed on, directly or indirectly.
Technical and Derivatives Team:
Sameet Chavan Chief Analyst - Technical & Derivatives sameet.chavan@angelbroking.com
Ruchit Jain Senior Analyst - Technical & Derivatives ruchit.jain@angelbroking.com
Rajesh Bhosale Technical Analyst rajesh.bhosle@angelbroking.com
Sneha Seth Derivatives Analyst sneha.seth@angelbroking.com
