www.angelbroking.com
June 15, 2021
Technical & Derivatives Report
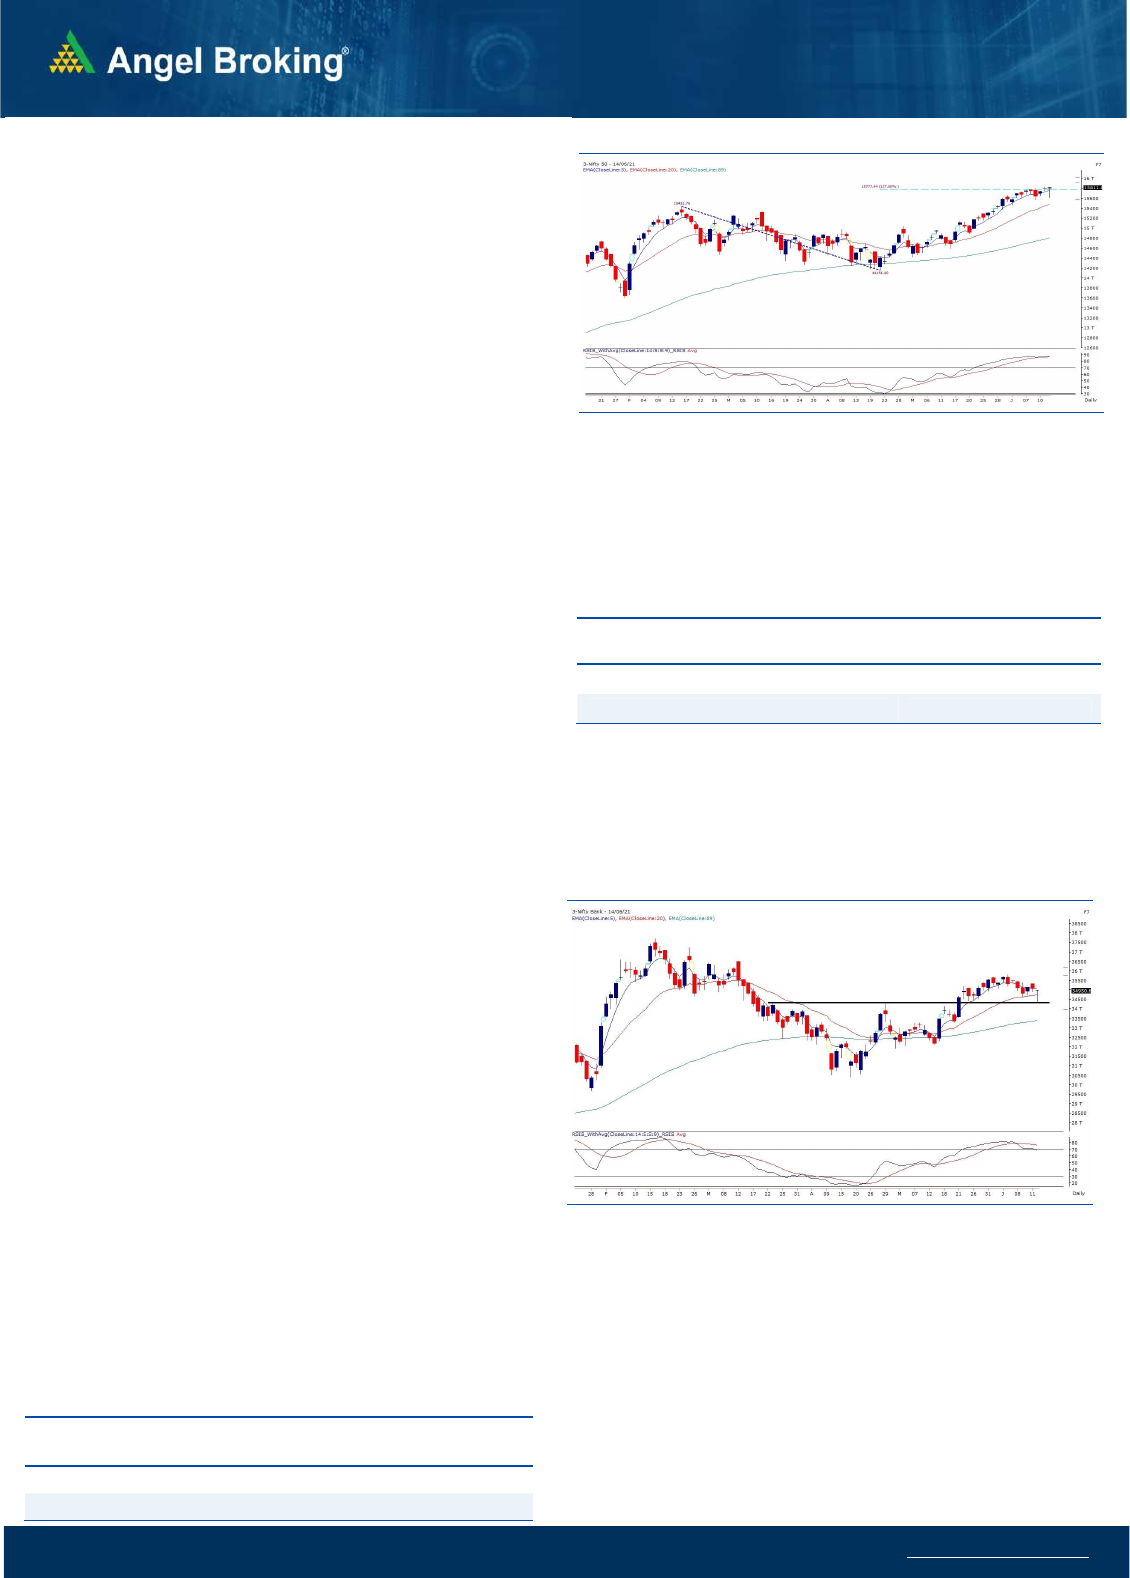
Exhibit 1: Nifty Daily Chart
Nifty
Bank Out
look
-
(
34951)
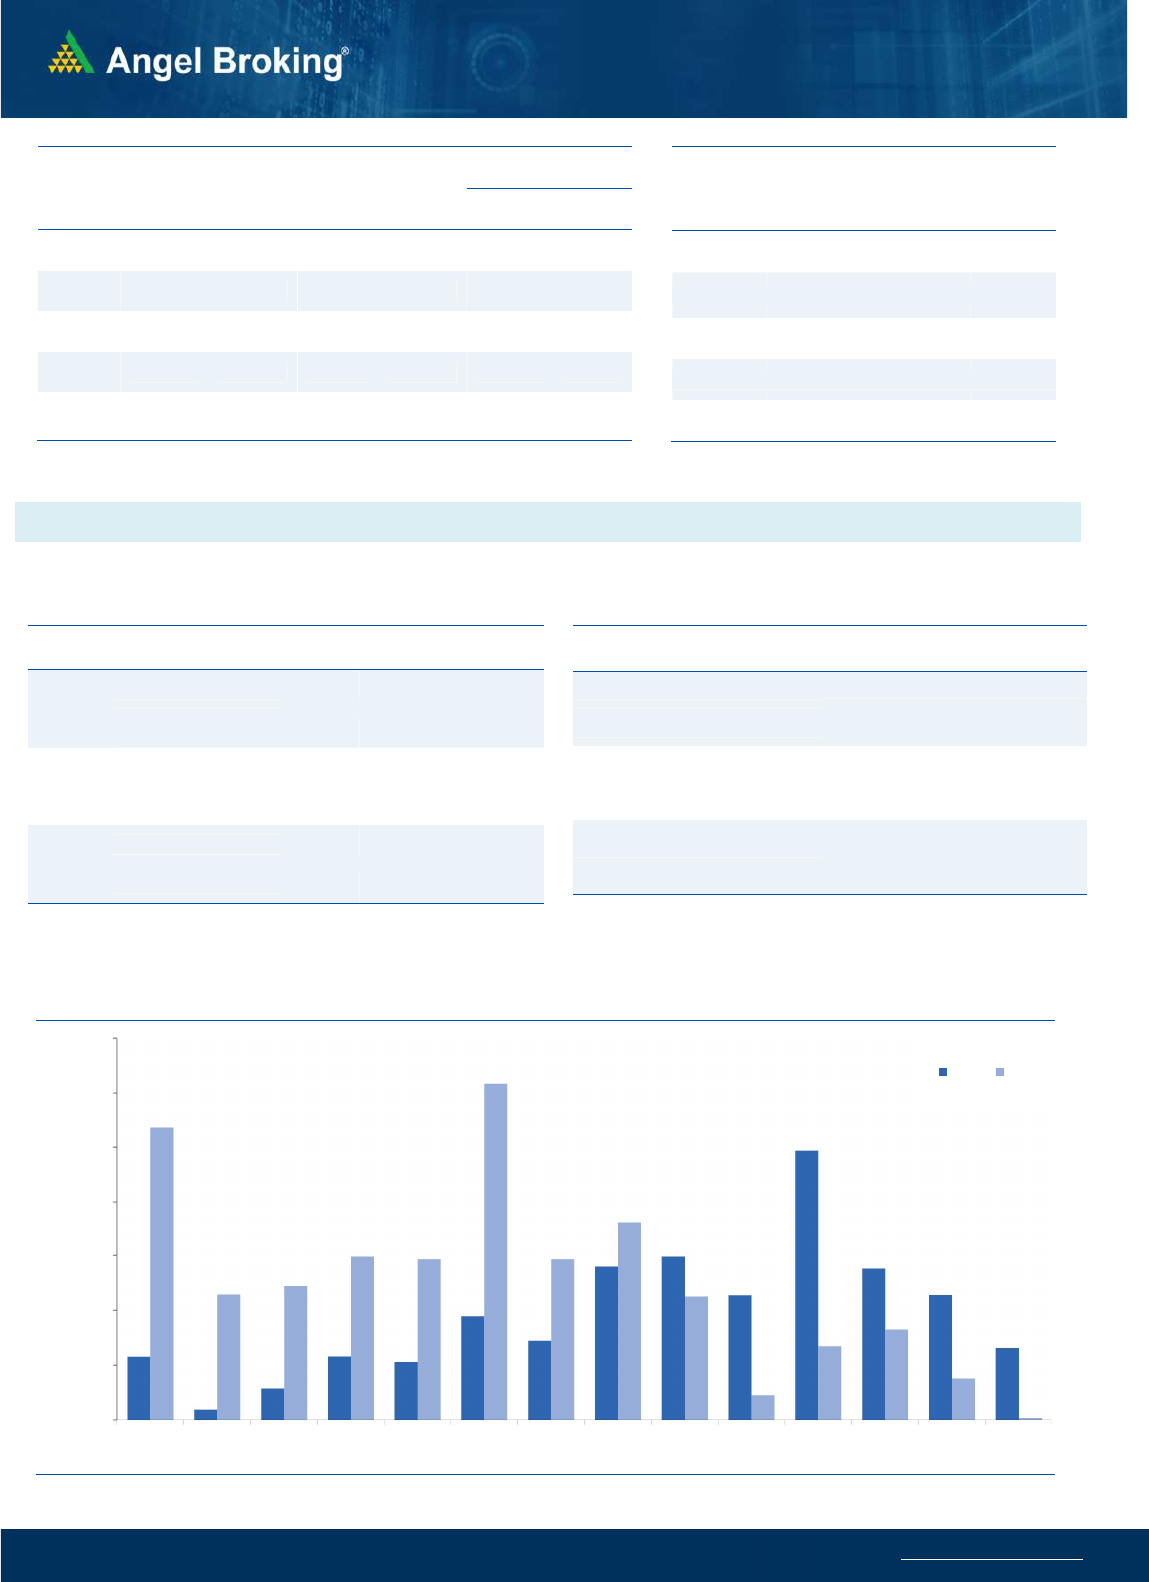
The BankNifty began the week slightly lower and fresh selling
pressure was witnessed from the word go to drag the index 34400
mark. Post some consolidation, the demand picked-up and smart
recovery was seen to almost reclaim 35000. Finally, we ended the
volatile day with the cut of 0.28% tad below 35000 mark.
Recently, the banking index has been taking support around the
20 DEMA. Yesterday, we saw index breaching this support zone due
to sharp sell-off seen in the initial hour of trade; however, the
BankNifty managed to recoup all the losses to close above the 20
DEMA and its previous breakout levels seen at the previous swing
high around 34300 and has ended around the highest point
forming a ‘Dragon Fly Doji’. As mentioned above, if the Bank Nifty
manages to break above 35350 then we may see a bounce-
back move in this space that can fuel the next leg of the rally for
the Nifty. At this point in time, we would stick to our recent advise
of being light in index.
Key Levels
Support 1 – 34500 Resistance 1 – 35350
Support 2 – 34300 Resistance 2 – 35500
Exhibit 2: Nifty Bank Daily Chart
We continue to believe that being selective and avoiding aggressive
bets remains a pragmatic approach. As far as levels are concerned,
15730 followed by 15600 remains strong support whereas on the
flip side, every 100 points should be treated as immediate resistance
and now these levels come to 15900 – 16000.
Key Levels
Support 1 – 15730 Resistance 1 – 15900
Support 2 – 15600 Resistance 2 – 16000
Se
nsex
(
52552)
/ Nifty
(
15812
)
Our markets started the fresh week on a flat note; however, before
anyone could realize Nifty was down around 200 points within the
first half an hour to test the levels of 15600. This was followed by a
bounce back and then consolidation for the major part of the first
half. Subsequently, in the second half bulls again picked up
momentum to erase all the morning losses and ended marginally in
the green tad above 15800 levels.
Technically, not much has changed from Friday’s close and in fact, the
Nifty has been hovering around the 15800 mark for the last one
week. If we observe the intraday hourly chart, the Nifty is gyrating
within a range where 15600 is acting as strong support whereas on
the higher side some tentativeness is seen around the 15800 levels.
The bulls are still adamant as one or another sector is holding the
markets up and dips are getting bought. However, we continue to
have a view that if the benchmark has to test the levels of 16000 and
beyond then the banking space needs to participate which has been
an underperformer recently. Having said that, the Bank Nifty
managed to hold on to its previous breakout levels seen at the
previous swing high around 34300 and has ended around the highest
point forming a ‘Dragon Fly Doji’. For the coming sessions, if the Bank
Nifty manages to break above 35350 then we may see a bounce-
back move in the banking space that can fuel the next leg of the rally
for the benchmark. However, if it fails then we may continue to see
lethargic moves in the Nifty.

www.angelbroking.com
Technical & Derivatives Report
June 15, 2021
Nifty Vs OI
14800
14900
15000
15100
15200
15300
15400
15500
15600
15700
15800
15900
,0
20,000
40,000
60,000
80,000
100,000
120,000
140,000
5/24 5/26 5/28 6/1 6/3 6/7 6/9 6/11
(`000)
Openinterest Nifty
View
Nifty started the day on a flat note but the volatility
surged in the initial hour and Nifty corrected towards the
15600 mark. However, the index witnessed a
gradual pullback from the lows and it recouped all the
losses to end marginally in green above 15800
.
FIIs were net sellers in the cash segment to the tune of
Rs. 504 crores. In index futures front, they sold worth Rs.
2638 crores with fall in open interest indicating long
unwinding and short formations in yesterday’s session.
Inspite of the volatility yesterday, we hardly saw any fresh
positions in Nifty, while decent unwinding was seen in
the banking index. FII's were net sellers in the cash
segment while they unwound some of their index futures
longs. Their 'Long Short Ratio' is still around 75 percent.
In options segment, highest open interest is seen around
16000 call and 15700 put options. A lot of unwinding was
seen in stocks in yesterday's session and hence, traders
are advised to be selective and avoid aggressive
positions.
C
o
mme
n
t
s
The Nifty futures open interest has decreased by 1.08%.
Bank Nifty futures open interest has decreased by 7.33%
as market closed at 15811.85 levels.
The Nifty June future closed with a premium of 20.80
point against a premium of 17.95 point in last trading
session. The July series closed at a premium of 68.05
point.
The INDIA VIX increased from 14.12 to 14.71.
At the same time, the PCR-OI of Nifty increased from 1.35
to 1.42.
Few of the liquid counters where we have seen high cost
of carry are IDEA, IGL, COFORGE, GODREJPROP, AND
CONCOR.
OI Gainers
SCRIP OI
OI
CHG. (%)
PRICE
PRICE
CHG. (%)
POWERGRID 20648000 9.85 248.70 1.14
VOLTAS 3085500 9.57 1043.05 -0.56
ADANIPORTS 87913750 9.07 768.45 -8.55
DLF 39200700 5.31 299.20 -3.76
PNB 349728000 5.10 43.05 2.25
CUB 10877900 4.72 169.85 0.29
ONGC 69608000 4.71 124.80 1.29
KOTAKBANK 13534400 4.43 1768.05 -1.21
OI Losers
SCRIP OI
OI
CHG. (%)
PRICE
PRICE
CHG. (%)
BHEL 97398000 -12.75 67.40 -11.54
IBULHSGFIN 28352600 -12.67 298.50 3.88
AUBANK 2203500 -12.49 1070.00 1.79
BAJFINANCE 3693250 -5.95 6194.15 1.19
TATACHEM 8516000 -5.75 738.30 -0.09
HINDALCO 25542000 -5.69 394.80 0.11
MANAPPURAM 27900000 -4.91 165.35 0.58
SUNTV 12598500 -4.50 514.70 -3.09
Put-Call Ratio
SCRIP PCR-OI PCR-VOL
NIFTY 1.42 0.92
BANKNIFTY 0.69 0.87
RELIANCE 0.49 0.30
ICICIBANK 0.47 0.46
INFY 0.59 0.36
Historical Volatility
SCRIP HV
ADANIPORTS 51.09
BHEL 72.16
ADANIENT 65.38
TORNTPHARM 38.50
LUPIN 42.88
www.angelbroking.com
Technical & Derivatives Report
June 15, 2021
Note: Above mentioned Bullish or Bearish Spreads in Nifty (June Series) are given as an information and not as a recommendation.
Nifty Spot =
15811.85
FII Statistics for June 14, 2021
Detail Buy
Net Contracts
Open Interest
Sell
Value
(in Cr.)
Change
I
NDEX
FUTURES
2755.67
5393.22
(2637.55) 103302
11569.30
(10.06)
INDEX
OPTIONS
302251.44
298112.38
4139.06
961944
99581.01
11.06
STOCK
FUTURES
14423.39
13645.33
778.06
1408782
113466.59
0.48
STOCK
OPTIONS
27728.23
27746.55
(18.32) 336982
26511.74
1.93
Total 347158.73
344897.48
2261.25
2811010
251128.64
3.59
Turnover on June 14, 2021
Instru
ment
No. of
Contracts
Turnover
( in Cr. )
Change
(%)
Index Futures
2,70,536 26947.96 32.98
Index Options
3,05,02,775 30,41,038.39 53.16
Stock Futures
9,14,655 77767.09 14.62
Stock Options
32,09,540 2,81,359.28 12.63
Total 3,48,97,506 34,27,112.72 47.50
Bull-Call Spreads
Action Strike Price Risk Reward BEP
Buy 15800 154.40
52.30 47.70 15852.30
Sell 15900 102.10
Buy 15800 154.40
91.85 108.15 15891.85
Sell 16000 62.55
Buy 15900 102.10
39.55 60.45 15939.55
Sell 16000 62.55
Bear-Put Spreads
Action Strike Price Risk Reward BEP
Buy 15800 125.55
36.45 63.55 15763.55
Sell 15700 89.10
Buy 15800 125.55
63.30 136.70 15736.70
Sell 15600 62.25
Buy 15700 89.10
26.85 73.15 15673.15
Sell 15600 62.25
Nifty Put-Call Analysis
,0
500,000
1000,000
1500,000
2000,000
2500,000
3000,000
3500,000
15000 15100 15200 15300 15400 15500 15600 15700 15800 15900 16000 16100 16200 16300
Call Put

www.angelbroking.com
Technical & Derivatives Report
June 15, 2021
Da
ily
Pivot Level
s for
Nifty Constituents
Scrips
S2
S1
PIVOT
R1
R2
ADANIPORTS
642
705
744
808
847
ASIANPAINT 2,892 2,921
2,945
2,974
2,999
AXISBANK
718
727
734
743
751
BAJAJ-AUTO 4,088 4,117
4,156
4,186
4,225
BAJFINANCE 5,866 6,030
6,140
6,304
6,413
BAJAJFINSV 11,528
11,727
11,871
12,070
12,214
BPCL
473
478
482
487
491
BHARTIARTL
525
532
537
544
548
BRITANNIA 3,479 3,535
3,567
3,623
3,654
CIPLA
949
962
971
984
993
COALINDIA
151
155
160
164
168
DIVISLAB 4,271 4,329
4,370
4,428
4,469
DRREDDY 5,304 5,383
5,449
5,528
5,594
EICHERMOT 2,682 2,713
2,743
2,774
2,803
GRASIM 1,442 1,468
1,483
1,508
1,523
HCLTECH
970
977
983
990
995
HDFCBANK 1,453 1,466
1,476
1,489
1,499
HDFCLIFE
670
676
680
686
691
HDFC 2,490 2,515
2,537
2,562
2,584
HEROMOTOCO 2,908 2,947
2,982
3,021
3,056
HINDALCO
375
385
391
401
407
HINDUNILVR 2,320 2,342
2,359
2,381
2,397
ICICIBANK
619
627
632
640
644
IOC
111
113
114
116
118
INDUSINDBK
981
1,003
1,015
1,037
1,050
INFY 1,441 1,451
1,464
1,475
1,488
ITC
204
206
207
209
210
JSW STEEL
704
717
727
739
750
KOTAKBANK 1,742 1,755
1,772
1,785
1,803
LT 1,463 1,489
1,504
1,531
1,546
M&M
788
798
804
813
819
MARUTI 7,044 7,111
7,162
7,229
7,280
NESTLEIND 17,329
17,453
17,542
17,666
17,754
NTPC
115
117
118
119
120
ONGC
119
122
124
127
129
POWERGRID
239
244
247
252
255
RELIANCE 2,170 2,207
2,233
2,270
2,296
SBILIFE
962
974
983
995
1,005
SHREECEM 27,524
27,929
28,157
28,562
28,790
SBIN
411
421
427
436
442
SUNPHARMA
665
671
677
683
690
TCS 3,247 3,262
3,285
3,300
3,323
TATACONSUM
697
706
711
720
726
TATAMOTORS
335
345
352
362
368
TATASTEEL 1,123 1,144
1,161
1,182
1,200
TECHM 1,048 1,058
1,069
1,080
1,090
TITAN 1,702 1,719
1,729
1,746
1,756
ULTRACEMCO 6,542 6,610
6,648
6,716
6,754
UPL
806
820
829
843
852
WIPRO
549
555
559
565
569

www.angelbroking.com
Technical & Derivatives Report
June 15, 2021
*
Research Team Tel: 022 – 39357600 (Extn. 6844) Website: www.angelbroking.com
For Technical Queries E-mail: technicalresearch-cso@angelbroking.com
DISCLAIMER
Angel Broking Limited (hereinafter referred to as “Angel”) is a registered Member of National Stock Exchange of India Limited, Bombay
Stock Exchange Limited and Metropolitan Stock Exchange Limited. It is also registered as a Depository Participant with CDSL and
Portfolio Manager and Investment Adviser with SEBI. It also has registration with AMFI as a Mutual Fund Distributor. Angel Broking
Limited is a registered entity with SEBI for Research Analyst in terms of SEBI (Research Analyst) Regulations, 2014 vide registration
number INH000000164. Angel or its associates has not been debarred/ suspended by SEBI or any other regulatory authority for
accessing /dealing in securities Market. Angel or its associates/analyst has not received any compensation / managed or co-managed
public offering of securities of the company covered by Analyst during the past twelve months.
This document is solely for the personal information of the recipient, and must not be singularly used as the basis of any investment
decision. Nothing in this document should be construed as investment or financial advice. Each recipient of this document should make
such investigations as they deem necessary to arrive at an independent evaluation of an investment in the securities of the companies
referred to in this document (including the merits and risks involved), and should consult their own advisors to determine the merits
and risks of such an investment.
Reports based on technical and derivative analysis center on studying charts of a stock's price movement, outstanding positions and
trading volume, as opposed to focusing on a company's fundamentals and, as such, may not match with a report on a company's
fundamentals. Investors are advised to refer the Fundamental and Technical Research Reports available on our website to evaluate the
contrary view, if any.
The information in this document has been printed on the basis of publicly available information, internal data and other reliable
sources believed to be true, but we do not represent that it is accurate or complete and it should not be relied on as such, as this
document is for general guidance only. Angel Broking Limited or any of its affiliates/ group companies shall not be in any way
responsible for any loss or damage that may arise to any person from any inadvertent error in the information contained in this report.
Angel Broking Limited has not independently verified all the information contained within this document. Accordingly, we cannot
testify, nor make any representation or warranty, express or implied, to the accuracy, contents or data contained within this document.
While Angel Broking Limited endeavors to update on a reasonable basis the information discussed in this material, there may be
regulatory, compliance, or other reasons that prevent us from doing so.
This document is being supplied to you solely for your information, and its contents, information or data may not be reproduced,
redistributed or passed on, directly or indirectly.
Technical and Derivatives Team:
Sameet Chavan Chief Analyst - Technical & Derivatives sameet.chavan@angelbroking.com
Ruchit Jain Senior Analyst - Technical & Derivatives ruchit.jain@angelbroking.com
Rajesh Bhosale Technical Analyst rajesh.bhosle@angelbroking.com
Sneha Seth Derivatives Analyst sneha.seth@angelbroking.com
