www.angelbroking.com
January 15, 2021
Technical & Derivatives Report
Nifty
Bank Out
look
-
(
32520)
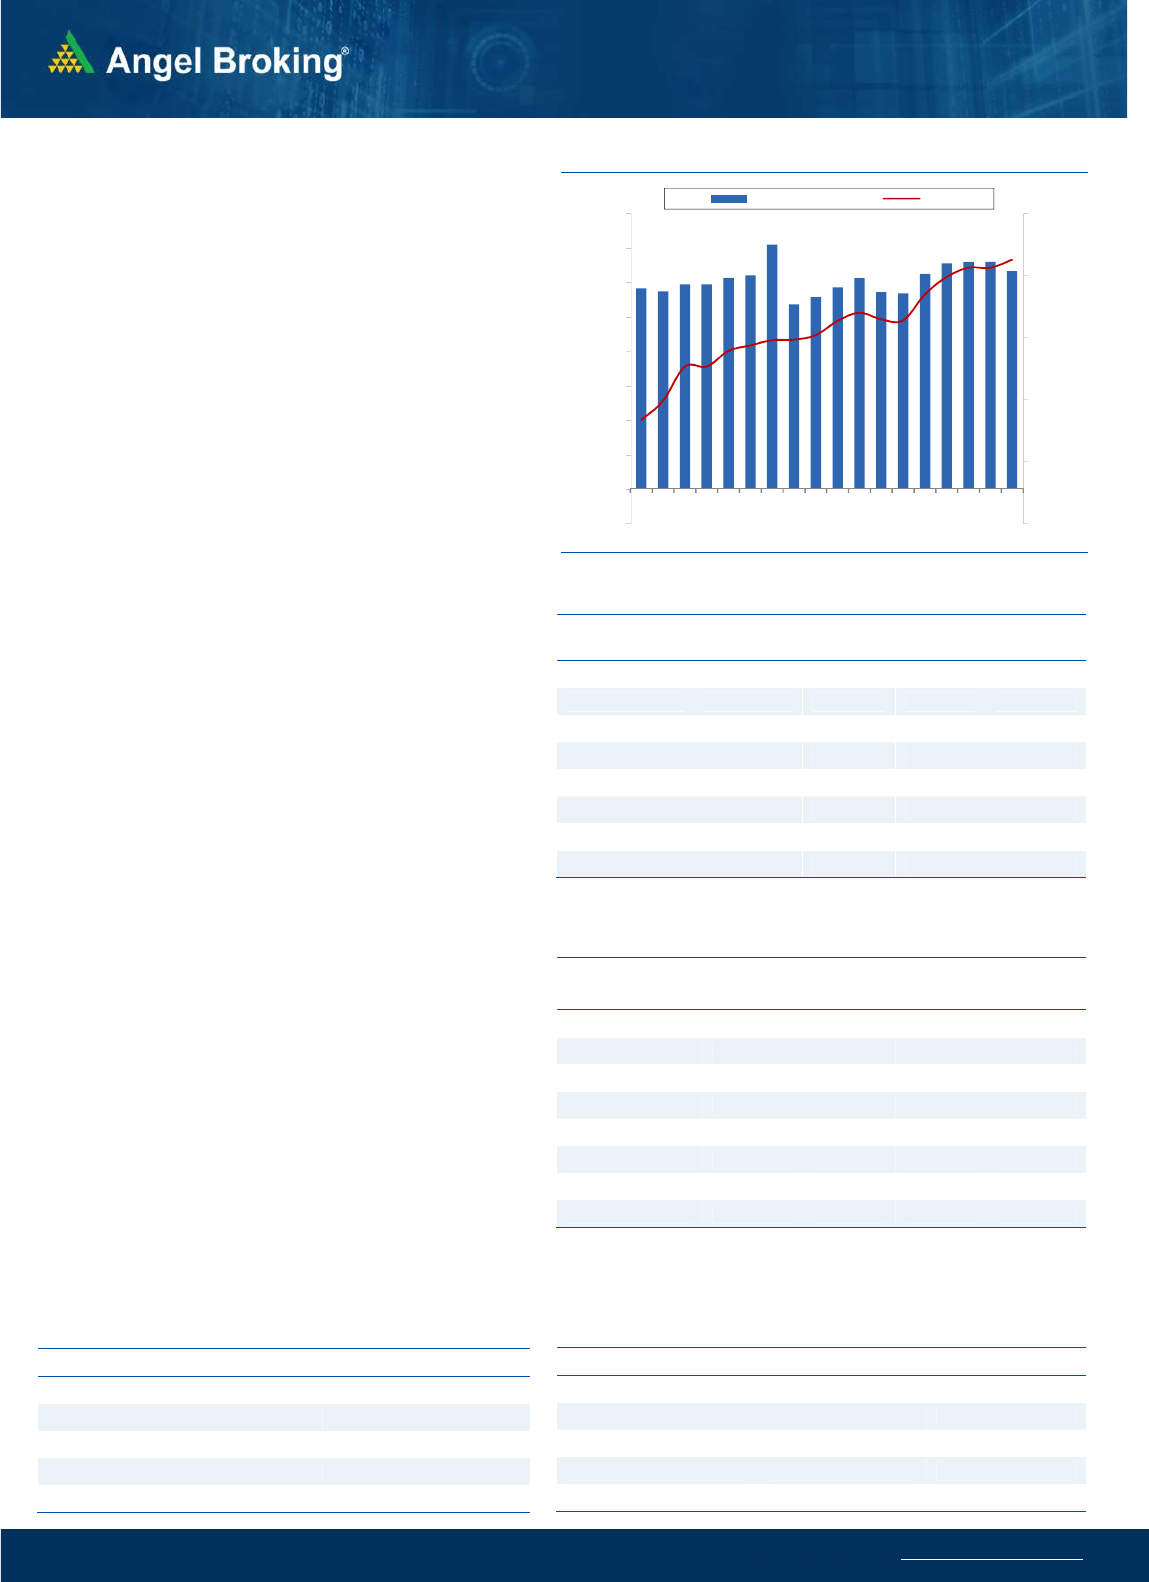
Yesterday, Bank Nifty started on a marginal negative note, and
then it remained within a range on the weekly expiry session. The
bank index eventually ended with a marginal loss tad above
32500.
On the daily chart not much has changed as we are witnessing
back-to-back doji patterns on previous all-time high levels. We
reiterate that for the next momentum move the bank index
needs to close above 32600 - 32700 on a sustained basis
otherwise the lackluster move can continue or we may even see a
price correction. On the flip side, immediate support is placed
around 32150 - 32000 levels. Traders are advised to keep a
watch on the above-mentioned levels and trade accordingly.
Stock-specific opportunities are likely to be seen on both sides of
the trend and one can continue with it with proper risk
management.
Key Levels
Support 1 – 32150 Resistance 1 – 32700
Support 2 – 32000 Resistance 2 – 33000
Exhibit 1: Nifty Daily Chart
Se
nsex
(
49584)
/ Nifty
(
14596
)
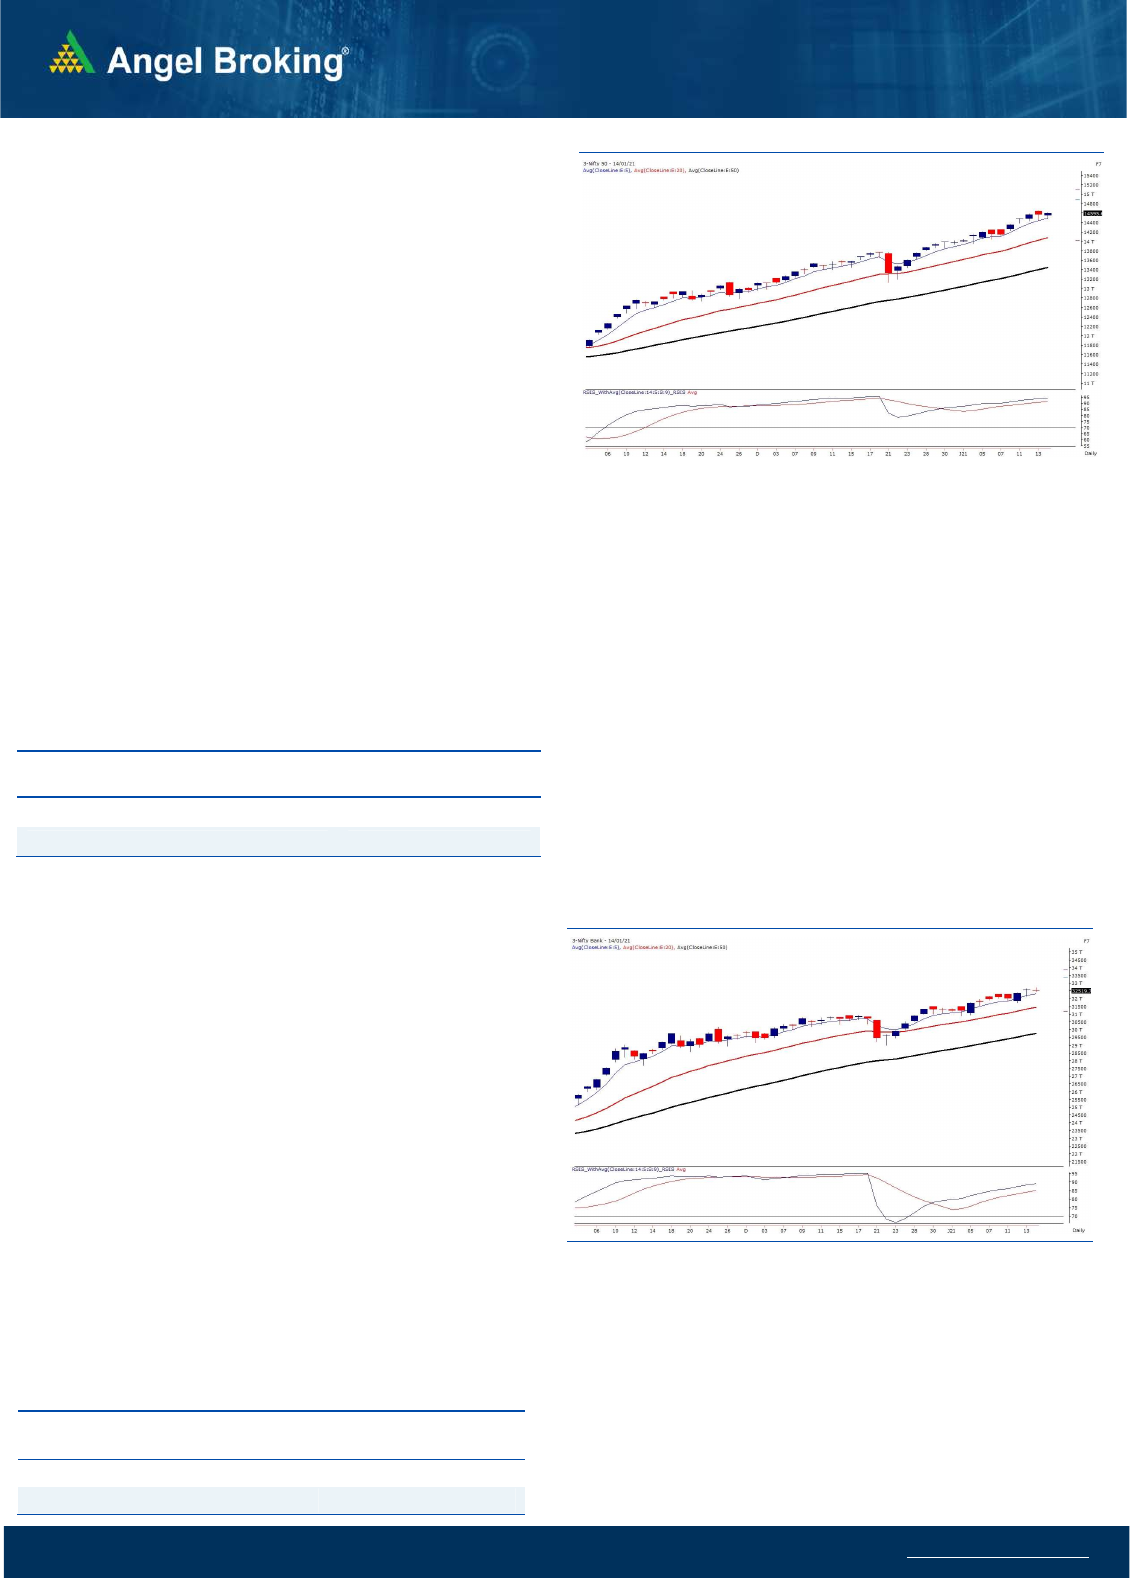
We had a flat start yesterday marginally in the red despite positive
global cues. In the initial couple of hours, market extended losses
to again test the sub-14500 territory. But once again similar to
recent trend, buying emerge in the latter half to conclude the
weekly expiry marginally in the green at 14600.
The mighty bulls remains in the dominant position and they are in
no mood to loosen up their grip on the market. Every now and
then some heavyweight space comes for a rescue and yesterday it
was a combination of IT as well as Pharma names. We witnessed a
stellar move in some of the heavyweights to pull the index in the
safe terrain. For the coming session, 14650 remains to be an
immediate resistance; whereas on the lower side, 14500 - 14430
are to be seen as crucial supports.
As of now there is no sign of weakness in the index but if we look
at the overall market breadth since last few days, individual stocks
started to show some fatigue now. Hence, traders are continuously
advised to stay light and look to take some money off the table.
Yesterday, banking was slightly on the back foot in the second half
as the baton was passed to IT and Pharma stocks.
Key Levels
Support 1 – 14500 Resistance 1 – 14650
Support 2 – 14430 Resistance2 – 14700
Exhibit 2: Nifty Bank Daily Chart
www.angelbroking.com
Technical & Derivatives Report
January 15, 2021
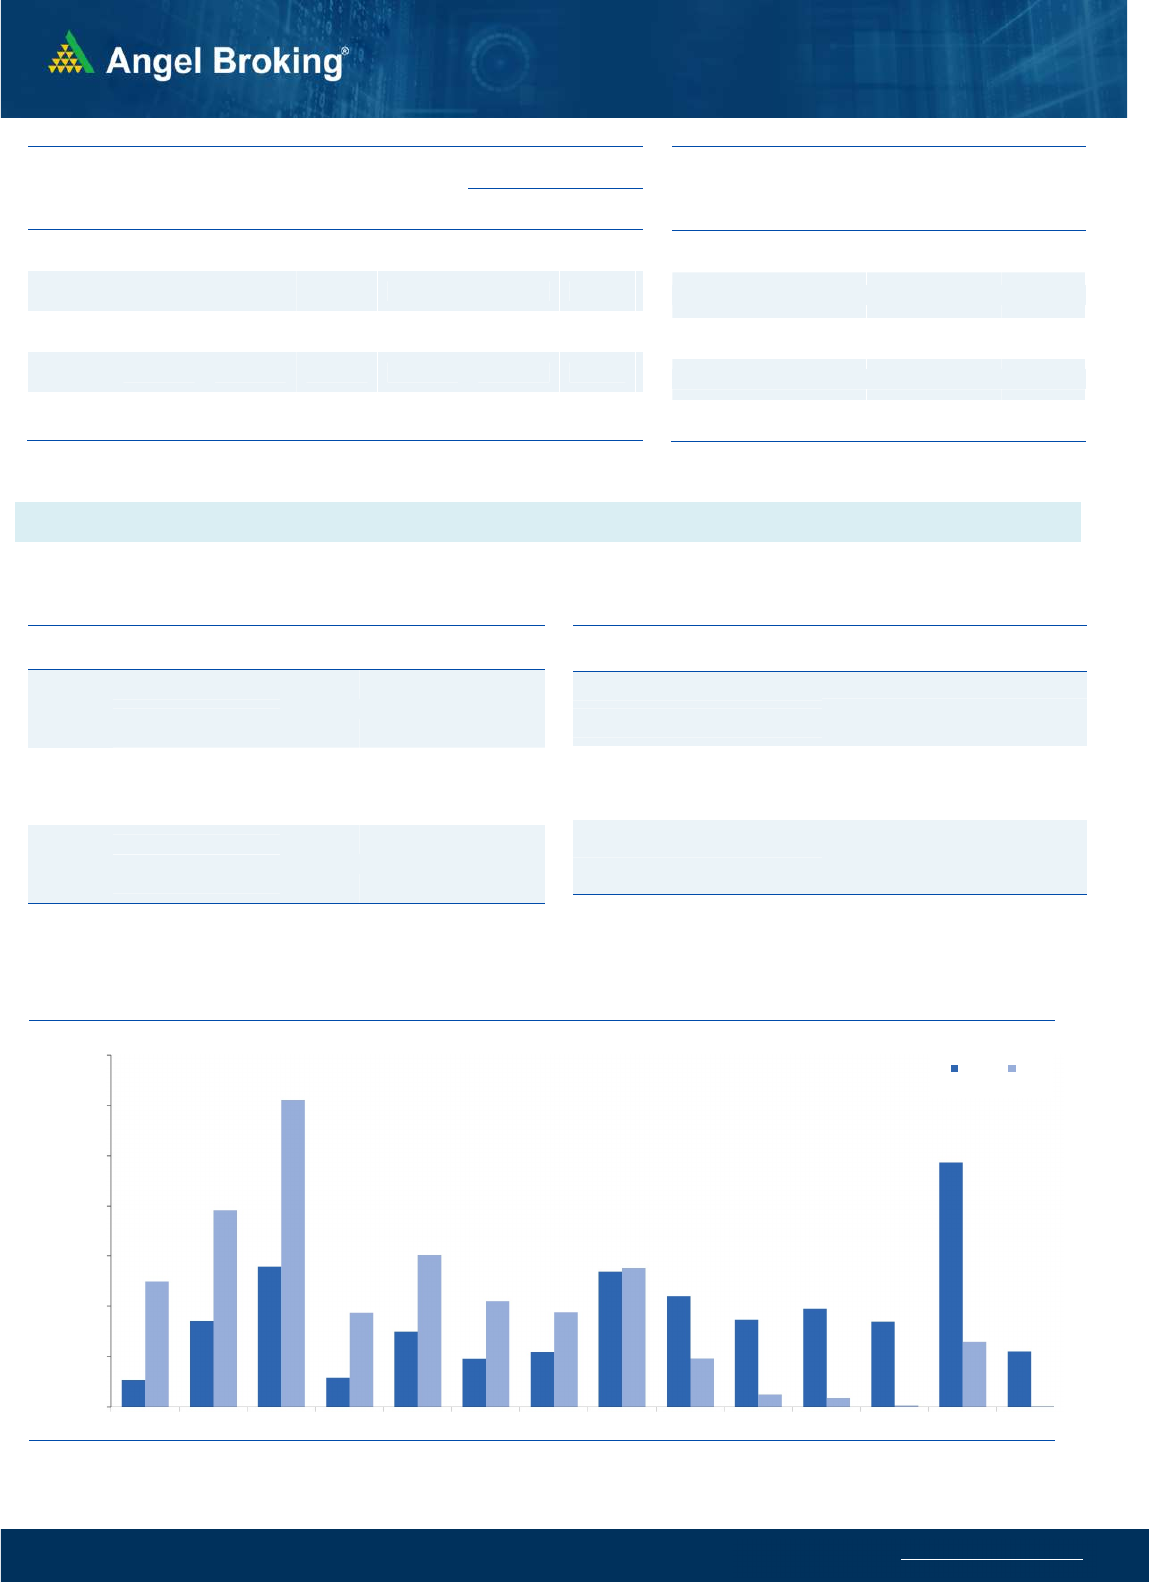
Nifty Vs OI
12500
13000
13500
14000
14500
15000
,0
2,000
4,000
6,000
8,000
10,000
12,000
14,000
16,000
18,000
12/21 12/24 12/28 12/30 1/1 1/5 1/7 1/11 1/13
(`000)
Openinterest Nifty
View
We started off the session slightly lower and saw follow-up
selling to correct below 14500 in the ealy morning trade.
Soon we witnessed decent recovery to recoup all the
intraday losses and conclude the session around 14600
mark.
FIIs were net buyers in the cash segment to the tune of
Rs. 1077 crore. In index future segment, they were
marginal buyers with decent rise in open interest
indicating long and short covering in yesterday’s session.
In derivatives segment, we saw some long positions in
Nifty. The 14600 strike of both call and put options added
huge postions. Maximum open interest concentration for
the weekly expiry is placed at 14600 call and 14500 put
strikes. We have been mentioning that the market looks a
bit overbought and we haven’t seen any meaningful
change in data yet. Now, considering the overall activity
we expect further profit booking going ahead. Hence,
traders are advised avoiding any aggressive directional
bets in index and prefer trading in individual counters
which is giving trading opportunity on both the sides.
C
o
mme
n
t
s
The Nifty futures open interest has increased by 1.96%
Bank Nifty futures open interest has increased by 0.35%
as market closed at 14595.60 levels.
The Nifty January future closed with a premium of 32.50
point against a premium of 34.50 point in last trading
session. The February series closed at a premium of
65.85 point.
The INDIA VIX decreased from 23.29 to 23.02.
At the same time, the PCR-OI of Nifty increased from
1.46 to 1.47.
Few of the liquid counters where we have seen high cost
of carry are IDEA, MRF, APOLLOTYRE, HINDPETRO,
NMDC and LALPATHLAB.
OI Gainers
SCRIP OI
OI
CHG. (%)
PRICE
PRICE
CHG. (%)
LALPATHLAB 216000 13.83 2331.95 -2.60
PAGEIND 71220 10.93 29088.05 0.31
HINDPETRO 28269000 10.74 233.60 3.03
LUPIN 9208900 10.55 1105.80 3.51
TITAN 7165500 9.90 1489.95 -1.12
MGL 1932000 9.82 1110.50 -0.32
HCLTECH 22450400 9.60 1027.70 -2.78
CADILAHC 10494000 9.33 503.45 3.64
OI Losers
SCRIP OI
OI
CHG. (%)
PRICE
PRICE
CHG. (%)
M&M 10561600 -9.37 829.90 0.19
SAIL 81016000 -6.51 67.20 -9.08
BRITANNIA 2432200 -6.50 3665.35 1.29
BHEL 125769000 -5.89 40.20 -1.59
CHOLAFIN 4477500 -5.89 426.15 -0.36
INFY 33736800 -5.34 1370.50 -1.64
CONCOR 9740616 -4.67 448.30 1.69
CANBK 50862600 -4.21 143.05 -1.34
Put-Call Ratio
SCRIP PCR-OI PCR-VOL
NIFTY 1.47 1.02
BANKNIFTY 1.00 1.01
RELIANCE 0.50 0.35
ICICIBANK 0.61 0.43
INFY 0.40 0.34
Historical Volatility
SCRIP HV
SAIL 65.77
MRF 37.46
TCS 37.39
DABUR 29.91
LUPIN 44.53
www.angelbroking.com
Technical & Derivatives Report
January 15, 2021
Note: Above mentioned Bullish or Bearish Spreads in Nifty (January Series) are given as an information and not as a recommendation.
Nifty Spot =
14595.60
FII Statistics for January 14, 2020
Detail Buy
Net Contracts
Open Interest
Sell
Value
(in Cr.)
Change
INDEX
FUTURES
2585.13 2576.03 9.10
121917 12544.07 4.55
INDEX
OPTIONS
554211.61 553098.87 1112.74
702992 71084.92 (29.39)
STOCK
FUTURES
11662.71 12231.65 (568.94) 1224913 102864.45 0.10
STOCK
OPTIONS
9780.29 10290.83 (510.54) 171532 14404.45 5.76
Total 578239.74
578197.38
42.36
2221354
200897.89
(11.07)
Turnover on January 14, 2020
Instrume
nt
No. of
Contracts
Turnover
( in Cr. )
Change
(%)
Index Futures 2,88,876 27220.96 11.22
Index Options 1,63,74,823
15,22,636.79 -73.86
Stock Futures 8,61,954 73120.08 0.41
Stock Options 17,10,561 1,50,002.15 16.22
Total 1,92,36,214
17,72,979.98 -70.70
Bull-Call Spreads
Action Strike Price Risk Reward BEP
Buy 14600 221.35
53.70 46.30 14653.70
Sell 14700 167.65
Buy 14600 221.35
100.05 99.95 14700.05
Sell 14800 121.30
Buy 14700 167.65
46.35 53.65 14746.35
Sell 14800 121.30
Bear-Put Spreads
Action Strike Price Risk Reward BEP
Buy 14600 192.10
37.75 62.25 14562.25
Sell 14500 154.35
Buy 14600 192.10
67.40 132.60 14532.60
Sell 14400 124.70
Buy 14500 154.35
29.65 70.35 14470.35
Sell 14400 124.70
Nifty Put-Call Analysis
,0
500,000
1000,000
1500,000
2000,000
2500,000
3000,000
3500,000
13800
13900
14000
14100
14200
14300
14400
14500
14600
14700
14800
14900
15000
15100
Call Put

www.angelbroking.com
Technical & Derivatives Report
January 15, 2021
Da
ily
Pivot Level
s for
Nifty Constituents
Scrips
S2
S1
PIVOT
R1
R2
ADANIPORTS
524
531
537
543
549
ASIANPAINT 2,594 2,629
2,683
2,718
2,772
AXISBANK
666
671
679
684
693
BAJAJ-AUTO 3,480 3,528
3,593
3,641
3,707
BAJFINANCE 4,760 4,819
4,893
4,951
5,026
BAJAJFINSV 8,529 8,638
8,784
8,893
9,039
BPCL
404
415
423
434
442
BHARTIARTL
564
572
578
587
593
BRITANNIA 3,578 3,622
3,663
3,707
3,749
CIPLA
821
831
839
849
858
COALINDIA
143
145
147
148
150
DIVISLAB 3,660 3,692
3,716
3,748
3,772
DRREDDY 5,238 5,273
5,301
5,336
5,364
EICHERMOT 2,812 2,849
2,878
2,915
2,944
GAIL
139
141
144
146
149
GRASIM
997
1,009
1,025
1,036
1,052
HCLTECH
985
1,007
1,028
1,049
1,070
HDFCBANK 1,439 1,454
1,471
1,486
1,503
HDFCLIFE
693
700
709
716
725
HDFC 2,625 2,654
2,677
2,706
2,729
HEROMOTOCO 3,210 3,238
3,267
3,295
3,324
HINDALCO
256
259
262
264
268
HINDUNILVR 2,330 2,364
2,385
2,419
2,440
ICICIBANK
546
550
554
558
562
IOC
99
101
102
104
106
INDUSINDBK
938
954
967
983
997
INFY 1,292 1,331
1,358
1,397
1,423
ITC
209
212
214
217
219
JSW STEEL
387
392
399
403
410
KOTAKBANK 1,856 1,874
1,890
1,908
1,924
LT 1,341 1,359
1,374
1,392
1,408
M&M
817
824
834
840
850
MARUTI 7,961 8,055
8,118
8,212
8,274
NESTLEIND 17,957
18,045
18,137
18,225
18,317
NTPC
100
101
103
103
105
ONGC
102
104
106
107
109
POWERGRID
202
203
205
207
209
RELIANCE 1,928 1,944
1,956
1,972
1,983
SBILIFE
912
918
925
932
939
SHREECEM 24,309
24,582
24,748
25,021
25,187
SBIN
301
304
307
310
312
SUNPHARMA
590
598
605
614
620
TCS 3,066 3,159
3,213
3,305
3,359
TATAMOTORS
233
239
245
250
256
TATASTEEL
689
697
706
715
723
TECHM 1,015 1,034
1,049
1,068
1,083
TITAN 1,458 1,474
1,496
1,512
1,534
ULTRACEMCO 5,491 5,537
5,605
5,651
5,719
UPL
484
497
506
519
528
WIPRO
414
434
450
470
486

www.angelbroking.com
Technical & Derivatives Report
January 15, 2021
*
Research Team Tel: 022 – 39357600 (Extn. 6844) Website: www.angelbroking.com
For Technical Queries E-mail: technicalresearch-cso@angelbroking.com
DISCLAIMER
Angel Broking Limited (hereinafter referred to as “Angel”) is a registered Member of National Stock Exchange of India Limited,
Bombay Stock Exchange Limited and Metropolitan Stock Exchange Limited. It is also registered as a Depository Participant with CDSL
and Portfolio Manager and Investment Adviser with SEBI. It also has registration with AMFI as a Mutual Fund Distributor. Angel
Broking Limited is a registered entity with SEBI for Research Analyst in terms of SEBI (Research Analyst) Regulations, 2014 vide
registration number INH000000164. Angel or its associates has not been debarred/ suspended by SEBI or any other regulatory
authority for accessing /dealing in securities Market. Angel or its associates/analyst has not received any compensation / managed
or co-managed public offering of securities of the company covered by Analyst during the past twelve months.
This document is solely for the personal information of the recipient, and must not be singularly used as the basis of any investment
decision. Nothing in this document should be construed as investment or financial advice. Each recipient of this document should
make such investigations as they deem necessary to arrive at an independent evaluation of an investment in the securities of the
companies referred to in this document (including the merits and risks involved), and should consult their own advisors to determine
the merits and risks of such an investment.
Reports based on technical and derivative analysis center on studying charts of a stock's price movement, outstanding positions and
trading volume, as opposed to focusing on a company's fundamentals and, as such, may not match with a report on a company's
fundamentals. Investors are advised to refer the Fundamental and Technical Research Reports available on our website to evaluate
the contrary view, if any.
The information in this document has been printed on the basis of publicly available information, internal data and other reliable
sources believed to be true, but we do not represent that it is accurate or complete and it should not be relied on as such, as this
document is for general guidance only. Angel Broking Limited or any of its affiliates/ group companies shall not be in any way
responsible for any loss or damage that may arise to any person from any inadvertent error in the information contained in this
report. Angel Broking Limited has not independently verified all the information contained within this document. Accordingly, we
cannot testify, nor make any representation or warranty, express or implied, to the accuracy, contents or data contained within this
document. While Angel Broking Limited endeavors to update on a reasonable basis the information discussed in this material, there
may be regulatory, compliance, or other reasons that prevent us from doing so.
This document is being supplied to you solely for your information, and its contents, information or data may not be reproduced,
redistributed or passed on, directly or indirectly.
Technical and Derivatives Team:
Sameet Chavan Chief Analyst - Technical & Derivatives sameet.chavan@angelbroking.com
Ruchit Jain Senior Analyst - Technical & Derivatives ruchit.jain@angelbroking.com
Rajesh Bhosale Technical Analyst rajesh.bhosle@angelbroking.com
Sneha Seth Derivatives Analyst sneha.seth@angelbroking.com
