www.angelbroking.com
Technical & Derivatives Report
October 14, 2020
Nifty
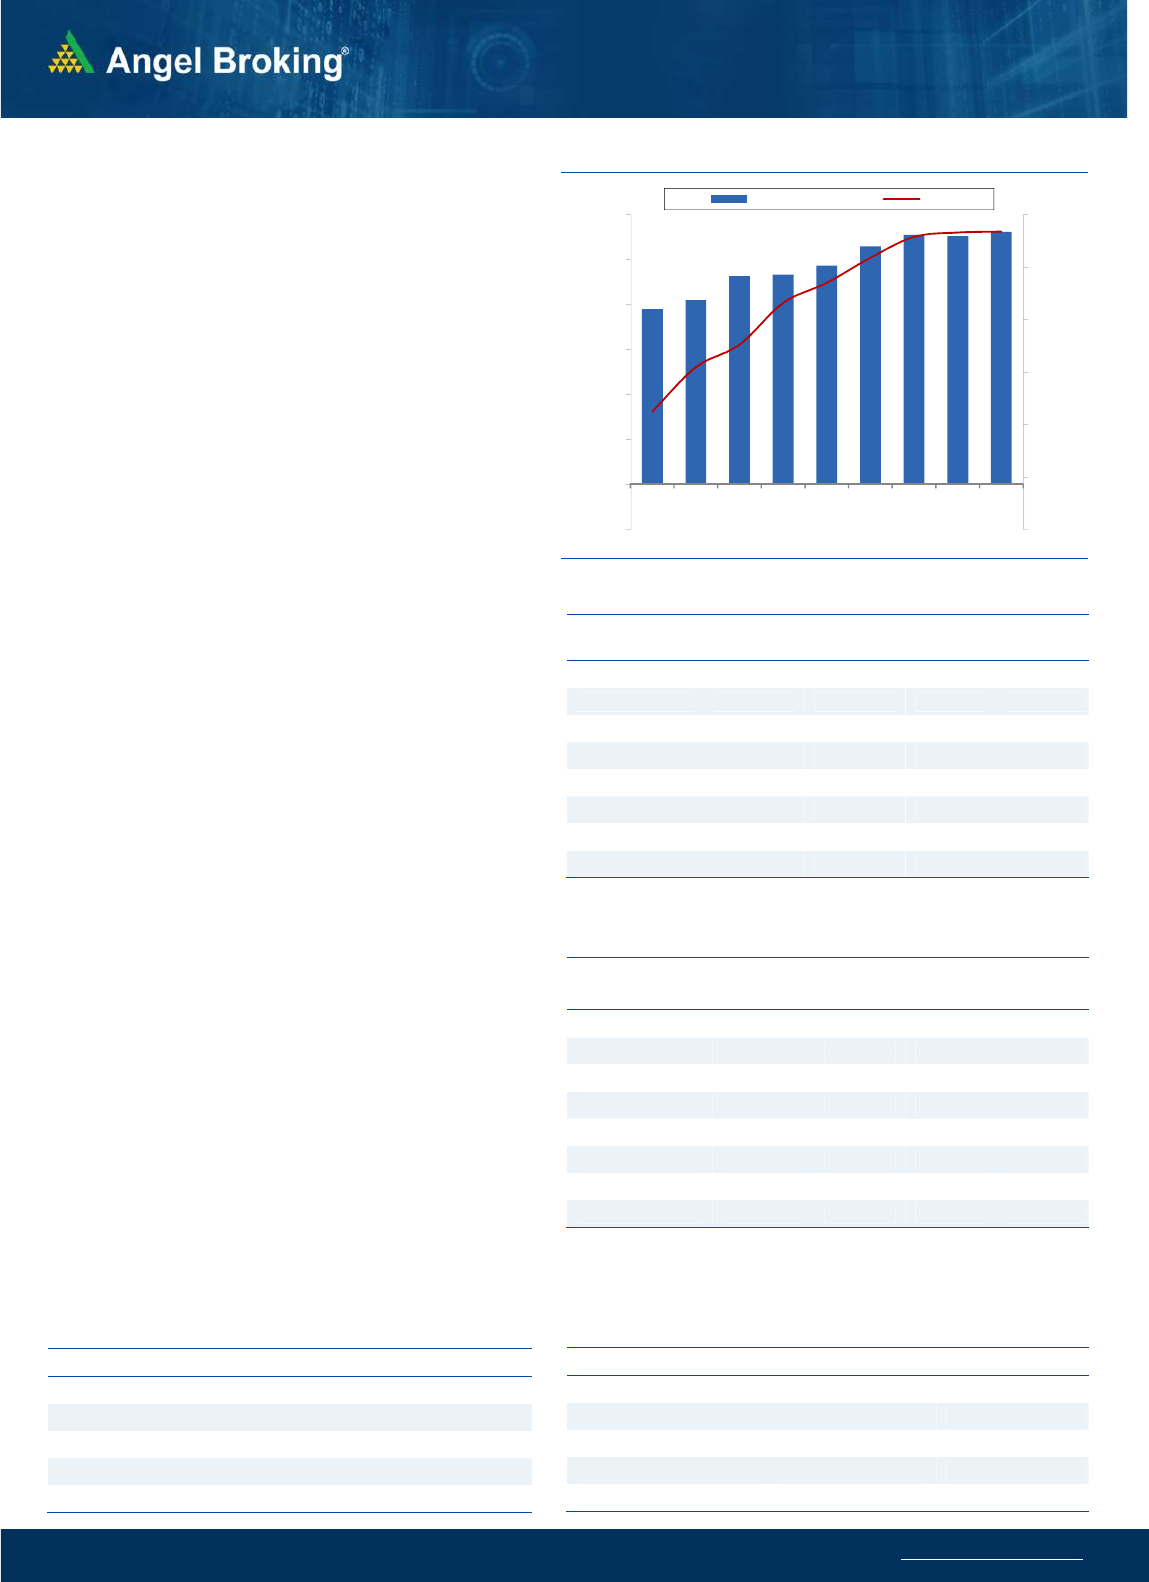
Bank Out
look
-
(
23492
)
Bank Nifty started on a mild negative note and then it slipped into
a consolidation mode with 23400 acting as a base. Eventually, the
bank index ended with a loss of 0.93% tad below 23500 levels.
As mentioned yesterday, the bank index has entered into a
consolidation mode after its relentless upmove in the last two
weeks. Technically this consolidation is healthy for uptrend and as
of now, there are no signs of weakness. Going ahead it's always
tough to predict the end of the consolidation phase however one
should stick with the primary trend and use dips to enter longs. In
such a scenario, a stock-specific approach from the basket is likely
to give better trading opportunities however one needs to be very
agile in stock picking. As far as levels are concerned, immediate
support is placed around 23400 followed by 23080 on the flip
side, resistance is placed around 23700 and 23950 levels.
Key Levels
Support 1 – 23400 Resistance 1 – 23700
Support 2 – 23080 Resistance 2 – 23950
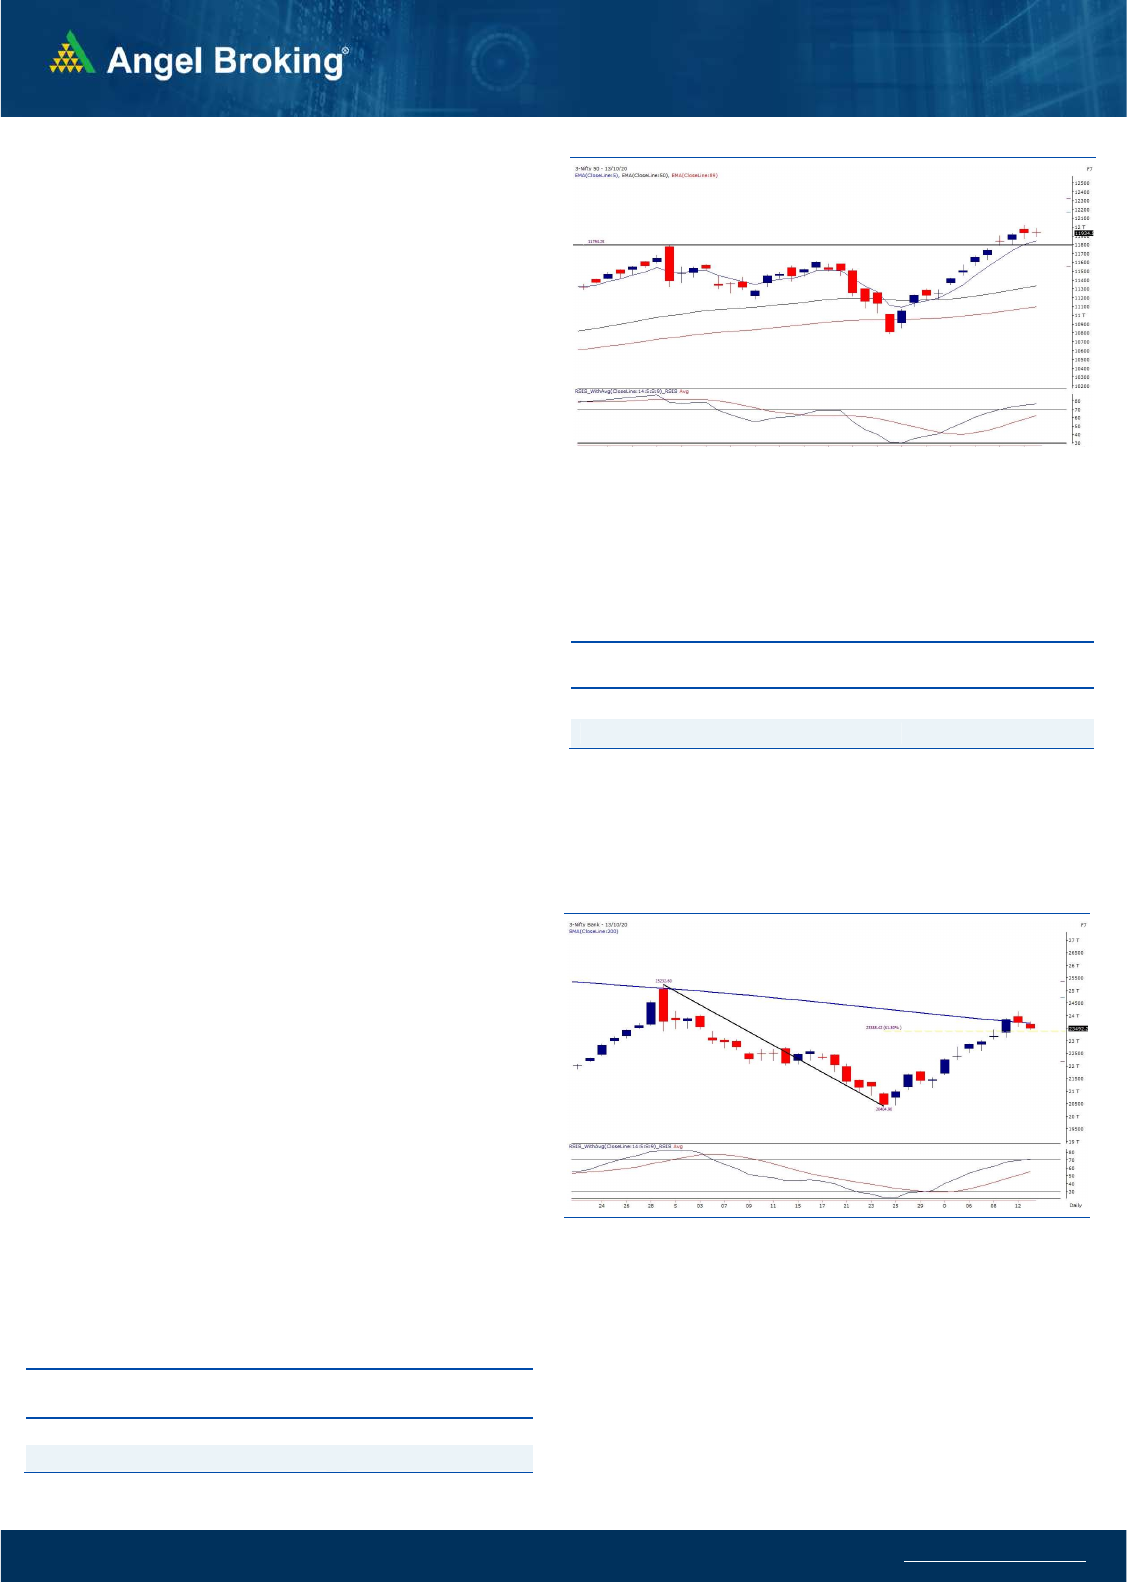
Exhibit 1: Nifty Daily Chart
Sensex (40626) / Nifty (11935)
Yesterday morning, global cues were sluggish and hence, we had a
flat opening in the absence of any triggers. Subsequently, Nifty
vacillated within the narrow band of 11900 – 12000 throughout the
remaining part of the session. In fact, the overall movement was so
choppy; the market was unable to hold any direction. Eventually, the
day ended on a muted note and Nifty managed to hold the 11900
mark convincingly.
It was yet another day of consolidation for our market after a
relentless rally of nearly 1200 points in a short span. Also, we reached
a psychological mark of 12000, so some sort of profit booking is very
much evident. However, it should not be treated as a trend reversal
unless we violate some critical levels. For the coming session, 11900
followed by 11867 would be seen as immediate support; whereas on
the higher side, 12000 – 12050 are the levels to watch out for.
Since the last couple of days, we have seen Nifty holding its support
levels and not correcting much; but if we look at the banking index,
it has shown some weakness and hence, if Nifty has to surpass
12000, the banking stocks need to participate once again. Also, only
a handful of heavyweight stocks have lifted markets higher in the last
couple of weeks, but the midcap stocks remained quiet. In fact, in
the last couple of sessions, we have seen some decent correction in
the broader market, which is not a good sign.
Exhibit 2: Nifty Bank Daily Chart
Hence, if the rally is to be called the robust one, the Nifty Midcap
index needs to breakout from the recent congestion zone. One
needs to keep a close track on these scenarios and wait for the
midcap index to breakout to place aggressive bets in the broader
market.
.Key Levels
Support 1 – 11900 Resistance 1 – 12000
Support 2 – 11867 Resistance2 – 12050
www.angelbroking.com
Technical & Derivatives Report
October 14, 2020
Nifty Vs OI
10800
11000
11200
11400
11600
11800
12000
,0
2,000
4,000
6,000
8,000
10,000
12,000
14,000
9/30 10/1 10/5 10/6 10/7 10/8 10/9 10/12 10/13
(`000)
Openinterest Nifty
View
s
Nifty started on a flat note and then traded within a very
tight range throughout the session. Eventually it ended
flat holding the 11900 levels.
FIIs bought worth Rs.832 crores in cash segment. In
index future segment, the activity was muted as they
sold worth Rs. 59 crores with increase in open interest.
The indices traded within a narrow range in yesterday's
trading session and no significant build up was seen in
open interest. FII's bought equities in cash segment
while their activity was muted in the index futures. The
options segment indicates a probable trading range of
11800-12000 for next two sessions. Hence, traders are
advised to look for buying opportunities on dips in the
range of 11850-11800.
C
o
mme
n
t
s
The Nifty futures open interest has increased by 1.48%
Bank Nifty futures open interest has increased by 2.05%
as market closed at 11934.50 levels.
The Nifty October future closed with a premium of 7.40
point against a premium of 15.60 point in last trading
session. The November series closed at a premium of
31.05 point.
The INDIA VIX has decreased from 21.12 to 20.71.
At the same time, the PCR-OI of Nifty remained
unchanged at 1.40.
Few of the liquid counters where we have seen high cost
of carry are VEDL, ESCORTS, ACC, MGL, AND
LICHSGFIN.
OI Gainers
SCRIP OI
OI
CHG. (%)
PRICE
PRICE
CHG. (%)
VEDL 73240600 24.23 99.65 2.93
ESCORTS 3555200 16.26 1241.25 -1.21
ACC 2056500 11.74 1521.75 0.71
MGL 1924200 10.85 787.95 -2.72
LICHSGFIN 10454000 10.48 288.25 -4.57
RECLTD 23982000 9.90 92.60 -3.79
AMBUJACEM 17394000 9.75 241.75 1.40
TVSMOTOR 5504800 7.61 459.60 -2.04
OI Losers
SCRIP OI
OI
CHG. (%)
PRICE
PRICE
CHG. (%)
SRF 683000 -10.01 4384.15 0.00
LUPIN 7399250 -9.04 1055.25 0.76
APOLLOHOSP 1695500 -7.02 2254.45 -0.76
CANBK 19870000 -6.89 89.40 -1.60
GODREJPROP 768300 -5.06 885.30 -2.36
KOTAKBANK 11813200 -4.85 1344.95 2.12
TATACHEM 5714000 -4.48 307.45 2.21
COFORGE 562125 -4.46 2797.45 4.39
Put-Call Ratio
SCRIP PCR-OI PCR-VOL
NIFTY 1.40 0.94
BANKNIFTY 0.78 0.87
RELIANCE 0.54 0.27
ICICIBANK 0.74 0.67
INFY 0.44 0.29
Historical Volatility
SCRIP HV
HCLTECH 46.01
LICHSGFIN 62.24
RECLTD 52.23
CIPLA 44.65
COFORGE 68.71
www.angelbroking.com
Technical & Derivatives Report
October 14, 2020
Note: Above mentioned Bullish or Bearish Spreads in Nifty (October Series) are given as an information and not as a recommendation.
Nifty Spot =
11934.50
FII Statistics for October 13, 2020
Detail Buy
Net Contracts
Open Interest
Sell
Value
(in Cr.)
Change
INDEX
FUTURES
2453.15
2512.23
(59.08) 151025
12237.76
0.82
INDEX
OPTIONS
190972.82
190917.71
55.11
963811
77148.11
1.07
STOCK
FUTURES
12677.86
13609.27
(931.41) 1123831
80498.65
(0.21)
STOCK
OPTIONS
5225.64
5314.53
(88.89) 98596
7982.19
3.17
Total 211329.47
212353.74
(1024.27) 2337263
177866.71
0.52
Turnover on October 13, 2020
Instrument
No. of
Contracts
Turnover
( in Cr. )
Change
(%)
Index Futures
3,75,643 25764.94 -16.20
Index Options
1,93,57,175 13,72,659.83 -0.10
Stock Futures
6,74,087 54776.98 14.22
Stock Options
10,75,300 95720.17 14.87
Total 2,14,82,205 15,48,921.92 0.84
Bull-Call Spreads
Action Strike Price Risk Reward BEP
Buy 11900 208.15
56.00 44.00 11956.00
Sell 12000 152.15
Buy 11900 208.15
100.90 99.10 12000.90
Sell 12100 107.25
Buy 12000 152.15
44.90 55.10 12044.90
Sell 12100 107.25
Bear-Put Spreads
Action Strike Price Risk Reward BEP
Buy 11900 160.70
37.90 62.10 11862.10
Sell 11800 122.80
Buy 11900 160.70
68.35 131.65 11831.65
Sell 11700 92.35
Buy 11800 122.80
30.45 69.55 11769.55
Sell 11700 92.35
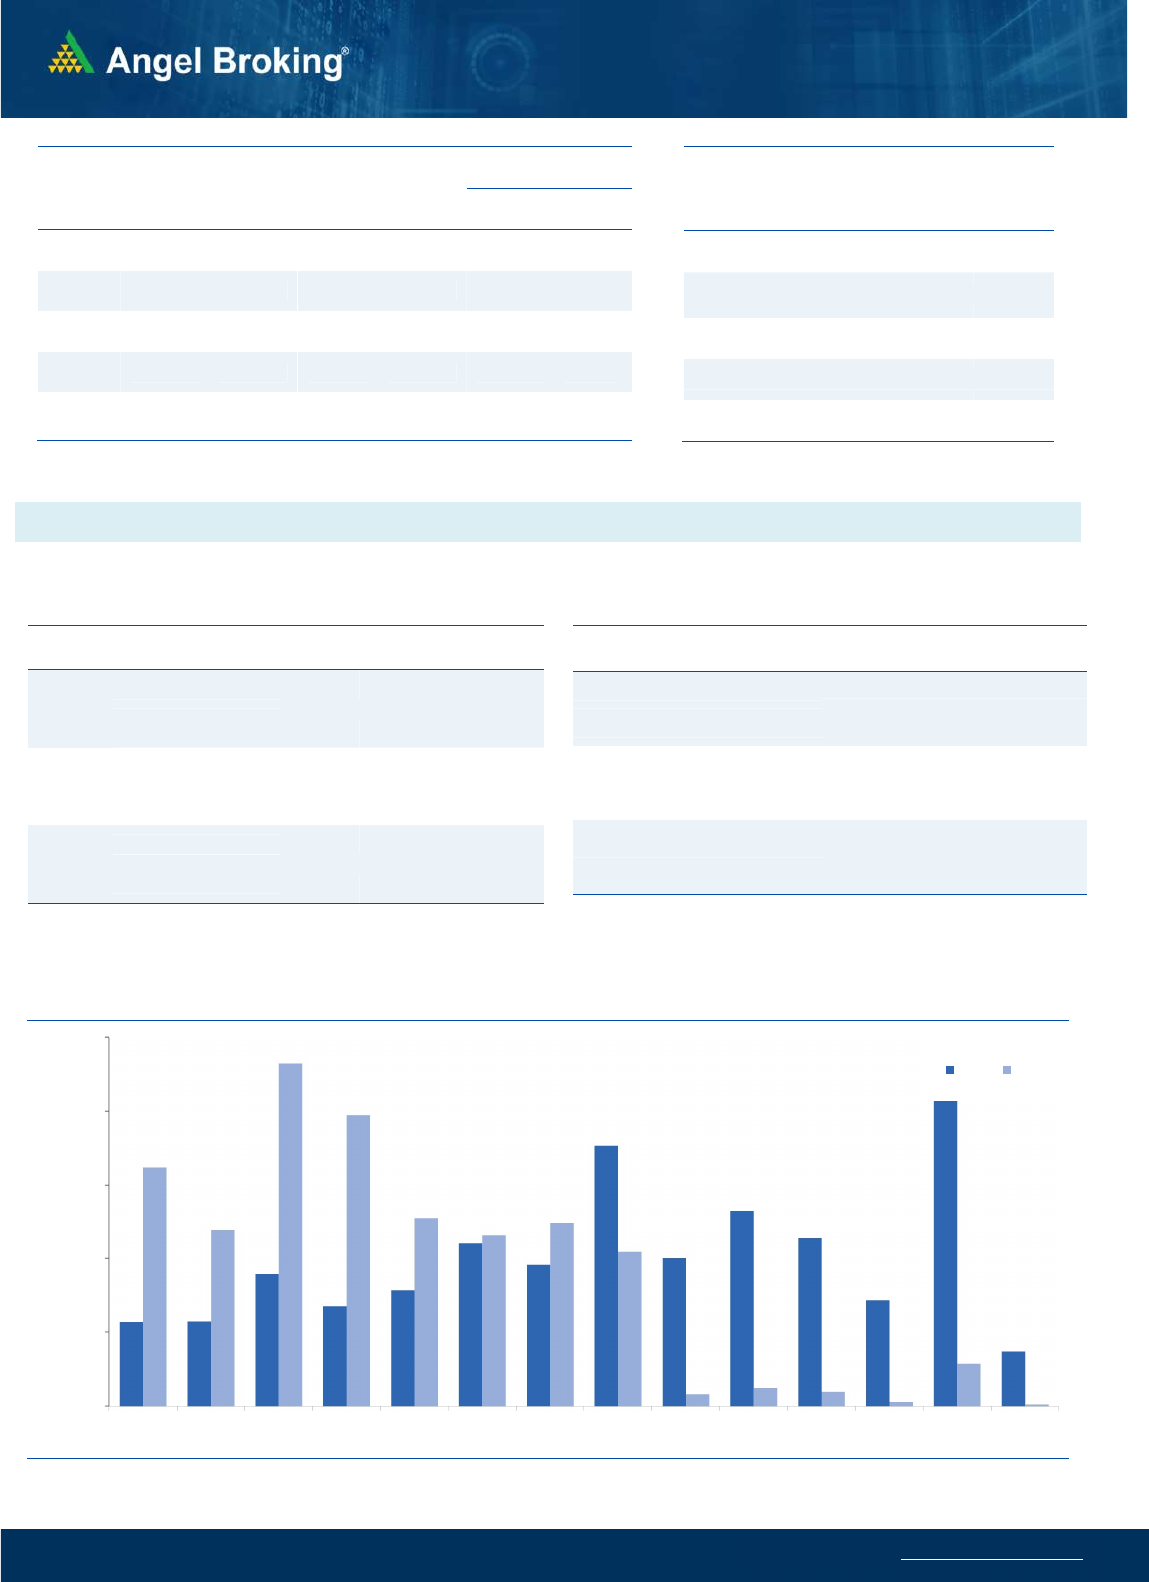
Nifty Put-Call Analysis
,0
500,000
1000,000
1500,000
2000,000
2500,000
11300 11400 11500 11600 11700 11800 11900 12000 12100 12200 12300 12400 12500 12600
Call Put

www.angelbroking.com
Technical & Derivatives Report
October 14, 2020
Da
ily
Pivot Level
s for
Nifty Constituents
Scrips
S2
S1
PIVOT
R1
R2
ADANIPORTS
342
346
352
356
363
ASIANPAINT 2,018 2,041
2,078
2,101
2,138
AXISBANK
451
456
465
470
478
BAJAJ-AUTO 2,972 3,003
3,027
3,058
3,082
BAJFINANCE 3,189 3,231
3,285
3,327
3,382
BAJAJFINSV 5,780 5,824
5,869
5,913
5,959
BPCL
335
337
340
343
346
BHARTIARTL
404
410
419
424
433
BRITANNIA 3,661 3,703
3,745
3,787
3,829
CIPLA
748
767
798
818
849
COALINDIA
111
113
114
115
116
DIVISLAB 3,043 3,091
3,169
3,218
3,296
DRREDDY 5,052 5,110
5,216
5,275
5,381
EICHERMOT 2,154 2,187
2,211
2,244
2,268
GAIL
81
82
83
84
85
GRASIM
724
737
750
763
776
HCLTECH
847
874
890
917
933
HDFCBANK 1,178 1,188
1,205
1,216
1,233
HDFCLIFE
554
560
566
573
578
HDFC 1,897 1,920
1,954
1,977
2,010
HEROMOTOCO 3,236 3,262
3,282
3,309
3,329
HINDALCO
167
170
173
176
178
HINDUNILVR 2,115 2,126
2,140
2,152
2,165
ICICIBANK
389
393
397
400
404
IOC
74
75
76
77
77
INDUSINDBK
592
600
610
618
629
INFY 1,123 1,140
1,153
1,171
1,184
ITC
166
168
172
174
177
JSW STEEL
281
286
288
293
295
KOTAKBANK 1,291 1,318
1,334
1,361
1,376
LT
873
885
900
912
927
M&M
614
621
631
638
649
MARUTI 6,917 6,975
7,080
7,138
7,243
NESTLEIND 15,441
15,557
15,768
15,884
16,095
NTPC
82
82
83
83
84
ONGC
68
69
69
70
70
POWERGRID
158
159
161
162
163
RELIANCE 2,204 2,242
2,264
2,302
2,324
SBILIFE
774
780
788
794
802
SHREECEM 20,363
20,725
21,213
21,575
22,063
SBIN
192
194
197
199
202
SUNPHARMA
490
497
508
515
527
TCS 2,789 2,808
2,831
2,850
2,874
TATAMOTORS
130
132
135
137
139
TATASTEEL
361
365
370
374
380
TECHM
837
853
866
882
895
TITAN 1,187 1,208
1,245
1,266
1,303
ULTRACEMCO 4,230 4,306
4,416
4,492
4,601
UPL
497
502
509
513
520
WIPRO
368
372
377
381
386

www.angelbroking.com
Technical & Derivatives Report
October 14, 2020
*
Research Team Tel: 022 – 39357600 (Extn. 6844) Website: www.angelbroking.com
For Technical Queries E-mail: technicalresearch-cso@angelbroking.com
For Derivatives Queries E-mail: derivatives.desk@angelbroking.com
DISCLAIMER
Angel Broking Limited (hereinafter referred to as “Angel”) is a registered Member of National Stock Exchange of India Limited, Bombay
Stock Exchange Limited and Metropolitan Stock Exchange Limited. It is also registered as a Depository Participant with CDSL and
Portfolio Manager and Investment Adviser with SEBI. It also has registration with AMFI as a Mutual Fund Distributor. Angel Broking
Limited is a registered entity with SEBI for Research Analyst in terms of SEBI (Research Analyst) Regulations, 2014 vide registration
number INH000000164. Angel or its associates has not been debarred/ suspended by SEBI or any other regulatory authority for
accessing /dealing in securities Market. Angel or its associates/analyst has not received any compensation / managed or co-managed
public offering of securities of the company covered by Analyst during the past twelve months.
This document is solely for the personal information of the recipient, and must not be singularly used as the basis of any investment
decision. Nothing in this document should be construed as investment or financial advice. Each recipient of this document should make
such investigations as they deem necessary to arrive at an independent evaluation of an investment in the securities of the companies
referred to in this document (including the merits and risks involved), and should consult their own advisors to determine the merits
and risks of such an investment.
Reports based on technical and derivative analysis center on studying charts of a stock's price movement, outstanding positions and
trading volume, as opposed to focusing on a company's fundamentals and, as such, may not match with a report on a company's
fundamentals. Investors are advised to refer the Fundamental and Technical Research Reports available on our website to evaluate the
contrary view, if any.
The information in this document has been printed on the basis of publicly available information, internal data and other reliable
sources believed to be true, but we do not represent that it is accurate or complete and it should not be relied on as such, as this
document is for general guidance only. Angel Broking Limited or any of its affiliates/ group companies shall not be in any way
responsible for any loss or damage that may arise to any person from any inadvertent error in the information contained in this report.
Angel Broking Limited has not independently verified all the information contained within this document. Accordingly, we cannot
testify, nor make any representation or warranty, express or implied, to the accuracy, contents or data contained within this document.
While Angel Broking Limited endeavors to update on a reasonable basis the information discussed in this material, there may be
regulatory, compliance, or other reasons that prevent us from doing so.
This document is being supplied to you solely for your information, and its contents, information or data may not be reproduced,
redistributed or passed on, directly or indirectly.
Technical and Derivatives Team:
Sameet Chavan Chief Analyst - Technical & Derivatives sameet.chavan@angelbroking.com
Ruchit Jain Senior Analyst - Technical & Derivatives ruchit.jain@angelbroking.com
Rajesh Bhosale Technical Analyst rajesh.bhosle@angelbroking.com
Sneha Seth Derivatives Analyst sneha.seth@angelbroking.com
