www.angelbro
king.com
Technical & Derivatives Report
October 13, 2020
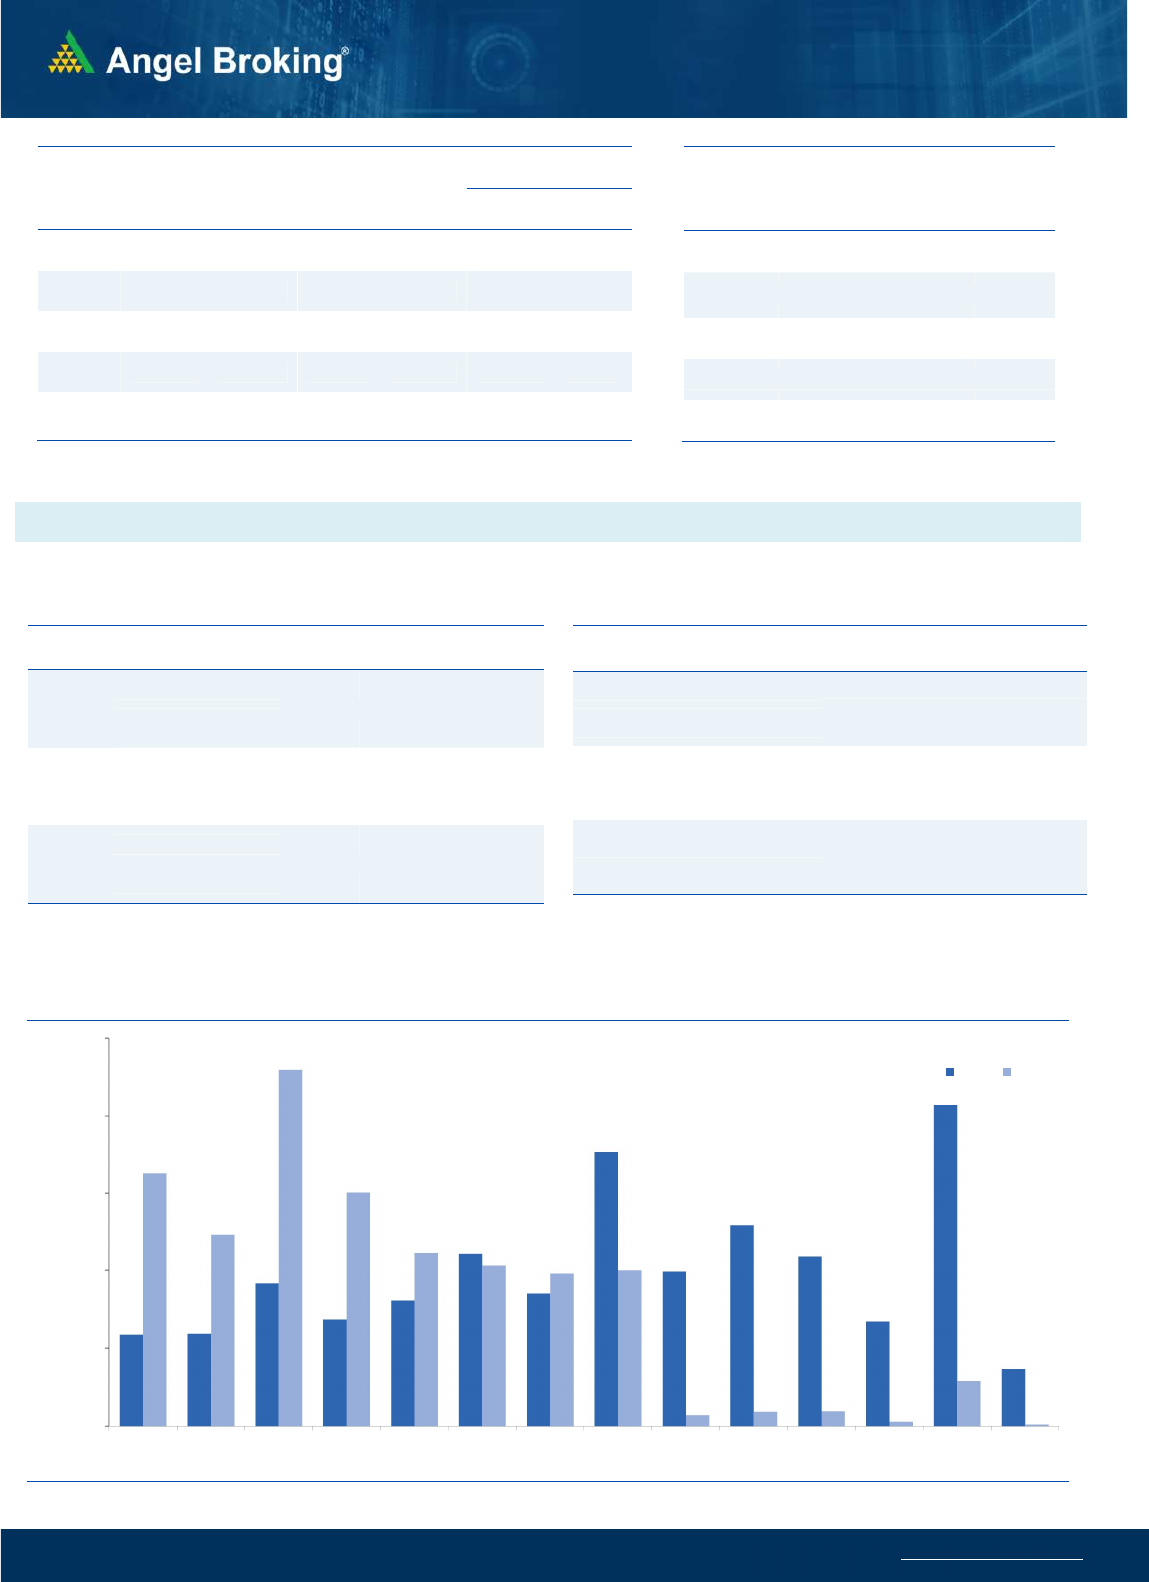
Nifty
Bank Out
look
-
(
23713
)
Bank Nifty as well started the week on a positive note and in
the first few minutes itself surpassed the levels of 24000 with
ease. This was however followed by profit booking and then
consolidation to eventually end with a loss of 0.56% at
23712.80.
After a stupendous rally last week, the hourly oscillators were
in deep overbought zone and some profit booking was
inevitable. This is however just a breather for the bulls before a
fresh start towards the northward direction. Traders are hence
advised to use further such profit booking or dips as a buying
opportunity. Preferably a stock-specific approach from the
basket will a better option. As far as levels are concerned,
immediate support is placed around 23450 and 23300 levels
whereas resistance is placed around 24000 and 24250 levels.
Key Levels
Support 1 – 23450 Resistance 1 – 24000
Support 2 – 23300 Resistance 2 – 24250
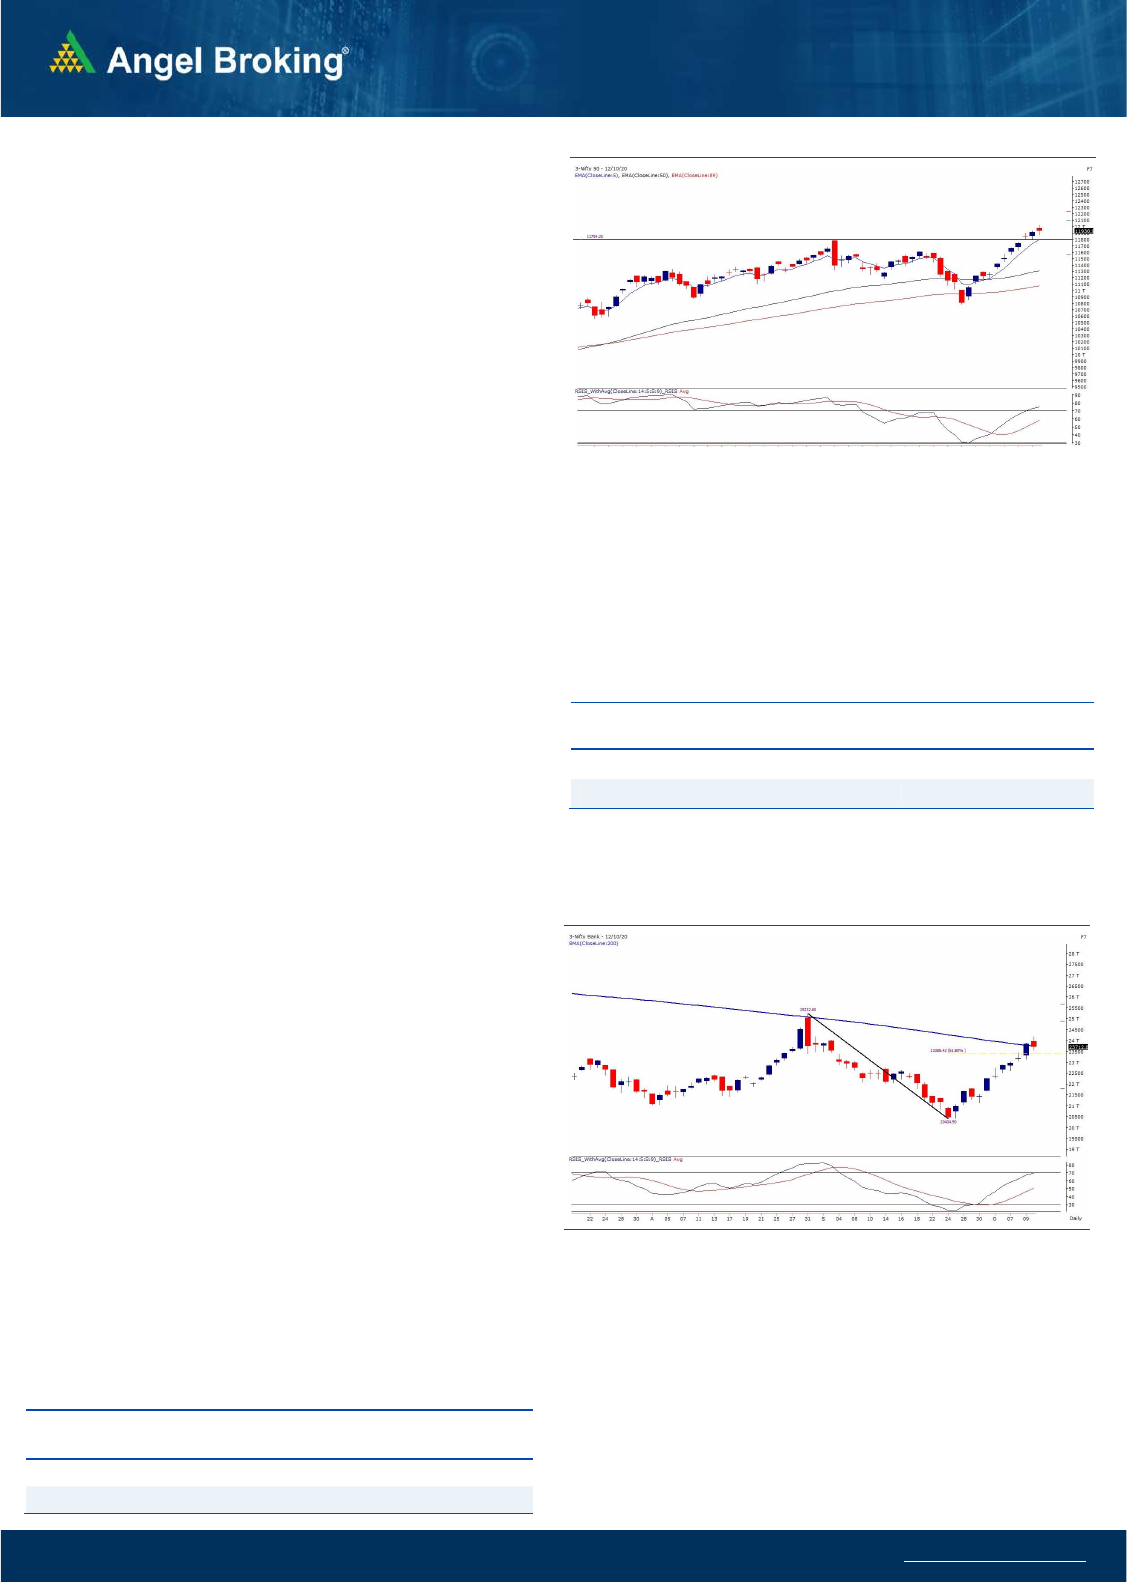
Exhibit 1: Nifty Daily Chart
Sensex (40594) / Nifty (11931)
Trading for the week started with a good upside gap as indicated
by the SGX Nifty early in the morning. Within the first five minutes
of trade, Nifty conquered the milestone of 12000, which is the
outcome of the stupendous recovery from the March lows in such
a short span. In fact, in the last couple of weeks also, we had a
remarkable rally after testing the 200-day SMA around 10800.
Post the initial hour, the market witnessed some profit booking
at higher levels, which was then followed by a consolidation to
conclude the day on a flat note.
Yesterday, for the first time in the last few trading sessions, the
bulls looked a bit tentative at higher levels, especially in the
banking space after a strong close on Friday. The prices were
extremely overbought and since the recent move was swift, some
in between profit booking was very much on cards after reaching
the psychologically level of 12000. This is what we had
mentioned in the weekly article that one should avoid chasing
prices now and should wait for intraday dips to create positions.
Yesterday’s move as of now should only be construed as a profit
taking and not the complete reversal. As far as levels are
concerned, 11867 – 11800 should be treated as a support zone;
whereas on the higher side, 12000 – 12050 are the levels to
watch out for.
Exhibit 2: Nifty Bank Daily Chart
Addition to this, we would like to draw attention towards the
movement in the Nifty Midcap index. This space saw some
decent profit booking yesterday and is the only factor missing to
make the recent rally as a healthy one. The midcap index is placed
at a crucial juncture and till the time it does not surpass its recent
congestion zone, traders are advised to be very selective in stock
specific trades.
.Key Levels
Support 1 – 11867 Resistance 1 – 12000
Support 2 – 11800 Resistance2 – 12050

www.angelbroking.com
Technical & Derivatives Report
October 13, 2020
Nifty Vs OI
10800
11000
11200
11400
11600
11800
12000
,0
2,000
4,000
6,000
8,000
10,000
12,000
14,000
9/30 10/1 10/5 10/6 10/7 10/8 10/9 10/12
(`000)
Openinterest Nifty
View
s
The indices started the week on a positive note, but it
witnessed some profit booking from the 12000 mark
and ended the day with marginal gains at 11930.
FIIs bought worth Rs.615 crores in cash segment. In
index future segment, they sold worth Rs.701 crores
with fall in open interest, indicating long unwinding and
short formations in yesterday’s session.
There was no significant change in the open interest in
indices, while FII's unwound some of their long
positions in the index futures. However, majority of their
positions are on the long side as their 'Long Short Ratio'
is above 71 percent. In the options segment, 12000 call
added some open interest while marginal addition was
seen in 12000-11900 put options. As per the data, the
immediate support for Nifty is placed around 11800
make while resistances are seen around 12000 and
12200. It is advisable for traders to look for buying
opportunities in intraday dips and trade with a positive
bias.
C
o
mme
n
t
s
The Nifty futures open interest has decreased by 0.41%
Bank Nifty futures open interest has increased by 1.05%
as market closed at 11930.95 levels.
The Nifty October future closed with a premium of 7.40
point against a premium of 15.60 point in last trading
session. The November series closed at a premium of
31.05 point.
The INDIA VIX has increased from 20.38 to 21.12.
At the same time, the PCR-OI of Nifty decreased from
1.60 to 1.40.
Few of the liquid counters where we have seen high cost
of carry are BHEL, SAIL, CIPLA, NATIONALUM, AND
MANAPPURAM.
OI Gainers
SCRIP OI
OI
CHG. (%)
PRICE
PRICE
CHG. (%)
CANBK 21340000 36.84 90.05 -5.19
WIPRO 33484800 12.73 377.50 1.30
COFORGE 588375 12.39 2667.75 7.99
MGL 1735800 8.96 810.15 -1.74
SRF 759000 7.24 4372.80 2.42
SUNTV 4213500 6.93 449.60 -2.25
NAUKRI 672000 6.75 3479.10 0.72
SAIL 60135000 6.39 33.55 -1.03
OI Losers
SCRIP OI
OI
CHG. (%)
PRICE
PRICE
CHG. (%)
VEDL 58955800 -17.87 96.95 -19.95
M&MFIN 15776964 -9.03 131.35 -1.79
MOTHERSUMI 25109000 -7.48 113.65 -6.30
GLENMARK 7723400 -6.31 495.55 0.39
ASIANPAINT 2393400 -5.19 2077.85 1.31
RAMCOCEM 1350650 -4.62 757.05 -1.87
CADILAHC 6751800 -4.45 441.50 0.97
TORNTPHARM 860500 -4.23 2840.80 1.72
Put-Call Ratio
SCRIP PCR-OI PCR-VOL
NIFTY 1.40 0.89
BANKNIFTY 0.86 0.90
RELIANCE 0.52 0.44
ICICIBANK 0.85 0.52
INFY 0.43 0.22
Historical Volatility
SCRIP HV
VEDL 69.14
COFORGE 68.59
BANKBARODA 58.94
MOTHERSUMI 77.06
CANBK 64.40
www.angelbroking.com
Technical & Derivatives Report
October 13, 2020
Note: Above mentioned Bullish or Bearish Spreads in Nifty (October Series) are given as an information and not as a recommendation.
Nifty Spot =
11930.95
FII Statistics for October 12, 2020
Detail Buy
Net Contracts
Open Interest
Sell
Value
(in Cr.)
Change
INDEX
FUTURES
3189.23
3889.91
(700.68) 149802
12161.12
(1.49)
INDEX
OPTIONS
205051.12
206269.07
(1217.95) 953588
77019.03
9.61
STOCK
FUTURES
11810.84
12758.82
(947.98) 1126196
80966.32
0.14
STOCK
OPTIONS
5228.62
5395.87
(167.25) 95565
7631.14
11.12
Total 225279.81
228313.67
(3033.86) 2325151
177777.61
4.14
Turnover on October 12, 2020
Instrument
No. of
Contracts
Turnover
( in Cr. )
Change
(%)
Index Futures
4,42,786 30745.58 -16.17
Index Options
1,91,25,122 13,74,030.59 2.57
Stock Futures
6,35,821 47959.46 -19.77
Stock Options
10,37,123 83327.90 -14.10
Total 2,12,40,852 15,36,063.53 0.20
Bull-Call Spreads
Action Strike Price Risk Reward BEP
Buy 11900 212.90
54.40 45.60 11954.40
Sell 12000 158.50
Buy 11900 212.90
98.75 101.25 11998.75
Sell 12100 114.15
Buy 12000 158.50
44.35 55.65 12044.35
Sell 12100 114.15
Bear-Put Spreads
Action Strike Price Risk Reward BEP
Buy 11900 173.85
39.05 60.95 11860.95
Sell 11800 134.80
Buy 11900 173.85
69.70 130.30 11830.30
Sell 11700 104.15
Buy 11800 134.80
30.65 69.35 11769.35
Sell 11700 104.15
Nifty Put-Call Analysis
,0
500,000
1000,000
1500,000
2000,000
2500,000
11300 11400 11500 11600 11700 11800 11900 12000 12100 12200 12300 12400 12500 12600
Call Put

www.angelbroking.com
Technical & Derivatives Report
October 13, 2020
Da
ily
Pivot Level
s for
Nifty Constituents
Scrips
S2
S1
PIVOT
R1
R2
ADANIPORTS
351
354
359
362
366
ASIANPAINT 2,023 2,051
2,069
2,096
2,114
AXISBANK
452
460
470
478
488
BAJAJ-AUTO 2,973 2,998
3,036
3,061
3,100
BAJFINANCE 3,263 3,295
3,337
3,369
3,412
BAJAJFINSV 5,826 5,869
5,935
5,978
6,044
BPCL
335
338
344
347
353
BHARTIARTL
400
408
419
426
438
BRITANNIA 3,691 3,711
3,743
3,763
3,795
CIPLA
792
803
811
822
831
COALINDIA
111
112
114
115
117
DIVISLAB 3,128 3,168
3,191
3,231
3,254
DRREDDY 5,063 5,142
5,190
5,269
5,317
EICHERMOT 2,133 2,157
2,195
2,219
2,257
GAIL
81
83
85
86
88
GRASIM
731
738
745
752
759
HCLTECH
850
858
865
873
880
HDFCBANK 1,184 1,199
1,221
1,236
1,258
HDFCLIFE
550
557
567
574
584
HDFC 1,912 1,939
1,969
1,995
2,026
HEROMOTOCO 3,223 3,254
3,305
3,336
3,386
HINDALCO
167
170
172
175
178
HINDUNILVR 2,112 2,125
2,136
2,15
0
2,161
ICICIBANK
396
400
405
409
414
IOC
74
75
76
77
78
INDUSINDBK
597
606
619
627
640
INFY 1,100 1,116
1,128
1,144
1,156
ITC
167
170
172
175
178
JSW STEEL
271
278
286
294
302
KOTAKBANK 1,276 1,294
1,326
1,345
1,377
LT
887
8
97
911
920
935
M&M
625
630
635
639
644
MARUTI 6,949 7,043
7,099
7,193
7,249
NESTLEIND 15,681
15,792
15,971
16,081
16,260
NTPC
81
82
83
84
85
ONGC
68
68
70
70
71
POWERGRID
156
158
160
162
165
RELIANCE 2,210 2,224
2,240
2,253
2,269
SBILIFE
772
782
797
807
823
SHREECEM 20,513
20,735
21,066
21,288
21,619
SBIN
192
195
201
204
209
SUNPHARMA
505
510
514
518
522
TCS 2,775 2,803
2,828
2,856
2,882
TATAMOTORS
130
133
136
139
143
TATASTEEL
356
363
370
378
385
TECHM
840
849
857
865
873
TITAN 1,226 1,241
1,251
1,267
1,277
ULTRACEMCO 4,190 4,248
4,305
4,363
4,419
UPL
488
497
503
513
518
WIPRO
365
371
375
382
386

www.angelbroking.com
Technical & Derivatives Report
October 13, 2020
*
Research Team Tel: 022 – 39357600 (Extn. 6844) Website: www.angelbroking.com
For Technical Queries E-mail: technicalresearch-cso@angelbroking.com
For Derivatives Queries E-mail: derivatives.desk@angelbroking.com
DISCLAIMER
Angel Broking Limited (hereinafter referred to as “Angel”) is a registered Member of National Stock Exchange of India Limited, Bombay
Stock Exchange Limited and Metropolitan Stock Exchange Limited. It is also registered as a Depository Participant with CDSL and
Portfolio Manager and Investment Adviser with SEBI. It also has registration with AMFI as a Mutual Fund Distributor. Angel Broking
Limited is a registered entity with SEBI for Research Analyst in terms of SEBI (Research Analyst) Regulations, 2014 vide registration
number INH000000164. Angel or its associates has not been debarred/ suspended by SEBI or any other regulatory authority for
accessing /dealing in securities Market. Angel or its associates/analyst has not received any compensation / managed or co-managed
public offering of securities of the company covered by Analyst during the past twelve months.
This document is solely for the personal information of the recipient, and must not be singularly used as the basis of any investment
decision. Nothing in this document should be construed as investment or financial advice. Each recipient of this document should make
such investigations as they deem necessary to arrive at an independent evaluation of an investment in the securities of the companies
referred to in this document (including the merits and risks involved), and should consult their own advisors to determine the merits
and risks of such an investment.
Reports based on technical and derivative analysis center on studying charts of a stock's price movement, outstanding positions and
trading volume, as opposed to focusing on a company's fundamentals and, as such, may not match with a report on a company's
fundamentals. Investors are advised to refer the Fundamental and Technical Research Reports available on our website to evaluate the
contrary view, if any.
The information in this document has been printed on the basis of publicly available information, internal data and other reliable
sources believed to be true, but we do not represent that it is accurate or complete and it should not be relied on as such, as this
document is for general guidance only. Angel Broking Limited or any of its affiliates/ group companies shall not be in any way
responsible for any loss or damage that may arise to any person from any inadvertent error in the information contained in this report.
Angel Broking Limited has not independently verified all the information contained within this document. Accordingly, we cannot
testify, nor make any representation or warranty, express or implied, to the accuracy, contents or data contained within this document.
While Angel Broking Limited endeavors to update on a reasonable basis the information discussed in this material, there may be
regulatory, compliance, or other reasons that prevent us from doing so.
This document is being supplied to you solely for your information, and its contents, information or data may not be reproduced,
redistributed or passed on, directly or indirectly.
Technical and Derivatives Team:
Sameet Chavan Chief Analyst - Technical & Derivatives sameet.chavan@angelbroking.com
Ruchit Jain Senior Analyst - Technical & Derivatives ruchit.jain@angelbroking.com
Rajesh Bhosale Technical Analyst rajesh.bhosle@angelbroking.com
Sneha Seth Derivatives Analyst sneha.seth@angelbroking.com
