www.angelbroking.com
Technical & Derivatives Report
Aug
ust 12, 2020
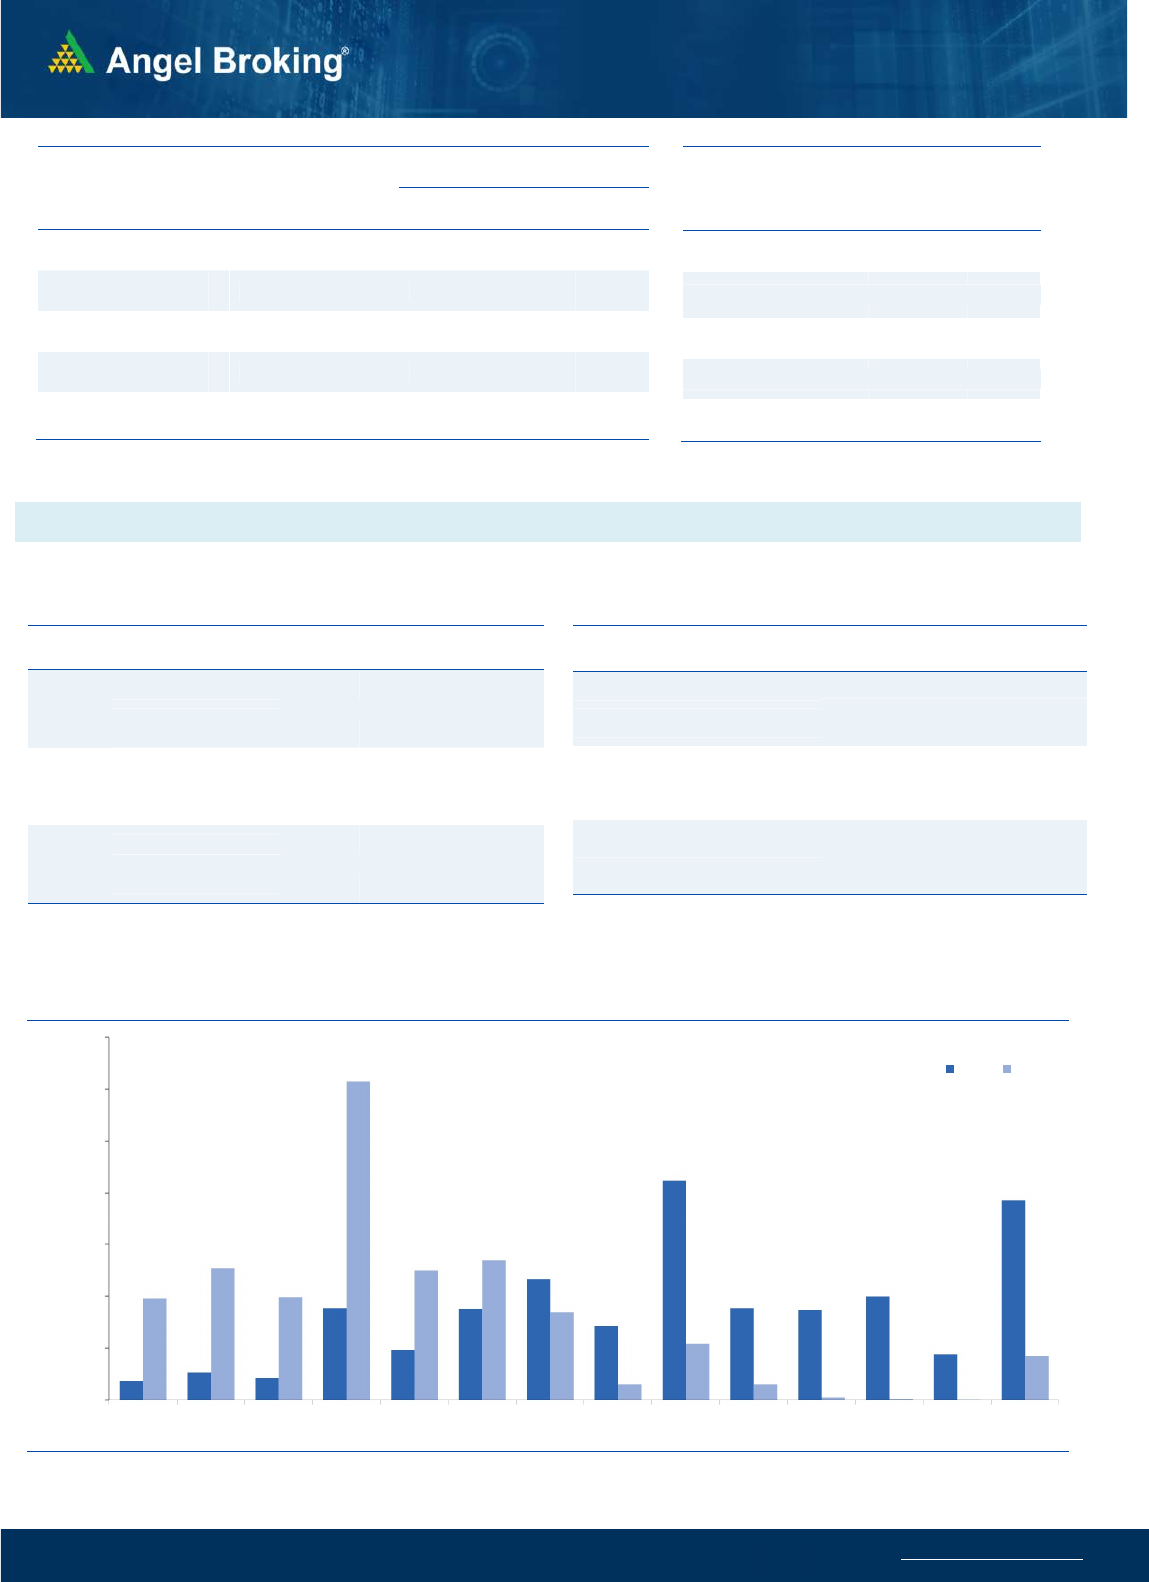
Nifty Bank Outlook - (22227)
Yesterday, Bank Nifty too started on a positive note however this
was followed by an intra-day dip. This dip got bought into in the
second half as bank nifty moved towards the high point of the day
to eventually end with gains of 1.49% at 22227.20
After a long time, Bank Nifty and banking stocks finally showed
outperformance in yesterday's session. On the daily chart, we are
witnessing a fresh buy crossover in RSI Smoothened
indicating that we may see some catch-up rally in bank nifty in the
near term after its recent underperformance. In such scenario, the
next resistance is placed around 22450 and 22670 levels whereas
support is placed around 22040 and 21922 levels. Traders can
have a stock-specific long approach from this basket however as
said above one should avoid aggressive bets.
Key Levels
Support 1 – 22040 Resistance 1 – 22450
Support 2 – 21922 Resistance 2 – 22670
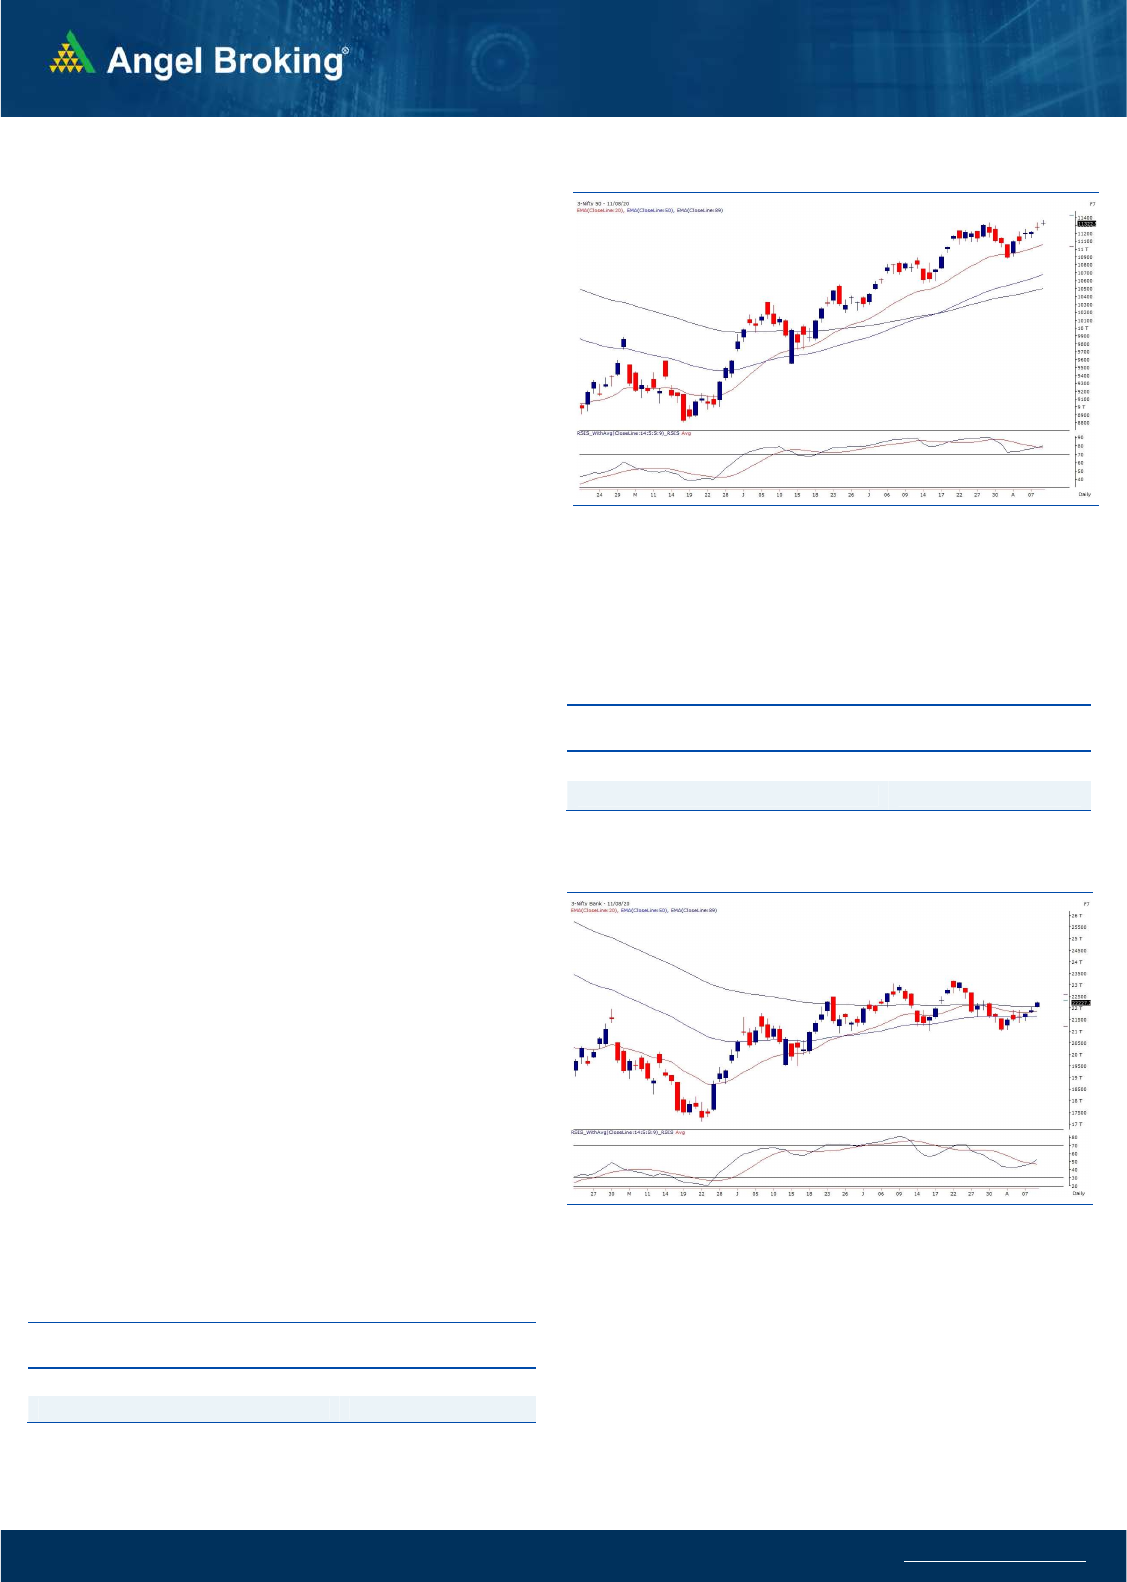
Exhibit 1: Nifty Daily Chart
Sensex (38407) / Nifty (11323)
Similar to previous session, yesterday too we had a gap up opening
in the wake of relentless run in Global peers and this time it was on
account of Russia claiming the vaccine for COVID-19. Subsequently,
our markets cooled off a bit after the initial upmove; but once again
regained strength in the latter half. Eventually, the Nifty ended the
session above the 11300 mark.
In last couple of sessions, although the undercurrent has been
positive, index is clearly lacking the momentum; because the real
focus has shifted to the individual stocks, especially from the
broader market. In fact yesterday, the banking space was the real
charioteer as it kept showing sheer outperformance throughout the
day. With all due respect to such positivity, we still remain a bit
skeptical and would continue advocating caution around current
levels. In such kind of euphoric situation, it is hard to take such view
but the way overall things are panning out, does not give us comfort
at all. In last four months, we never sounded such cautious, in fact
strongly advised using all decline to go long; but we do not maintain
the similar opinion now.
Exhibit 2: Nifty Bank Daily Chart
As far as levels are concerned, Nifty is still finding it very difficult to
surpass 11350 convincingly and hence 11350-11400 remains to be
a sturdy wall. On the downside, 11300-11238 are the levels to watch
out for. At present, traders are advised to focus on individual stocks
but aggressive bets should ideally be avoided.
Key Levels
Support 1 – 11300 Resistance 1 – 11350
Support 2 – 11238 Resistance 2 – 11400

www.angelbroking.com
Technical & Derivatives Report
August 12, 2020
Nifty Vs OI
10600
10700
10800
10900
11000
11100
11200
11300
11400
,0
2,000
4,000
6,000
8,000
10,000
12,000
14,000
16,000
7/20 7/22 7/24 7/28 7/30 8/3 8/5 8/7
(`000)
Openinterest Nifty
View
s
Quite similar to the previous session, Nifty after a gap
up opening witnessed a consolidation within a range
and ended with gains of 0.46% at 11322.50.
FIIs were net buyers in the cash market segment to the
tune of Rs. 1014 crores. In index futures, they bought
worth 106 crores with no relevant change in open
interest
.
Although no relevant change of open interest was seen
in Nifty, long formation was seen in the Bank Nifty index
as price upmove was supported by rise in open interest
of over 14 percent. FII's bought equities worth more
than 1000 crores while they added marginal longs in
the index futures segment. In options segment, 11400
call added open interest indicating immediate
resistance around this level, while supports are placed
at 11300 and 11200. Traders are advised to trade with
a stock specific approach from a near term perspective.
C
o
mme
n
t
s
The Nifty futures open interest has decreased by 0.12%
Bank Nifty futures open interest has increased by 14.11%
as market closed at 11322.70 levels.
The Nifty August future closed with a premium of 21.85
point against a premium of 23.2 point in last trading
session. The September series closed at a premium of
29.7 point.
The INDIA VIX has decreased from 22.51 to 21.36
At the same time, the PCR-OI of Nifty decreased from
1.59 to 1.43.
Few of the liquid counters where we have seen high cost
of carry are IDEA, DLF, MOTHERSUMI, SBIN AND
AUROPHARMA.
OI Gainers
SCRIP OI
OI
CHG. (%)
PRICE
PRICE
CHG. (%)
IBULHSGFIN 18407800 20.37 214.70 4.83
ZEEL 37875000 15.86 159.75 5.52
RAMCOCEM 2121600 13.76 698.95 1.91
GLENMARK 8204100 12.59 477.05 1.13
SUNTV 5830500 10.90 397.00 -0.26
JINDALSTEL 20420000 10.83 211.05 4.69
BEL 28279600 9.83 105.85 -2.21
NIITTECH 468750 8.98 1977.75 -1.04
OI Losers
SCRIP OI
OI
CHG. (%)
PRICE
PRICE
CHG. (%)
SHREECEM 150550 -9.66 21551.10 -3.99
CHOLAFIN 5097500 -9.62 207.15 -0.74
CENTURYTEX 2969400 -8.34 315.80 -2.31
TORNTPHARM 1555000 -8.02 2870.40 -4.46
PFC 48682400 -7.95 90.05 0.56
APOLLOHOSP 1228500 -6.90 1750.80 -1.28
HINDALCO 28027400 -6.71 178.95 0.20
AMARAJABAT 1420000 -6.52 742.70 -1.20
Put-Call Ratio
SCRIP PCR-OI PCR-VOL
NIFTY 1.43 0.90
BANKNIFTY 0.97 0.87
RELIANCE 0.75 0.42
ICICIBANK 0.53 0.49
INFY 0.65 0.46
Historical Volatility
SCRIP HV
IDFCFIRSTB 63.20
TORNTPHARM 48.53
SHREECEM 45.95
VOLTAS 45.79
TITAN 50.95
www.angelbroking.com
Technical & Derivatives Report
August 12, 2020
Note: Above mentioned Bullish or Bearish Spreads in Nifty (August Series) are given as an information and not as a recommendation.
Nifty Spot =
11322.50
FII Statistics for August 11, 2020
Detail Buy
Sell Net
Open Interest
Contracts
Value
(in Cr.)
Change
(%)
INDEX
FUTURES
2760.50
2654.30
106.20
109404
8474.96
0.13
INDEX
OPTIONS
153036.74
152878.47
158.27
644973
51216.07
6.91
STOCK
FUTURES
12187.69
14427.60
(2239.91) 1288525
90413.20
(0.63)
STOCK
OPTIONS
5598.83
5629.30
(30.47) 79720
5504.98
7.02
Total 173583.76
175589.67
(2005.91) 2122622
155609.21
1.87
Turnover on August 11, 2020
Instrument
No. of
Contracts
Turnover
( in Cr. )
Change
(%)
Index Futures 3,62,269 24266.43 3.63
Index Options 1,72,44,495
11,95,678.29
36.02
Stock Futures 7,96,201 57987.43 -3.02
Stock Options 11,66,142 90097.17 3.75
Total 1,95,69,107
13,68,029.32
30.40
Bull-Call Spreads
Action Strike Price Risk Reward BEP
Buy 11300 200.65
53.45 46.55 11353.45
Sell 11400 147.20
Buy 11300 200.65
97.85 102.15 11397.85
Sell 11500 102.80
Buy 11400 147.20
44.40 55.60 11444.40
Sell 11500 102.80
Bear-Put Spreads
Action Strike Price Risk Reward BEP
Buy 11300 155.55
36.80 63.20 11263.20
Sell 11200 118.75
Buy 11300 155.55
66.40 133.60 11233.60
Sell 11100 89.15
Buy 11200 118.75
29.60 70.40 11170.40
Sell 11100 89.15
Nifty Put-Call Analysis
,0
500,000
1000,000
1500,000
2000,000
2500,000
3000,000
3500,000
10700 10800 10900 11000 11100 11200 11300 11400 11500 11600 11700 11800 11900 12000
Call Put

www.angelbroking.com
Technical & Derivatives Report
August 12, 2020
Daily Pivot Levels for Nifty Constituents
Scrips
S2
S1
PIVOT
R1
R2
ADANIPORTS
328
332
334
338
340
ASIANPAINT 1,745 1,767
1,802
1,825
1,860
AXISBANK
430
439
444
454
459
BAJAJ-AUTO 2,957 2,982
3,021
3,0
46
3,085
BAJFINANCE 3,362 3,410
3,452
3,500
3,542
BAJAJFINSV 6,337 6,389
6,442
6,494
6,547
BPCL
409
419
426
436
443
BHARTIARTL
544
547
554
558
564
INFRATEL
188
191
195
198
202
BRITANNIA 3,800 3,840
3,905
3,945
4,010
CIPLA
750
764
7
83
797
816
COALINDIA
129
130
130
131
132
DRREDDY 4,460 4,528
4,633
4,701
4,807
EICHERMOT 21,034
21,238
21,454
21,658
21,874
GAIL
96
97
98
98
100
GRASIM
606
615
628
637
650
HCLTECH
669
677
689
696
708
HDFCBANK 1,040 1,053
1,062
1,
076
1,085
HDFC
602
605
610
613
617
HEROMOTOCO
1,792
1,809
1,828
1,846
1,864
HINDALCO 2,660 2,686
2,731
2,757
2,802
HINDUNILVR
173
176
181
184
190
ICICIBANK 2,190 2,200
2,217
2,227
2,244
IOC
358
363
369
373
379
INDUSINDBK
86
87
8
7
88
89
INFY
503
513
519
528
534
ITC
936
942
952
958
968
JSW STEEL
196
199
204
207
211
KOTAKBANK
243
248
252
257
261
LT 1,341 1,353
1,369
1,381
1,397
M&M
944
953
966
975
989
MARUTI
613
621
631
639
649
NESTLEIND 6,555 6,602 6,65
8
6,705
6,760
NTPC 16,459
16,541
16,663
16,745
16,868
ONGC
87
88
89
89
90
POWERGRID
77
78
79
80
81
RELIANCE
171
174
178
181
185
SHREECEM 2,072 2,103
2,131
2,162
2,191
SBIN 20,953
21,252
21,621
21,920
22,289
SUNPHARMA
192
194
195
1
97
198
TCS
527
534
542
549
556
TATAMOTORS 2,253 2,266
2,289
2,303
2,326
TATASTEEL
119
121
123
125
128
TECHM
404
410
419
425
434
TITAN
658
667
680
688
702
ULTRACEMCO 1,028 1,047
1,068
1,086
1,107
UPL 3,886 3,927
4,002
4,044
4,119
VEDANTA
470
476
486
492
503
WIPRO
275
277
281
283
287
ZEEL
149
155
158
163
166

www.angelbroking.com
Technical & Derivatives Report
August 12, 2020
*
Research Team Tel: 022 – 39357600 (Extn. 6844) Website: www.angelbroking.com
For Technical & Derivatives Queries E-mail: technicalresearch-cso@angelbroking.com
DISCLAIMER
Angel Broking Limited (hereinafter referred to as “Angel”) is a registered Member of National Stock Exchange of India Limited, Bombay
Stock Exchange Limited and Metropolitan Stock Exchange Limited. It is also registered as a Depository Participant with CDSL and
Portfolio Manager and Investment Adviser with SEBI. It also has registration with AMFI as a Mutual Fund Distributor. Angel Broking
Limited is a registered entity with SEBI for Research Analyst in terms of SEBI (Research Analyst) Regulations, 2014 vide registration
number INH000000164. Angel or its associates has not been debarred/ suspended by SEBI or any other regulatory authority for
accessing /dealing in securities Market. Angel or its associates/analyst has not received any compensation / managed or co-managed
public offering of securities of the company covered by Analyst during the past twelve months.
This document is solely for the personal information of the recipient, and must not be singularly used as the basis of any investment
decision. Nothing in this document should be construed as investment or financial advice. Each recipient of this document should make
such investigations as they deem necessary to arrive at an independent evaluation of an investment in the securities of the companies
referred to in this document (including the merits and risks involved), and should consult their own advisors to determine the merits
and risks of such an investment.
Reports based on technical and derivative analysis center on studying charts of a stock's price movement, outstanding positions and
trading volume, as opposed to focusing on a company's fundamentals and, as such, may not match with a report on a company's
fundamentals. Investors are advised to refer the Fundamental and Technical Research Reports available on our website to evaluate the
contrary view, if any.
The information in this document has been printed on the basis of publicly available information, internal data and other reliable
sources believed to be true, but we do not represent that it is accurate or complete and it should not be relied on as such, as this
document is for general guidance only. Angel Broking Limited or any of its affiliates/ group companies shall not be in any way
responsible for any loss or damage that may arise to any person from any inadvertent error in the information contained in this report.
Angel Broking Limited has not independently verified all the information contained within this document. Accordingly, we cannot
testify, nor make any representation or warranty, express or implied, to the accuracy, contents or data contained within this document.
While Angel Broking Limited endeavors to update on a reasonable basis the information discussed in this material, there may be
regulatory, compliance, or other reasons that prevent us from doing so.
This document is being supplied to you solely for your information, and its contents, information or data may not be reproduced,
redistributed or passed on, directly or indirectly.
Technical and Derivatives Team:
Sameet Chavan Chief Analyst - Technical & Derivatives sameet.chavan@angelbroking.com
Ruchit Jain Senior Analyst - Technical & Derivatives ruchit.jain@angelbroking.com
Rajesh Bhosale Technical Analyst rajesh.bhosle@angelbroking.com
Sneha Seth Derivatives Analyst sneha.seth@angelbroking.com
