www.angelbroking.com
April 12, 2021
Technical & Derivatives Report
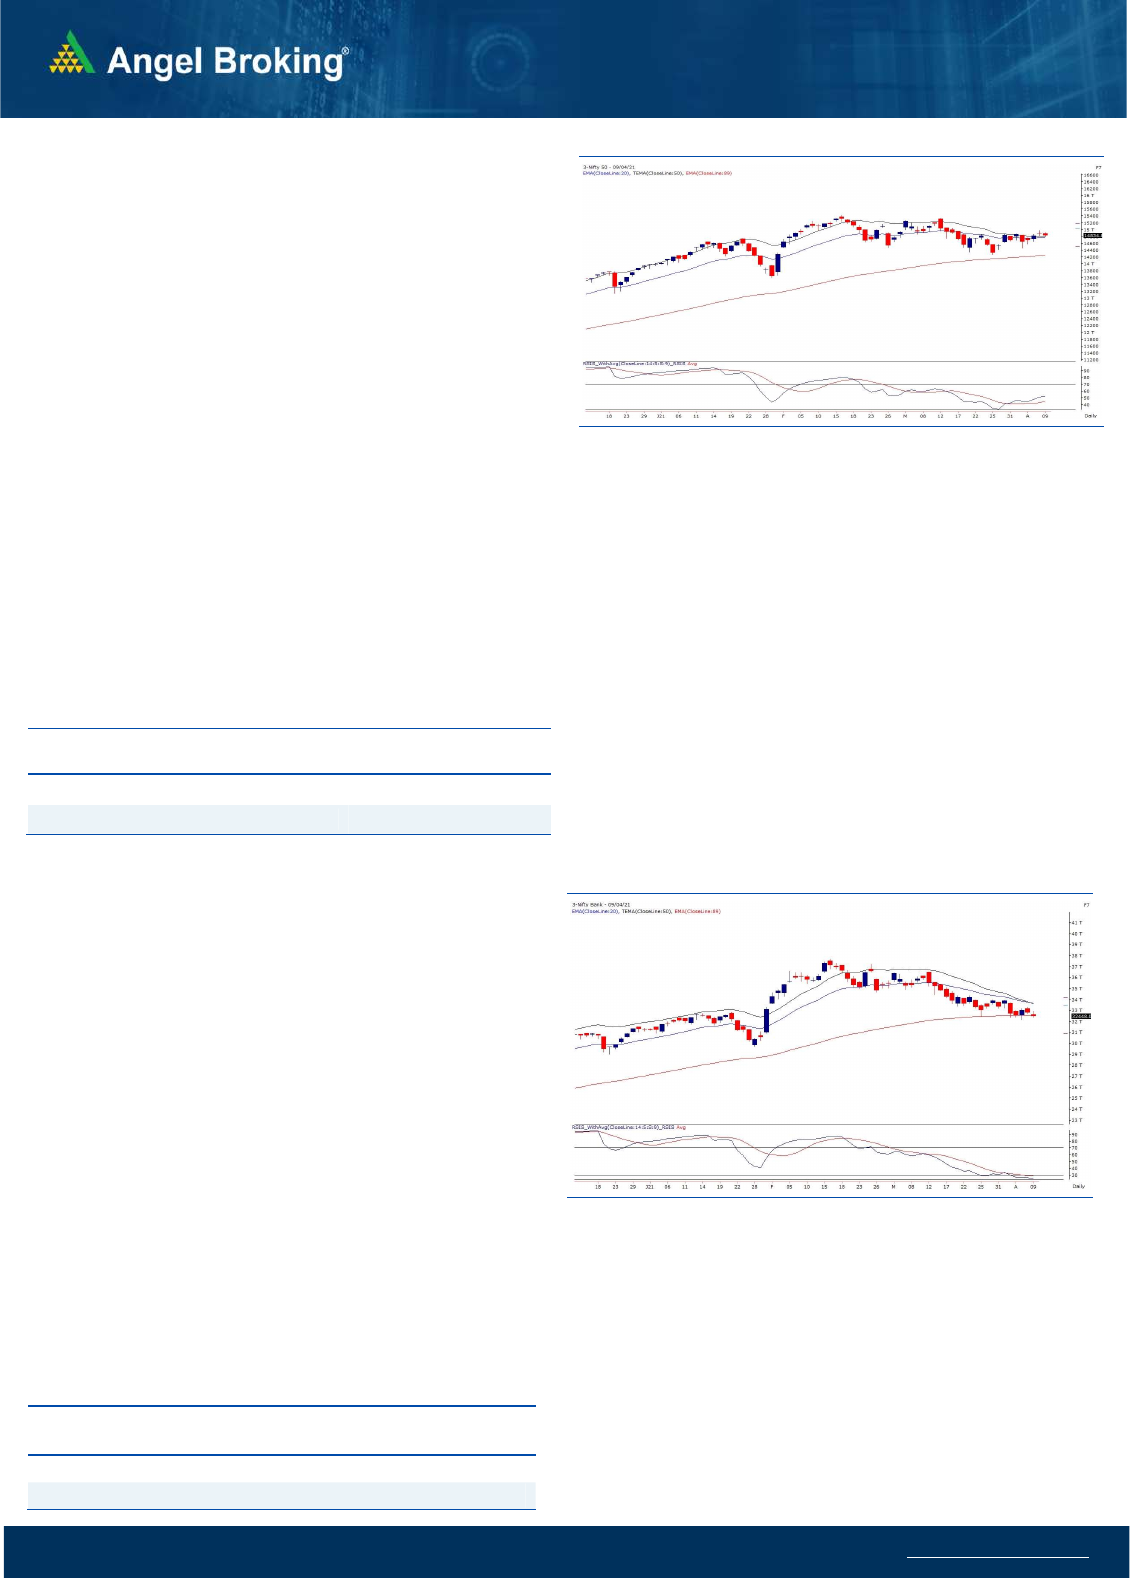
Exhibit 1: Nifty Daily Chart
Nifty
Bank Out
look
-
(
32448)
We started off the week with a downside gap due to the weekend
lockdown announced amid COVID surge. Post opening, strong selling
pressure was seen from the word go to drag index below the recent
lows of 32415. As the week progressed, we saw few attempts of
recovery but 33200-33300 acted as a supply zone. Any pull back move
was being sold into and eventually we concluded the week with a
major cut of four percent. As far as technical chart structure are
concerned, the banking index has been hovering around the crucial
‘Make or Break’ level of 89EMA on daily chart which is placed around
32200-32400. Except for Thursday, almost daily BankNifty made an
attempt to breach the important support zone but managed to sustain
above same on the weekly close. We have been mentioning in the daily
article, at how important levels is banking index placed and shall
decide the further trend for market. Considering the price action in the
week gone by, we are a bit skeptical as in any bottom formation the
recovery happens too fast to actually realize which is not the case this
time. This is indeed not a very healthy sign for Bulls, hence, we would
preferred being light in market and keep a close watch how things pan
out in next 2-3 sessions.
Key Levels
Support 1 – 32000 Resistance 1 – 33300
Support 2 – 31750 Resistance 2 – 33500
Se
nsex
(
49591)
/ Nifty
(
14835
)
During the last week, trading started on a sluggish note on Monday
morning as indicated by the SGX Nifty. However things worsened as the
day progressed to test sub-14500 levels. Fortunately, there was no
further damage done as we witnessed a gradual recovery throughout
the remaining part of the week to reclaim the 14800 mark on a closing
basis; but ended with a negligible loss as compared to the previous
weekly close.
Overall if we see, major indices have gone nowhere as it was a week of
boredom and consolidation for them. There were one or two odd days
when we witnessed some action in index heavyweights; but didn’t last
too long as breakout attempts on either sides were turned unsuccessful.
In the upward direction, we were seeing 14900 as a crucial hurdle on a
closing basis and after nearly twelve trading sessions, bulls attempted to
break this barrier on an intraday basis; but failed to maintain at the close.
So 14900 – 15000 continues to remain a sturdy wall and till the time we
do not surpass it, major heavyweights are not going to give any
sustainable up move. Yes, at the same time, it’s not falling either; in fact
the undertone remained bullish for the major part of the week. On the
lower side, 14700 followed by 14550 are to be seen as immediate
supports.
Key Levels
Support 1 – 14770 Resistance 1 – 14950
Support 2 – 14700 Resistance2 – 15000
Exhibit 2: Nifty Bank Daily Chart
The deciding factor in days to come has to be the financial space. Since
last couple of weeks, the banking index has been hovering around its
strong support zone of 32200 – 32400 which is the breakout point on
the budget day as well as the ’89-EMA’ on daily chart. It has managed
to hold this till now and if any recovery has to take place, there will not
be a better place than this. But in our sense, if any bottom (short or long
term) is to be formed; it does not give so many opportunities for the
bulls to get in as it has been giving in last few days. It just happens in a
flash and takes off before anyone could realize. This is clearly not the
case at present and hence, the more it challenges any particular support,
the higher it creates possibility of breaking it. Hence, all eyes would be
on this development as it is likely to dictate the near term direction for
the market. Throughout this week, lot of thematic moves kept buzzing
and hence, one can definitely keep tracking such potential candidates;
but avoid being complacent at the same time.
www.angelbroking.com
Technical & Derivatives Report
April 12, 2021
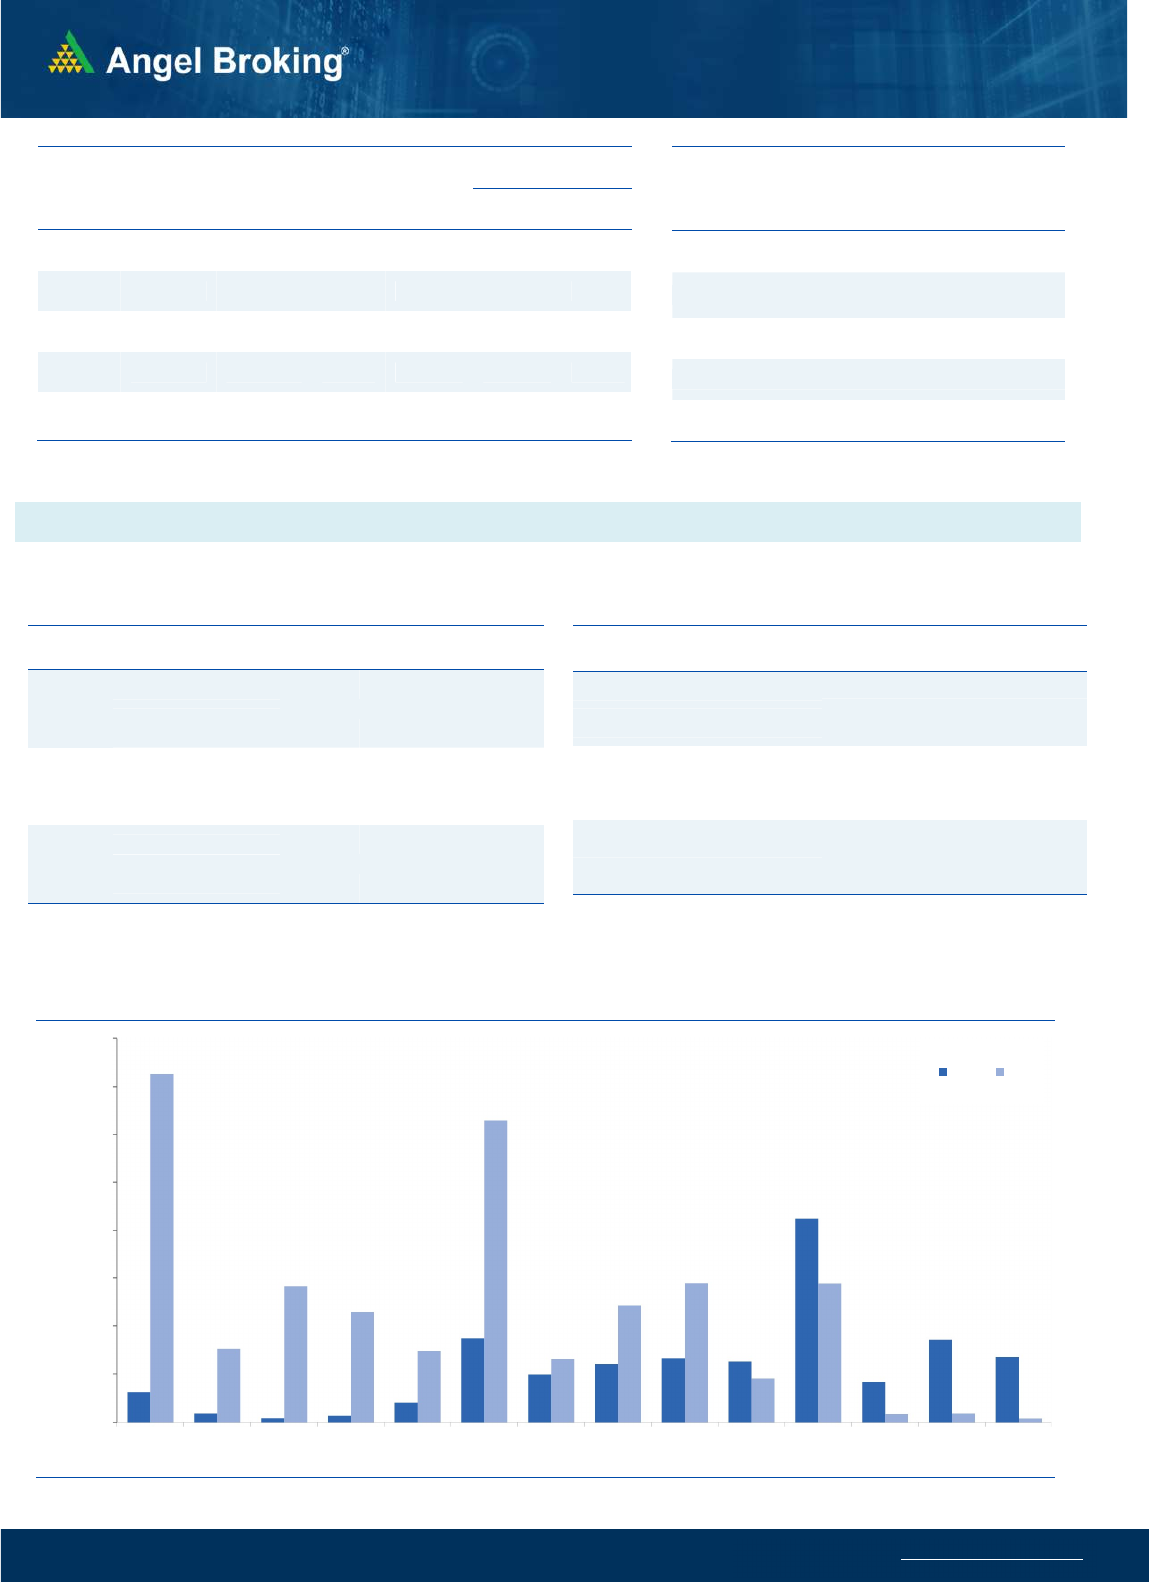
Nifty Vs OI
13800
14000
14200
14400
14600
14800
15000
15200
15400
,0
20,000
40,000
60,000
80,000
100,000
120,000
140,000
160,000
3/10 3/16 3/18 3/22 3/24 3/26 3/31 4/5 4/7 4/9
(`000)
Openinterest Nifty
View
We witnessed some upmove in Nifty during the week
wherein the index tried to surpass its hurdle of 14900-
15000, However, the index was unable to do so
without the support of banking space and ended the
week tad below 14850
.
FIIs were net sellers in the cash segment to the tune of
Rs. 654 crores. In index futures front, they sold worth
Rs. 639 crores with increase in open interest indicating
short formations on Friday.
During the week, Nifty witnessed some long
formation, while decent unwinding was seen in the
Bank Nifty. FII’s have squared off some of their index
futures long positions and their ‘Long Short Ratio’ at
the end of week stands at 57.5 percent. The options
data hints resistance at 14900-15000 range while
support is placed in the range of 14500-14400. While
Nifty is consolidating, the banking space is
underperforming and stocks from other sectors such
as Pharma, IT, Metals have seen good long formation.
Thus, it is advisable to trade with a sector/stock
specific approach until we see a clear breakout from
the range on either side
.
C
o
mme
n
t
s
The Nifty futures open interest has increased by 7.79%.
Bank Nifty futures open interest has increased by 1.95%
as market closed at 14834.85 levels.
The Nifty April future closed with a premium of point
54.55 against a premium of 50.6 point in last trading
session. The May series closed at a premium of 107.4
point.
The INDIA VIX decreased from 20.31 to 19.78.
At the same time, the PCR-OI of Nifty increased from 1.20
to 1.29.
Few of the liquid counters where we have seen high cost
of carry are IDEA, JINDALSTEL, ALKEM, APLLTD, AND
GRANULES.
OI Gainers
SCRIP OI
OI
CHG. (%)
PRICE
PRICE
CHG. (%)
ALKEM 311600 38.37 2832.30 4.77
PFIZER 91375 20.83 4801.65 4.05
APLLTD 1103850 18.62 1013.75 4.26
GLENMARK 9234500 17.91 529.65 4.90
SIEMENS 933900 14.81 1849.00 0.29
CADILAHC 11948200 14.41 514.45 9.23
SHREECEM 175650 13.47 31750.60 0.55
LTI 465600 12.75 4378.65 1.40
OI Losers
SCRIP OI
OI
CHG. (%)
PRICE
PRICE
CHG. (%)
AARTIIND 494700 -10.67 1404.20 -1.33
NAM-INDIA 1344000 -10.35 352.65 -1.97
HINDALCO 30168800 -8.50 361.05 -1.27
COFORGE 698625 -7.36 3167.85 2.45
TECHM 13702800 -6.86 1053.00 2.15
IDFCFIRSTB 207936000 -6.83 55.80 -1.32
ASHOKLEY 41841000 -5.93 121.20 -1.26
M&MFIN 18312000 -5.82 192.90 -0.89
Put-Call Ratio
SCRIP PCR-OI PCR-VOL
NIFTY 1.29 0.90
BANKNIFTY 0.71 0.94
RELIANCE 0.50 0.48
ICICIBANK 0.47 0.41
INFY 0.49 0.32
Historical Volatility
SCRIP HV
CADILAHC 41.85
ALKEM 35.59
CIPLA 39.48
AUBANK 58.88
PFIZER 39.16
www.angelbroking.com
Technical & Derivatives Report
April 12, 2021
Note: Above mentioned Bullish or Bearish Spreads in Nifty (April Series) are given as an information and not as a recommendation.
Nifty Spot =
14834.90
FII Statistics for April 09, 2021
Detail Buy
Net Contracts
Open Interest
Sell
Value
(in Cr.)
Change
INDEX
FUTURES
3657.40
4296.88
(639.48) 110199
11650.96
7.36
INDEX
OPTIONS
248099.35
246560.97
1538.38
788968
80193.52
19.55
STOCK
FUTURES
11221.87
11888.11
(666.24) 1069861
93990.81
(0.02)
STOCK
OPTIONS
13595.11
13749.18
(154.07) 162299
14788.62
7.50
Total 276573.73
276495.14
78.59
2131327
200623.91
7.44
Turnover on April 09, 2021
Instru
ment
No. of
Contracts
Turnover
( in Cr. )
Change
(%)
Index Futures
3,09,002 29035.19 -8.62
Index Options 2,08,32,601 19,72,246.69 -76.09
Stock Futures
6,91,968 68189.31 -0.28
Stock Options 15,95,237 1,64,995.93 5.70
Total 2,34,28,808 22,34,467.12 -73.73
Bull-Call Spreads
Action Strike Price Risk Reward BEP
Buy 14800 314.30
61.00 39.00 14861.00
Sell 14900 253.30
Buy 14800 314.30
111.35 88.65 14911.35
Sell 15000 202.95
Buy 14900 253.30
50.35 49.65 14950.35
Sell 15000 202.95
Bear-Put Spreads
Action Strike Price Risk Reward BEP
Buy 14800 226.85
35.00 65.00 14765.00
Sell 14700 191.85
Buy 14800 226.85
64.80 135.20 14735.20
Sell 14600 162.05
Buy 14700 191.85
29.80 70.20 14670.20
Sell 14600 162.05
Nifty Put-Call Analysis
,0
500,000
1000,000
1500,000
2000,000
2500,000
3000,000
3500,000
4000,000
14000 14100 14200 14300 14400 14500 14600 14700 14800 14900 15000 15100 15200 15300
Call Put

www.angelbroking.com
Technical & Derivatives Report
April 12, 2021
Da
ily
Pivot Level
s for
Nifty Constituents
Scrips
S2
S1
PIVOT
R1
R2
ADANIPORTS
806
815
826
835
846
ASIANPAINT 2,587 2,609
2,632
2,654
2,677
AXISBANK
654
661
674
681
694
BAJAJ-AUTO 3,588 3,620
3,657
3,689
3,726
BAJFINANCE 4,744 4,808
4,909
4,973
5,074
BAJAJFINSV 9,481 9,555
9,635
9,709
9,789
BPCL
420
423
427
430
435
BHARTIARTL
531
538
544
551
557
BRITANNIA 3,757 3,777
3,810
3,831
3,864
CIPLA
815
8
49
871
905
926
COALINDIA
127
128
130
131
133
DIVISLAB 3,636 3,694
3,738
3,797
3,841
DRREDDY 4,646 4,703
4,749
4,806
4,851
EICHERMOT 2,477 2,499
2,537
2,559
2,597
GRASIM 1,411 1,425
1,447
1,462
1,484
HCLTECH 1,024 1,035
1,045
1,055
1,065
HDFCBANK 1,406 1,414
1,423
1,431
1,441
HDFCLIFE
683
689
696
702
709
HDFC 2,457 2,485
2,521
2,549
2,584
HEROMOTOCO 2,874 2,893
2,921
2,940
2,968
HINDALCO
347
354
362
369
377
HINDUNILVR 2,402 2,439
2,461
2,498
2,520
ICICIBANK
556
561
570
575
584
IOC
90
91
92
93
94
INDUSINDBK
905
914
927
936
949
INFY 1,417 1,429
1,442
1,454
1,467
ITC
210
212
214
215
217
JSW STEEL
584
602
617
635
649
KOTAKBANK 1,721 1,760
1,783
1,822
1,846
LT 1,386 1,395
1,406
1,415
1,426
M&M
776
784
792
800
808
MARUTI 6,730 6,778
6,827
6,876
6,924
NESTLEIND 17,298
17,445
17,647
17,794
17,996
NTPC
100
101
104
105
107
ONGC
102
103
104
105
106
POWERGRID
206
207
209
211
213
RELIANCE 1,963 1,973
1,989
1,999
2,016
SBILIFE
893
902
909
917
925
SHREECEM 30,750
31,249
31,620
32,119
32,490
SBIN
343
348
356
361
370
SUNPHARMA
597
617
629
649
662
TCS 3,282 3,302
3,328
3,348
3,375
TATACONSUM
657
668
677
688
697
TATAMOTORS
306
312
319
325
331
TATASTEEL
861
880
905
924
949
TECHM 1,002 1,027
1,042
1,068
1,082
TITAN 1,534 1,563
1,590
1,620
1,647
ULTRACEMCO 6,627 6,726
6,891
6,991
7,155
UPL
615
625
641
650
666
WIPRO
436
443
447
454
459

www.angelbroking.com
Technical & Derivatives Report
April 12, 2021
*
Research Team Tel: 022 – 39357600 (Extn. 6844) Website: www.angelbroking.com
For Derivatives Queries E-mail: derivatives.desk@angelbroking.com
DISCLAIMER
Angel Broking Limited (hereinafter referred to as “Angel”) is a registered Member of National Stock Exchange of India Limited, Bombay
Stock Exchange Limited and Metropolitan Stock Exchange Limited. It is also registered as a Depository Participant with CDSL and
Portfolio Manager and Investment Adviser with SEBI. It also has registration with AMFI as a Mutual Fund Distributor. Angel Broking
Limited is a registered entity with SEBI for Research Analyst in terms of SEBI (Research Analyst) Regulations, 2014 vide registration
number INH000000164. Angel or its associates has not been debarred/ suspended by SEBI or any other regulatory authority for
accessing /dealing in securities Market. Angel or its associates/analyst has not received any compensation / managed or co-managed
public offering of securities of the company covered by Analyst during the past twelve months.
This document is solely for the personal information of the recipient, and must not be singularly used as the basis of any investment
decision. Nothing in this document should be construed as investment or financial advice. Each recipient of this document should make
such investigations as they deem necessary to arrive at an independent evaluation of an investment in the securities of the companies
referred to in this document (including the merits and risks involved), and should consult their own advisors to determine the merits
and risks of such an investment.
Reports based on technical and derivative analysis center on studying charts of a stock's price movement, outstanding positions and
trading volume, as opposed to focusing on a company's fundamentals and, as such, may not match with a report on a company's
fundamentals. Investors are advised to refer the Fundamental and Technical Research Reports available on our website to evaluate the
contrary view, if any.
The information in this document has been printed on the basis of publicly available information, internal data and other reliable
sources believed to be true, but we do not represent that it is accurate or complete and it should not be relied on as such, as this
document is for general guidance only. Angel Broking Limited or any of its affiliates/ group companies shall not be in any way
responsible for any loss or damage that may arise to any person from any inadvertent error in the information contained in this report.
Angel Broking Limited has not independently verified all the information contained within this document. Accordingly, we cannot
testify, nor make any representation or warranty, express or implied, to the accuracy, contents or data contained within this document.
While Angel Broking Limited endeavors to update on a reasonable basis the information discussed in this material, there may be
regulatory, compliance, or other reasons that prevent us from doing so.
This document is being supplied to you solely for your information, and its contents, information or data may not be reproduced,
redistributed or passed on, directly or indirectly.
Technical and Derivatives Team:
Sameet Chavan Chief Analyst - Technical & Derivatives sameet.chavan@angelbroking.com
Ruchit Jain Senior Analyst - Technical & Derivatives ruchit.jain@angelbroking.com
Rajesh Bhosale Technical Analyst rajesh.bhosle@angelbroking.com
Sneha Seth Derivatives Analyst sneha.seth@angelbroking.com
